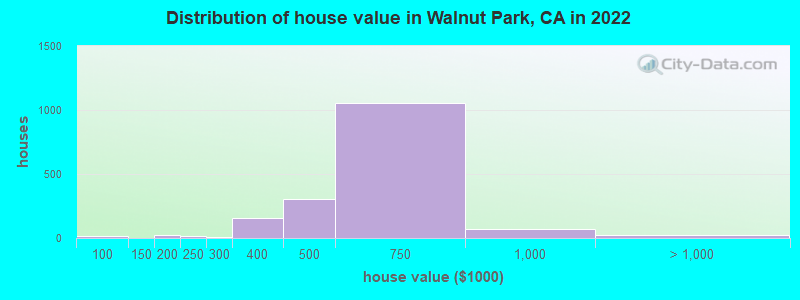
Estimated median house or condo value in 2022: $610,636 (it was $166,800 in 2000)
Walnut Park:
$610,636
CA:
$715,900
Mean prices in 2022:all housing units: over $1,000,000; detached houses: over $1,000,000; townhouses or other attached units: $750,854; in 2-unit structures: over $1,000,000; in 3-to-4-unit structures: $791,642; in 5-or-more-unit structures: $738,503; mobile homes: $205,184; occupied boats, rvs, vans, etc.: $276,239
Median gross rent in 2022: $1,341.
March 2022 cost of living index in Walnut Park: 138.3 (high, U.S. average is 100)
Percentage of residents living in poverty in 2022: 15.7%
(13.3% for White Non-Hispanic residents, 15.5% for Hispanic or Latino residents, 25.7% for American Indian residents, 18.0% for other race residents, 11.1% for two or more races residents)
According to our research of California and other state lists, there was 1 registered sex offender living in Walnut Park, California as of May 23, 2024. The ratio of all residents to sex offenders in Walnut Park is 15,917 to 1. The ratio of registered sex offenders to all residents in this city is much lower than the state average.
Recent articles from our blog. Our writers, many of them Ph.D. graduates or candidates, create easy-to-read articles on a wide variety of topics.
Latest news from Walnut Park, CA collected exclusively by city-data.com from local newspapers, TV, and radio stations
Current Local Time: PST time zone
Elevation: 145 feet
Land area: 0.74 square miles.
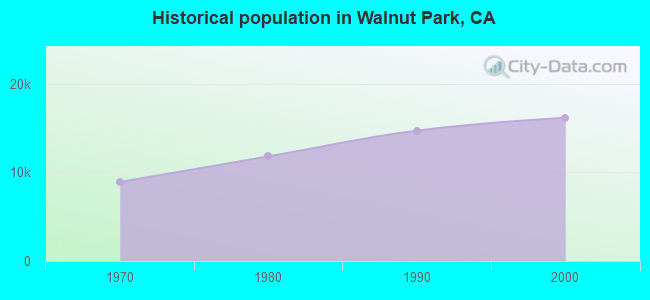
Population density: 21,629 people per square mile (very high).
7,085 residents are foreign born (44.5% Latin America).
This place:
44.7%
California:
26.5%
Median real estate property taxes paid for housing units with mortgages in 2022: $4,516 (0.7%) Median real estate property taxes paid for housing units with no mortgage in 2022: $2,876 (0.5%)
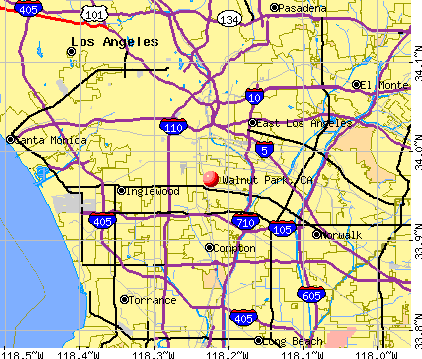
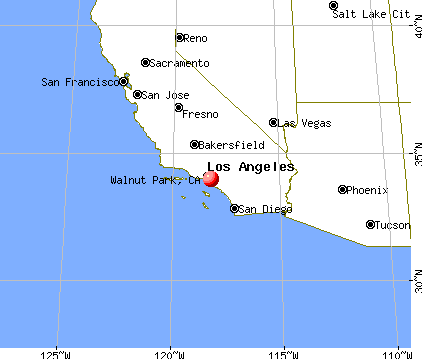
Nearest city with pop. 50,000+: Huntington Park, CA (1.0 miles , pop. 61,348).
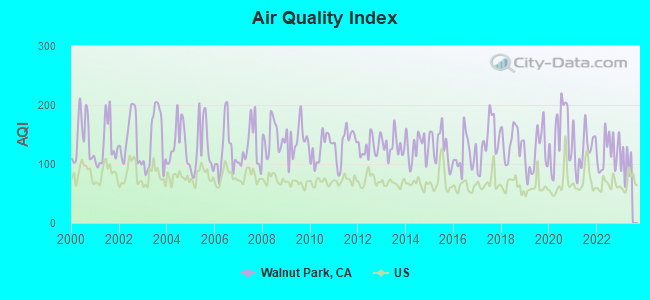
Air Quality Index (AQI) level in 2022 was 121. This is significantly worse than average.
City:
121
U.S.:
73
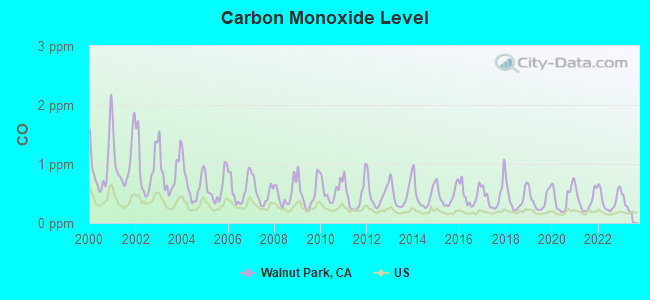
Carbon Monoxide (CO) [ppm] level in 2022 was 0.383. This is significantly worse than average.Closest monitor was 2.9 miles away from the city center.
City:
0.383
U.S.:
0.251
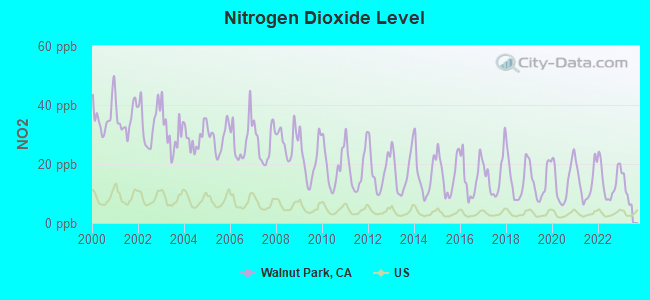
Nitrogen Dioxide (NO2) [ppb] level in 2022 was 14.1. This is significantly worse than average.Closest monitor was 2.9 miles away from the city center.
City:
14.1
U.S.:
5.1
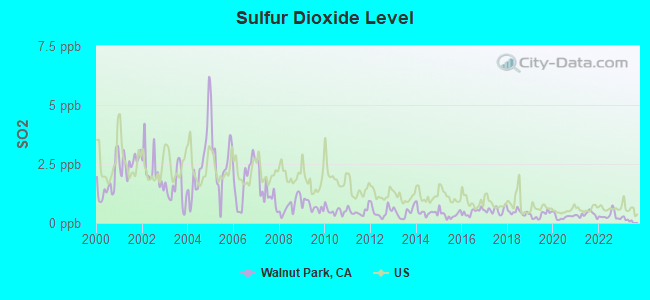
Sulfur Dioxide (SO2) [ppb] level in 2022 was 0.310. This is significantly better than average.Closest monitor was 2.9 miles away from the city center.
City:
0.310
U.S.:
1.515
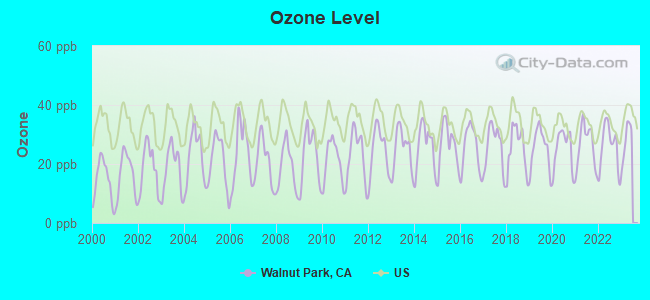
Ozone [ppb] level in 2022 was 25.8. This is better than average.Closest monitor was 2.9 miles away from the city center.
City:
25.8
U.S.:
33.3
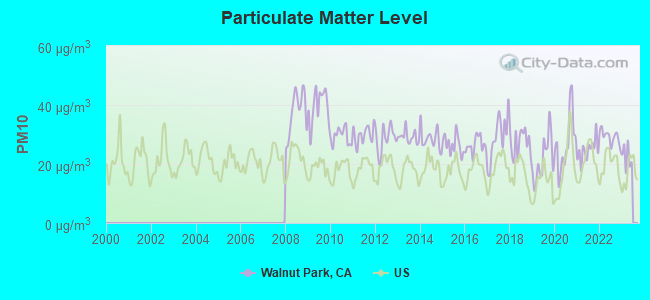
Particulate Matter (PM10) [µg/m3] level in 2022 was 29.1. This is significantly worse than average.Closest monitor was 6.8 miles away from the city center.
City:
29.1
U.S.:
19.2
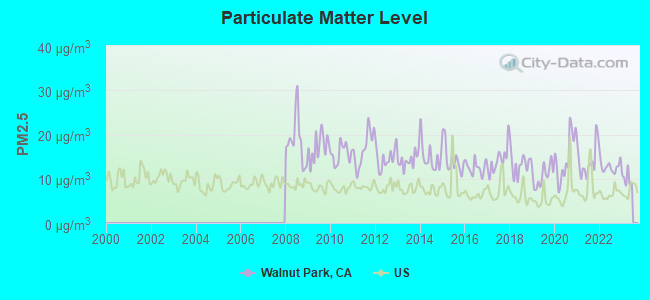
Particulate Matter (PM2.5) [µg/m3] level in 2022 was 12.8. This is significantly worse than average.Closest monitor was 2.9 miles away from the city center.
City:
12.8
U.S.:
8.1
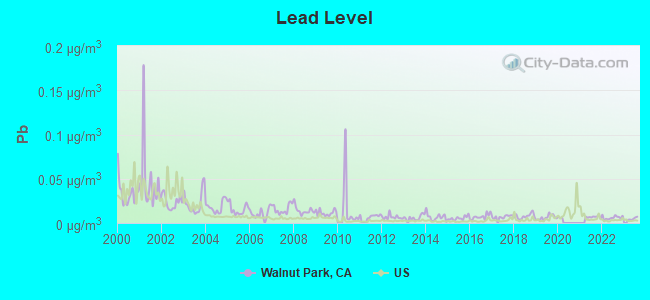
Lead (Pb) [µg/m3] level in 2022 was 0.00604. This is significantly better than average.Closest monitor was 2.9 miles away from the city center.
City:
0.00604
U.S.:
0.00931
Earthquake activity:
Walnut Park-area historical earthquake activity is significantly above California state average. It is 6931% greater than the overall U.S. average.
On 7/21/1952 at 11:52:14, a magnitude 7.7 (7.7 UK, Class: Major, Intensity: VIII - XII) earthquake occurred 83.9 miles away from the city center, causing $50,000,000 total damage On 6/28/1992 at 11:57:34, a magnitude 7.6 (6.2 MB, 7.6 MS, 7.3 MW, Depth: 0.7 mi) earthquake occurred 98.1 miles away from Walnut Park center, causing 3 deaths (1 shaking deaths, 2 other deaths) and 400 injuries, causing $100,000,000 total damage and $40,000,000 insured losses On 10/16/1999 at 09:46:44, a magnitude 7.4 (6.3 MB, 7.4 MS, 7.2 MW, 7.3 ML) earthquake occurred 109.0 miles away from the city center On 11/4/1927 at 13:51:53, a magnitude 7.5 (7.5 UK) earthquake occurred 173.0 miles away from Walnut Park center On 1/17/1994 at 12:30:55, a magnitude 6.8 (6.4 MB, 6.8 MS, 6.7 MW, Depth: 11.4 mi, Class: Strong, Intensity: VII - IX) earthquake occurred 23.9 miles away from Walnut Park center, causing 60 deaths (60 shaking deaths) and 7000 injuries On 4/21/1918 at 22:32:30, a magnitude 6.8 (6.8 UK) earthquake occurred 46.3 miles away from the city center Magnitude types: body-wave magnitude (MB), local magnitude (ML), surface-wave magnitude (MS), moment magnitude (MW)
Natural disasters:
The number of natural disasters in Los Angeles County (57) is a lot greater than the US average (15). Major Disasters (Presidential) Declared: 27 Emergencies Declared: 3
Causes of natural disasters: Fires: 37, Floods: 16, Storms: 9, Winter Storms: 6, Landslides: 5, Mudslides: 5, Earthquakes: 3, Freeze: 1, Heavy Rain: 1, Hurricane: 1, Snow: 1, Tornado: 1, Wind: 1, Other: 1 (Note: some incidents may be assigned to more than one category).
Hospitals and medical centers near Walnut Park:
COMMUNITY AND MISSION HOSPITAL OF HUNTINGTON PARK (Hospital, about 1 miles away; HUNTINGTON PARK, CA)
HUNTINGTON PARK NURSING CENTER (Nursing Home, about 1 miles away; HUNTINGTON PARK, CA)
GREENFIELD CARE CENTER OF SOUTH GATE (Nursing Home, about 1 miles away; SOUTH GATE, CA)
HUNTINGTON PARK DIALYSIS (Dialysis Facility, about 2 miles away; HUNTINGTON PARK, CA)
COMMUNITY HOSPITAL OF HUNTINGTON PARK Acute Care Hospitals (about 2 miles away; HUNTINGTON PARK, CA)
GOOD SHEPHERD NURSING HOME (Nursing Home, about 2 miles away; LOS ANGELES, CA)
DAVITA-PREMIER DIALYSIS CENTER (Dialysis Facility, about 3 miles away; CUDAHY, CA)
Amtrak stations near Walnut Park:
7 miles: LOS ANGELES (800 N. ALAMEDA ST.) . Services: ticket office, fully wheelchair accessible, enclosed waiting area, public restrooms, public payphones, snack bar, free short-term parking, paid long-term parking, car rental agency, taxi stand, public transit connection.
11 miles: GLENDALE (400 W. CERRITOS AVE.) . Services: fully wheelchair accessible, public payphones, free short-term parking, free long-term parking, call for taxi service, intercity bus service, public transit connection.
13 miles: PASADENA (150 S. ROBLES AVE.) - Bus Station . Services: fully wheelchair accessible, enclosed waiting area, public restrooms, public payphones, full-service food facilities, paid short-term parking, paid long-term parking, taxi stand, public transit connection.
Colleges/universities with over 2000 students nearest to Walnut Park:
ICDC College (about 1 miles; Huntington Park, CA; Full-time enrollment: 2,621)
United Education Institute-Huntington Park Campus (about 2 miles; Huntington Park, CA; FT enrollment: 5,151)
Marinello Schools of Beauty-Los Angeles (about 5 miles; Los Angeles, CA; FT enrollment: 3,923)
University of Southern California (about 5 miles; Los Angeles, CA; FT enrollment: 33,161)
Los Angeles Trade Technical College (about 6 miles; Los Angeles, CA; FT enrollment: 7,421)
Los Angeles Southwest College (about 6 miles; Los Angeles, CA; FT enrollment: 3,247)
Fashion Institute of Design & Merchandising-Los Angeles (about 6 miles; Los Angeles, CA; FT enrollment: 3,705)
Public elementary/middle schools in Walnut Park:
ACADEMIA MODERNA(Students: 37, Location: 2410 BRD.WAY, Grades: KG-5, Charter school)
WALNUT PARK MIDDLE B SCI, TECH, ENGR AND MATH ACAD (Location: 7500 MARBRISA AVE., Grades: 6-8)
WALNUT PARK MIDDLE A SCH OF SOC JUST AND SERVICE L (Location: 7500 MARBRISA AVE., Grades: 6-8)
Los Angeles County has a predicted average indoor radon screening level between 2 and 4 pCi/L (pico curies per liter) - Moderate Potential
Average household size:
This place:
4.4 people
California:
2.9 people
Percentage of family households:
This place:
87.5%
Whole state:
68.7%
Percentage of households with unmarried partners:
This place:
7.4%
Whole state:
7.2%
Likely homosexual households (counted as self-reported same-sex unmarried-partner households)
Lesbian couples: 0.3% of all households
Gay men: 0.3% of all households
14 people in other noninstitutional facilities in 2010
15 people in other noninstitutional group quarters in 2000
Banks with branches in Walnut Park (2011 data):
Bank of America, National Association: La Alameda Branch at 2100 E Florence Avenue, branch established on 2008/08/25. Info updated 2009/11/18: Bank assets: $1,451,969.3 mil, Deposits: $1,077,176.8 mil, headquarters in Charlotte, NC, positive income, 5782 total offices, Holding Company: Bank Of America Corporation
Religion statistics for Walnut Park, CA (based on Los Angeles County data)
Religion
Adherents
Congregations
Catholic
3,542,994
275
Evangelical Protestant
814,611
3,249
Other
451,594
1,023
Mainline Protestant
229,056
860
Black Protestant
112,338
290
Orthodox
63,517
76
None
4,604,495
-
Source: Clifford Grammich, Kirk Hadaway, Richard Houseal, Dale E.Jones, Alexei Krindatch, Richie Stanley and Richard H.Taylor. 2012. 2010 U.S.Religion Census: Religious Congregations & Membership Study. Association of Statisticians of American Religious Bodies. Jones, Dale E., et al. 2002. Congregations and Membership in the United States 2000. Nashville, TN: Glenmary Research Center. Graphs represent county-level data
Lat: 33.974222 Lon: -118.228889, Call Sign: WRJD996, Assigned Frequencies: 456.025 MHz, Grant Date: 08/14/2020, Expiration Date: 08/14/2030, Certifier: Jose D Mena, Registrant: Kamstrup Water Metering, LLC, 245 Hembree Park Drive, Ste. 110, Roswell, GA 30076, Phone: (404) 835-6716
Lat: 33.974306 Lon: -118.229000, Call Sign: WRWF471, Assigned Frequencies: 457.775 MHz, Grant Date: 02/15/2023, Expiration Date: 02/15/2033, Certifier: Francesca Pillon, Registrant: Kamstrup Water Metering, LLC, 245 Hembree Park Drive, Ste. 110, Roswell, GA 30076, Phone: (404) 835-6716, Email:
FCC Registered Amateur Radio Licenses:
3
Call Sign: KC6GKF, Grant Date: 10/17/1989, Expiration Date: 10/17/1999, Cancellation Date: 10/18/2001, Registrant: Marisela Figueredo, 3118 Liveoak St, Walnut Park, CA 90255
Call Sign: KC6MMG, Licensee ID: L00246553, Grant Date: 05/30/2000, Expiration Date: 07/17/2010, Cancellation Date: 07/18/2012, Registrant: Amilcar M Giron, 3133 Olive St, Walnut Park, CA 90255
Call Sign: N6BAP, Licensee ID: L01458214, Grant Date: 01/12/2009, Expiration Date: 04/12/2019, Cancellation Date: 04/13/2021, Certifier: Ronald D Barton, Registrant: Ronald D Barton, 2720 Olive St, Walnut Park, CA 90255
Home Mortgage Disclosure Act Aggregated Statistics For Year 2009 (Based on 4 full tracts)
A) FHA, FSA/RHS & VA Home Purchase Loans
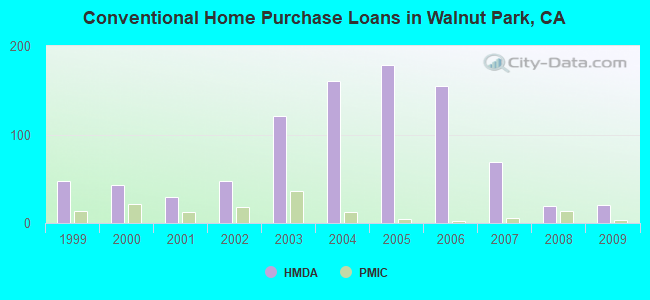
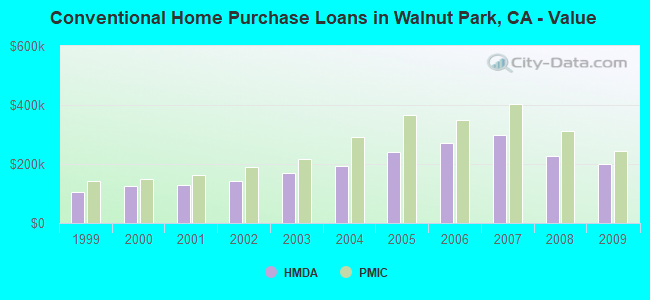
B) Conventional Home Purchase Loans
C) Refinancings
D) Home Improvement Loans
F) Non-occupant Loans on < 5 Family Dwellings (A B C & D)
Number
Average Value
Number
Average Value
Number
Average Value
Number
Average Value
Number
Average Value
LOANS ORIGINATED
32
$251,375
20
$201,450
65
$210,738
2
$260,000
13
$192,692
APPLICATIONS APPROVED, NOT ACCEPTED
6
$271,333
3
$265,000
13
$189,231
1
$9,000
1
$259,000
APPLICATIONS DENIED
8
$268,500
3
$209,333
54
$258,019
6
$53,667
3
$206,333
APPLICATIONS WITHDRAWN
7
$250,714
4
$249,750
31
$235,129
1
$4,000
5
$186,000
FILES CLOSED FOR INCOMPLETENESS
2
$316,500
3
$283,667
10
$279,400
2
$193,500
1
$250,000
Aggregated Statistics For Year 2008 (Based on 4 full tracts)
A) FHA, FSA/RHS & VA Home Purchase Loans
B) Conventional Home Purchase Loans
C) Refinancings
D) Home Improvement Loans
E) Loans on Dwellings For 5+ Families
F) Non-occupant Loans on < 5 Family Dwellings (A B C & D)
Number
Average Value
Number
Average Value
Number
Average Value
Number
Average Value
Number
Average Value
Number
Average Value
LOANS ORIGINATED
7
$312,571
19
$225,947
81
$276,173
16
$182,188
1
$250,000
13
$259,231
APPLICATIONS APPROVED, NOT ACCEPTED
0
$0
3
$204,000
32
$284,125
1
$125,000
0
$0
0
$0
APPLICATIONS DENIED
3
$313,333
9
$359,556
104
$298,692
24
$145,833
2
$335,000
8
$323,000
APPLICATIONS WITHDRAWN
3
$264,667
4
$275,250
26
$278,038
5
$189,200
0
$0
5
$295,600
FILES CLOSED FOR INCOMPLETENESS
0
$0
2
$349,000
10
$297,100
1
$50,000
0
$0
1
$375,000
Aggregated Statistics For Year 2007 (Based on 4 full tracts)
B) Conventional Home Purchase Loans
C) Refinancings
D) Home Improvement Loans
E) Loans on Dwellings For 5+ Families
F) Non-occupant Loans on < 5 Family Dwellings (A B C & D)
G) Loans On Manufactured Home Dwelling (A B C & D)
Number
Average Value
Number
Average Value
Number
Average Value
Number
Average Value
Number
Average Value
Number
Average Value
LOANS ORIGINATED
69
$298,739
241
$300,008
53
$234,019
1
$560,000
20
$297,300
0
$0
APPLICATIONS APPROVED, NOT ACCEPTED
30
$278,733
66
$317,303
4
$162,000
0
$0
6
$320,000
1
$73,000
APPLICATIONS DENIED
72
$343,528
190
$336,416
27
$253,222
0
$0
9
$374,667
1
$112,000
APPLICATIONS WITHDRAWN
25
$280,600
81
$307,494
11
$242,455
0
$0
1
$269,000
0
$0
FILES CLOSED FOR INCOMPLETENESS
5
$258,800
26
$342,692
1
$360,000
0
$0
1
$210,000
0
$0
Aggregated Statistics For Year 2006 (Based on 4 full tracts)
B) Conventional Home Purchase Loans
C) Refinancings
D) Home Improvement Loans
E) Loans on Dwellings For 5+ Families
F) Non-occupant Loans on < 5 Family Dwellings (A B C & D)
G) Loans On Manufactured Home Dwelling (A B C & D)
Number
Average Value
Number
Average Value
Number
Average Value
Number
Average Value
Number
Average Value
Number
Average Value
LOANS ORIGINATED
155
$270,832
337
$298,875
71
$206,056
3
$440,667
32
$265,250
0
$0
APPLICATIONS APPROVED, NOT ACCEPTED
26
$284,808
72
$301,375
14
$211,929
0
$0
4
$277,500
0
$0
APPLICATIONS DENIED
105
$295,600
159
$302,050
61
$163,525
0
$0
27
$308,111
0
$0
APPLICATIONS WITHDRAWN
31
$276,097
90
$305,011
14
$207,643
0
$0
6
$358,000
1
$125,000
FILES CLOSED FOR INCOMPLETENESS
8
$249,500
27
$303,444
2
$234,500
0
$0
4
$347,500
1
$490,000
Aggregated Statistics For Year 2005 (Based on 4 full tracts)
A) FHA, FSA/RHS & VA Home Purchase Loans
B) Conventional Home Purchase Loans
C) Refinancings
D) Home Improvement Loans
E) Loans on Dwellings For 5+ Families
F) Non-occupant Loans on < 5 Family Dwellings (A B C & D)
Number
Average Value
Number
Average Value
Number
Average Value
Number
Average Value
Number
Average Value
Number
Average Value
LOANS ORIGINATED
0
$0
179
$241,777
449
$242,412
50
$175,380
2
$432,000
43
$261,977
APPLICATIONS APPROVED, NOT ACCEPTED
0
$0
38
$259,184
80
$231,200
7
$186,857
0
$0
10
$219,700
APPLICATIONS DENIED
1
$339,000
85
$256,506
167
$260,731
45
$99,511
0
$0
19
$318,895
APPLICATIONS WITHDRAWN
0
$0
54
$247,537
132
$238,955
14
$183,000
0
$0
15
$227,467
FILES CLOSED FOR INCOMPLETENESS
0
$0
10
$225,800
44
$254,818
6
$165,333
0
$0
2
$296,500
Aggregated Statistics For Year 2004 (Based on 4 full tracts)
A) FHA, FSA/RHS & VA Home Purchase Loans
B) Conventional Home Purchase Loans
C) Refinancings
D) Home Improvement Loans
E) Loans on Dwellings For 5+ Families
F) Non-occupant Loans on < 5 Family Dwellings (A B C & D)
Number
Average Value
Number
Average Value
Number
Average Value
Number
Average Value
Number
Average Value
Number
Average Value
LOANS ORIGINATED
3
$245,000
161
$194,516
449
$194,392
43
$177,953
1
$200,000
43
$210,860
APPLICATIONS APPROVED, NOT ACCEPTED
0
$0
29
$236,207
93
$195,527
7
$132,429
0
$0
7
$170,286
APPLICATIONS DENIED
0
$0
48
$193,625
201
$220,284
50
$135,140
0
$0
23
$275,913
APPLICATIONS WITHDRAWN
1
$295,000
36
$203,500
128
$198,617
9
$178,889
0
$0
7
$220,571
FILES CLOSED FOR INCOMPLETENESS
0
$0
3
$259,000
39
$197,692
1
$80,000
0
$0
3
$155,333
Aggregated Statistics For Year 2003 (Based on 4 full tracts)
A) FHA, FSA/RHS & VA Home Purchase Loans
B) Conventional Home Purchase Loans
C) Refinancings
D) Home Improvement Loans
E) Loans on Dwellings For 5+ Families
F) Non-occupant Loans on < 5 Family Dwellings (A B C & D)
Number
Average Value
Number
Average Value
Number
Average Value
Number
Average Value
Number
Average Value
Number
Average Value
LOANS ORIGINATED
13
$226,154
121
$168,347
582
$152,885
20
$31,300
4
$541,000
44
$159,227
APPLICATIONS APPROVED, NOT ACCEPTED
0
$0
29
$200,897
109
$161,183
4
$28,250
0
$0
16
$195,312
APPLICATIONS DENIED
4
$296,500
25
$174,880
213
$164,732
18
$35,722
0
$0
19
$132,684
APPLICATIONS WITHDRAWN
4
$216,500
33
$184,273
112
$152,893
3
$33,333
1
$359,000
7
$204,571
FILES CLOSED FOR INCOMPLETENESS
0
$0
8
$170,750
29
$166,241
0
$0
0
$0
4
$149,000
Aggregated Statistics For Year 2002 (Based on 2 full tracts)
A) FHA, FSA/RHS & VA Home Purchase Loans
B) Conventional Home Purchase Loans
C) Refinancings
D) Home Improvement Loans
E) Loans on Dwellings For 5+ Families
F) Non-occupant Loans on < 5 Family Dwellings (A B C & D)
Number
Average Value
Number
Average Value
Number
Average Value
Number
Average Value
Number
Average Value
Number
Average Value
LOANS ORIGINATED
12
$192,917
47
$142,319
145
$144,324
3
$17,333
0
$0
8
$108,500
APPLICATIONS APPROVED, NOT ACCEPTED
0
$0
8
$131,250
41
$133,512
1
$10,000
0
$0
2
$104,500
APPLICATIONS DENIED
1
$187,000
13
$163,231
76
$141,566
8
$35,125
1
$288,000
4
$161,000
APPLICATIONS WITHDRAWN
3
$210,333
3
$140,333
39
$157,590
1
$20,000
0
$0
0
$0
FILES CLOSED FOR INCOMPLETENESS
1
$165,000
0
$0
14
$136,143
0
$0
0
$0
0
$0
Aggregated Statistics For Year 2001 (Based on 2 full tracts)
A) FHA, FSA/RHS & VA Home Purchase Loans
B) Conventional Home Purchase Loans
C) Refinancings
D) Home Improvement Loans
F) Non-occupant Loans on < 5 Family Dwellings (A B C & D)
Number
Average Value
Number
Average Value
Number
Average Value
Number
Average Value
Number
Average Value
LOANS ORIGINATED
24
$174,958
29
$128,172
104
$128,163
5
$47,400
10
$138,600
APPLICATIONS APPROVED, NOT ACCEPTED
2
$120,000
7
$92,000
20
$112,300
1
$10,000
4
$80,750
APPLICATIONS DENIED
2
$180,500
14
$128,857
66
$142,030
8
$57,875
5
$178,400
APPLICATIONS WITHDRAWN
2
$166,500
10
$93,700
36
$143,250
7
$35,000
0
$0
FILES CLOSED FOR INCOMPLETENESS
0
$0
1
$198,000
10
$133,600
0
$0
0
$0
Aggregated Statistics For Year 2000 (Based on 2 full tracts)
A) FHA, FSA/RHS & VA Home Purchase Loans
B) Conventional Home Purchase Loans
C) Refinancings
D) Home Improvement Loans
F) Non-occupant Loans on < 5 Family Dwellings (A B C & D)
Number
Average Value
Number
Average Value
Number
Average Value
Number
Average Value
Number
Average Value
LOANS ORIGINATED
34
$163,971
43
$125,744
36
$119,861
6
$18,500
4
$96,750
APPLICATIONS APPROVED, NOT ACCEPTED
2
$194,500
4
$150,750
8
$138,000
2
$16,500
0
$0
APPLICATIONS DENIED
8
$167,875
10
$138,700
39
$114,103
8
$17,500
1
$125,000
APPLICATIONS WITHDRAWN
4
$166,500
4
$113,250
4
$92,500
2
$20,000
0
$0
FILES CLOSED FOR INCOMPLETENESS
3
$146,333
4
$149,250
8
$109,125
1
$24,000
1
$83,000
Aggregated Statistics For Year 1999 (Based on 1 full and 2 partial tracts)
A) FHA, FSA/RHS & VA Home Purchase Loans
B) Conventional Home Purchase Loans
C) Refinancings
D) Home Improvement Loans
E) Loans on Dwellings For 5+ Families
F) Non-occupant Loans on < 5 Family Dwellings (A B C & D)
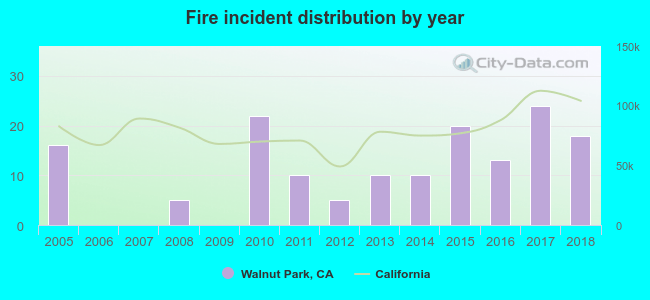
2005 - 2018 National Fire Incident Reporting System (NFIRS) incidents
According to the data from the years 2005 - 2018 the average number of fire incidents per year is 11. The highest number of fire incidents - 24 took place in 2017, and the least - 0 in 2006. The data has a growing trend.
When looking into fire subcategories, the most reports belonged to: Structure Fires (39.9%), and Outside Fires (32.7%).
Fire incident types reported to NFIRS in Walnut Park, CA


 Recent articles from our blog. Our writers, many of them Ph.D. graduates or candidates, create easy-to-read articles on a wide variety of topics.

 (1.0 miles
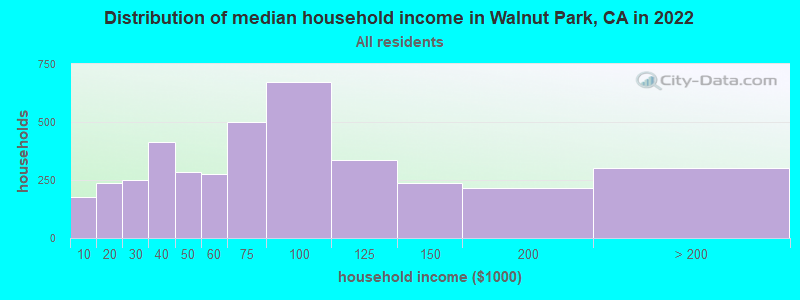


 According to the data from the years 2005 - 2018 the average number of fire incidents per year is 11. The highest number of fire incidents - 24 took place in 2017, and the least - 0 in 2006. The data has a growing trend.
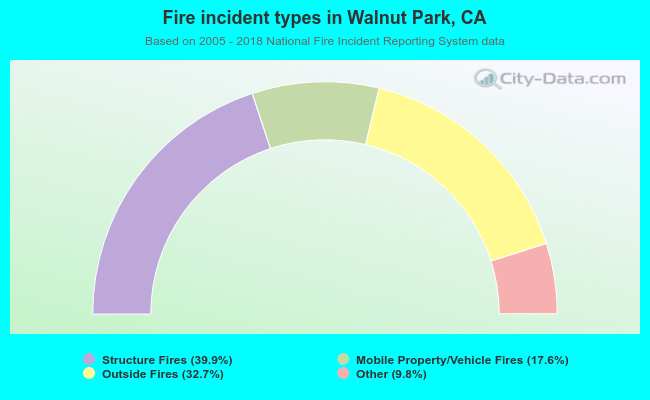 When looking into fire subcategories, the most reports belonged to: Structure Fires (39.9%), and Outside Fires (32.7%).