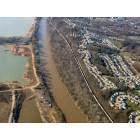
Valley Park, Missouri Submit your own pictures of this city and show them to the world
OSM Map
General Map
Google Map
MSN Map
OSM Map
General Map
Google Map
MSN Map
OSM Map
General Map
Google Map
MSN Map
OSM Map
General Map
Google Map
MSN Map
Please wait while loading the map...
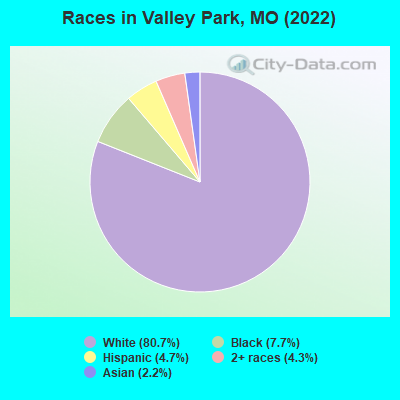
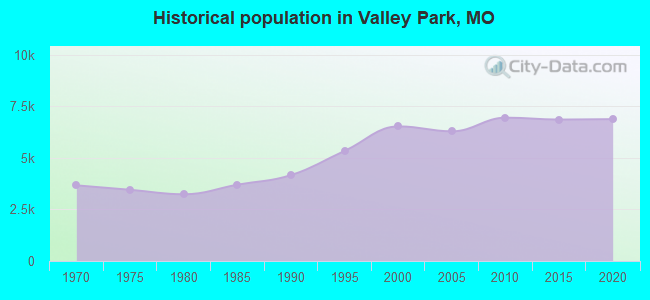
Population in 2022: 6,768 (100% urban, 0% rural). Population change since 2000: +3.8%Males: 3,449 Females: 3,319
March 2022 cost of living index in Valley Park: 97.0 (near average, U.S. average is 100) Percentage of residents living in poverty in 2022: 13.2%for White Non-Hispanic residents , 63.2% for Black residents , 12.1% for two or more races residents )
Profiles of local businesses
Business Search - 14 Million verified businesses
Data:
Median household income ($)
Median household income (% change since 2000)
Household income diversity
Ratio of average income to average house value (%)
Ratio of average income to average rent
Median household income ($) - White
Median household income ($) - Black or African American
Median household income ($) - Asian
Median household income ($) - Hispanic or Latino
Median household income ($) - American Indian and Alaska Native
Median household income ($) - Multirace
Median household income ($) - Other Race
Median household income for houses/condos with a mortgage ($)
Median household income for apartments without a mortgage ($)
Races - White alone (%)
Races - White alone (% change since 2000)
Races - Black alone (%)
Races - Black alone (% change since 2000)
Races - American Indian alone (%)
Races - American Indian alone (% change since 2000)
Races - Asian alone (%)
Races - Asian alone (% change since 2000)
Races - Hispanic (%)
Races - Hispanic (% change since 2000)
Races - Native Hawaiian and Other Pacific Islander alone (%)
Races - Native Hawaiian and Other Pacific Islander alone (% change since 2000)
Races - Two or more races (%)
Races - Two or more races (% change since 2000)
Races - Other race alone (%)
Races - Other race alone (% change since 2000)
Racial diversity
Unemployment (%)
Unemployment (% change since 2000)
Unemployment (%) - White
Unemployment (%) - Black or African American
Unemployment (%) - Asian
Unemployment (%) - Hispanic or Latino
Unemployment (%) - American Indian and Alaska Native
Unemployment (%) - Multirace
Unemployment (%) - Other Race
Population density (people per square mile)
Population - Males (%)
Population - Females (%)
Population - Males (%) - White
Population - Males (%) - Black or African American
Population - Males (%) - Asian
Population - Males (%) - Hispanic or Latino
Population - Males (%) - American Indian and Alaska Native
Population - Males (%) - Multirace
Population - Males (%) - Other Race
Population - Females (%) - White
Population - Females (%) - Black or African American
Population - Females (%) - Asian
Population - Females (%) - Hispanic or Latino
Population - Females (%) - American Indian and Alaska Native
Population - Females (%) - Multirace
Population - Females (%) - Other Race
Coronavirus confirmed cases (May 23, 2024)
Deaths caused by coronavirus (May 23, 2024)
Coronavirus confirmed cases (per 100k population) (May 23, 2024)
Deaths caused by coronavirus (per 100k population) (May 23, 2024)
Daily increase in number of cases (May 23, 2024)
Weekly increase in number of cases (May 23, 2024)
Cases doubled (in days) (May 23, 2024)
Hospitalized patients (Apr 18, 2022)
Negative test results (Apr 18, 2022)
Total test results (Apr 18, 2022)
COVID Vaccine doses distributed (per 100k population) (Sep 19, 2023)
COVID Vaccine doses administered (per 100k population) (Sep 19, 2023)
COVID Vaccine doses distributed (Sep 19, 2023)
COVID Vaccine doses administered (Sep 19, 2023)
Likely homosexual households (%)
Likely homosexual households (% change since 2000)
Likely homosexual households - Lesbian couples (%)
Likely homosexual households - Lesbian couples (% change since 2000)
Likely homosexual households - Gay men (%)
Likely homosexual households - Gay men (% change since 2000)
Cost of living index
Median gross rent ($)
Median contract rent ($)
Median monthly housing costs ($)
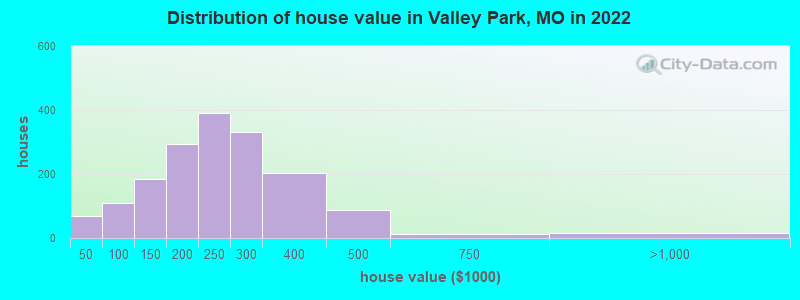
Median house or condo value ($)
Median house or condo value ($ change since 2000)
Mean house or condo value by units in structure - 1, detached ($)
Mean house or condo value by units in structure - 1, attached ($)
Mean house or condo value by units in structure - 2 ($)
Mean house or condo value by units in structure by units in structure - 3 or 4 ($)
Mean house or condo value by units in structure - 5 or more ($)
Mean house or condo value by units in structure - Boat, RV, van, etc. ($)
Mean house or condo value by units in structure - Mobile home ($)
Median house or condo value ($) - White
Median house or condo value ($) - Black or African American
Median house or condo value ($) - Asian
Median house or condo value ($) - Hispanic or Latino
Median house or condo value ($) - American Indian and Alaska Native
Median house or condo value ($) - Multirace
Median house or condo value ($) - Other Race
Median resident age
Resident age diversity
Median resident age - Males
Median resident age - Females
Median resident age - White
Median resident age - Black or African American
Median resident age - Asian
Median resident age - Hispanic or Latino
Median resident age - American Indian and Alaska Native
Median resident age - Multirace
Median resident age - Other Race
Median resident age - Males - White
Median resident age - Males - Black or African American
Median resident age - Males - Asian
Median resident age - Males - Hispanic or Latino
Median resident age - Males - American Indian and Alaska Native
Median resident age - Males - Multirace
Median resident age - Males - Other Race
Median resident age - Females - White
Median resident age - Females - Black or African American
Median resident age - Females - Asian
Median resident age - Females - Hispanic or Latino
Median resident age - Females - American Indian and Alaska Native
Median resident age - Females - Multirace
Median resident age - Females - Other Race
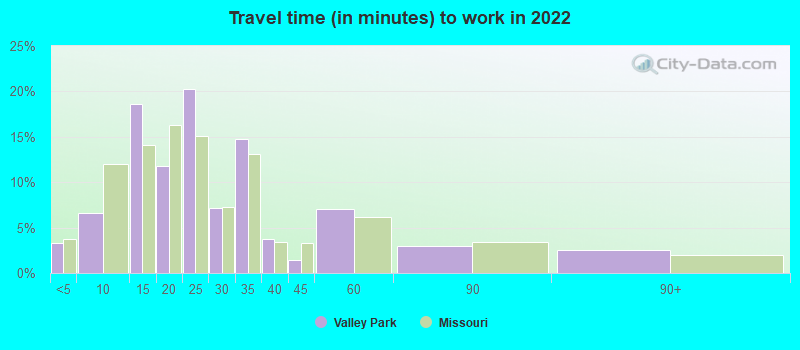
Commute - mean travel time to work (minutes)
Travel time to work - Less than 5 minutes (%)
Travel time to work - Less than 5 minutes (% change since 2000)
Travel time to work - 5 to 9 minutes (%)
Travel time to work - 5 to 9 minutes (% change since 2000)
Travel time to work - 10 to 19 minutes (%)
Travel time to work - 10 to 19 minutes (% change since 2000)
Travel time to work - 20 to 29 minutes (%)
Travel time to work - 20 to 29 minutes (% change since 2000)
Travel time to work - 30 to 39 minutes (%)
Travel time to work - 30 to 39 minutes (% change since 2000)
Travel time to work - 40 to 59 minutes (%)
Travel time to work - 40 to 59 minutes (% change since 2000)
Travel time to work - 60 to 89 minutes (%)
Travel time to work - 60 to 89 minutes (% change since 2000)
Travel time to work - 90 or more minutes (%)
Travel time to work - 90 or more minutes (% change since 2000)
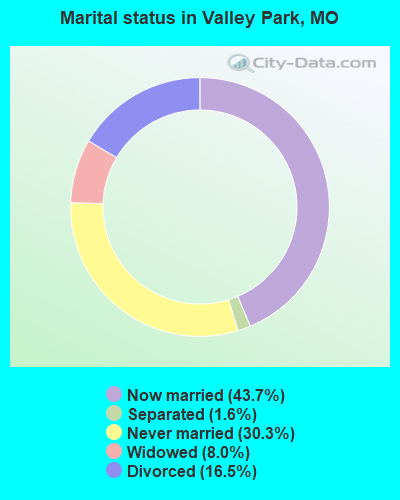
Marital status - Never married (%)
Marital status - Now married (%)
Marital status - Separated (%)
Marital status - Widowed (%)
Marital status - Divorced (%)
Median family income ($)
Median family income (% change since 2000)
Median non-family income ($)
Median non-family income (% change since 2000)
Median per capita income ($)
Median per capita income (% change since 2000)
Median family income ($) - White
Median family income ($) - Black or African American
Median family income ($) - Asian
Median family income ($) - Hispanic or Latino
Median family income ($) - American Indian and Alaska Native
Median family income ($) - Multirace
Median family income ($) - Other Race
Median year house/condo built
Median year apartment built
Year house built - Built 2005 or later (%)
Year house built - Built 2000 to 2004 (%)
Year house built - Built 1990 to 1999 (%)
Year house built - Built 1980 to 1989 (%)
Year house built - Built 1970 to 1979 (%)
Year house built - Built 1960 to 1969 (%)
Year house built - Built 1950 to 1959 (%)
Year house built - Built 1940 to 1949 (%)
Year house built - Built 1939 or earlier (%)
Average household size
Household density (households per square mile)
Average household size - White
Average household size - Black or African American
Average household size - Asian
Average household size - Hispanic or Latino
Average household size - American Indian and Alaska Native
Average household size - Multirace
Average household size - Other Race
Occupied housing units (%)
Vacant housing units (%)
Owner occupied housing units (%)
Renter occupied housing units (%)
Vacancy status - For rent (%)
Vacancy status - For sale only (%)
Vacancy status - Rented or sold, not occupied (%)
Vacancy status - For seasonal, recreational, or occasional use (%)
Vacancy status - For migrant workers (%)
Vacancy status - Other vacant (%)
Residents with income below the poverty level (%)
Residents with income below 50% of the poverty level (%)
Children below poverty level (%)
Poor families by family type - Married-couple family (%)
Poor families by family type - Male, no wife present (%)
Poor families by family type - Female, no husband present (%)
Poverty status for native-born residents (%)
Poverty status for foreign-born residents (%)
Poverty among high school graduates not in families (%)
Poverty among people who did not graduate high school not in families (%)
Residents with income below the poverty level (%) - White
Residents with income below the poverty level (%) - Black or African American
Residents with income below the poverty level (%) - Asian
Residents with income below the poverty level (%) - Hispanic or Latino
Residents with income below the poverty level (%) - American Indian and Alaska Native
Residents with income below the poverty level (%) - Multirace
Residents with income below the poverty level (%) - Other Race
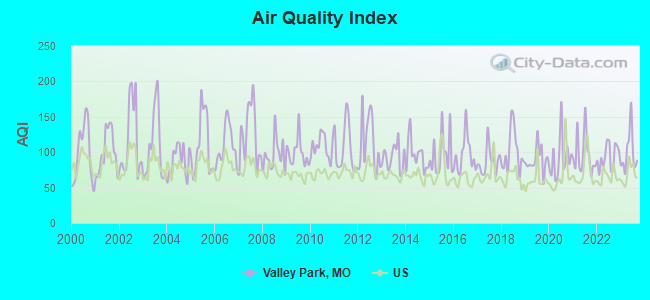
Air pollution - Air Quality Index (AQI)
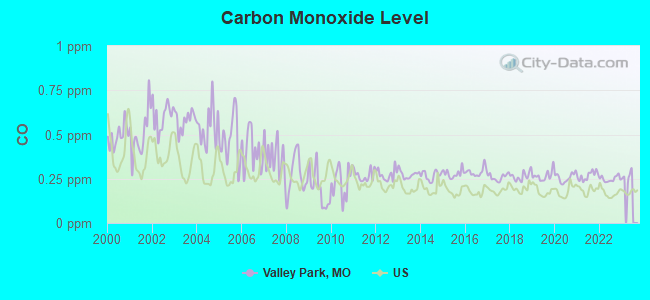
Air pollution - CO
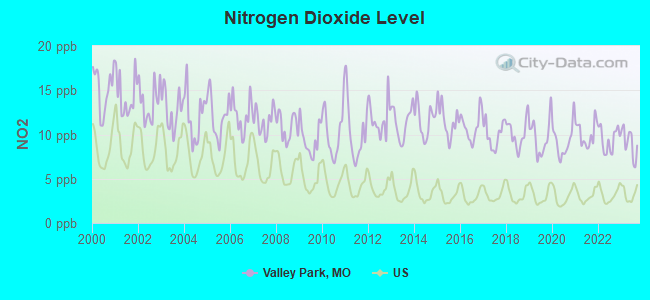
Air pollution - NO2
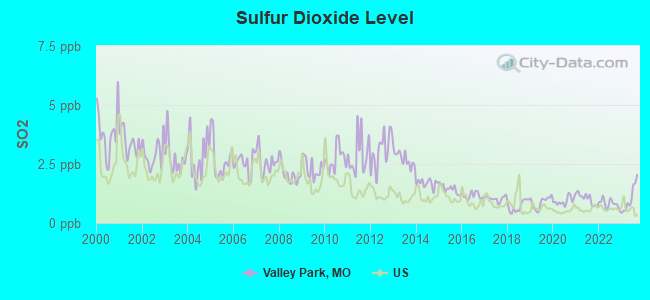
Air pollution - SO2
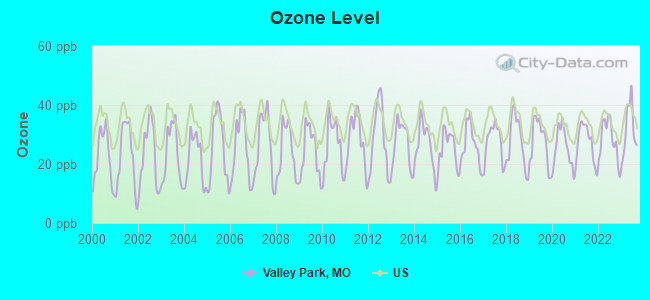
Air pollution - Ozone
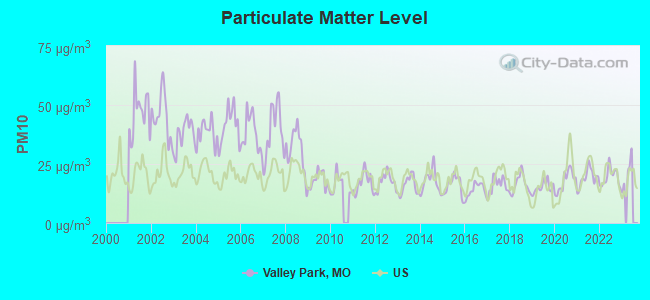
Air pollution - PM10
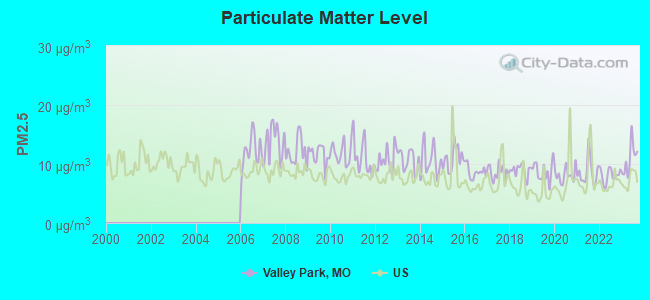
Air pollution - PM25
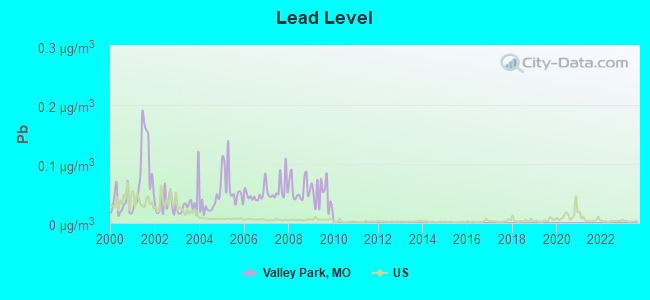
Air pollution - Pb
Crime - Murders per 100,000 population
Crime - Rapes per 100,000 population
Crime - Robberies per 100,000 population
Crime - Assaults per 100,000 population
Crime - Burglaries per 100,000 population
Crime - Thefts per 100,000 population
Crime - Auto thefts per 100,000 population
Crime - Arson per 100,000 population
Crime - City-data.com crime index
Crime - Violent crime index
Crime - Property crime index
Crime - Murders per 100,000 population (5 year average)
Crime - Rapes per 100,000 population (5 year average)
Crime - Robberies per 100,000 population (5 year average)
Crime - Assaults per 100,000 population (5 year average)
Crime - Burglaries per 100,000 population (5 year average)
Crime - Thefts per 100,000 population (5 year average)
Crime - Auto thefts per 100,000 population (5 year average)
Crime - Arson per 100,000 population (5 year average)
Crime - City-data.com crime index (5 year average)
Crime - Violent crime index (5 year average)
Crime - Property crime index (5 year average)
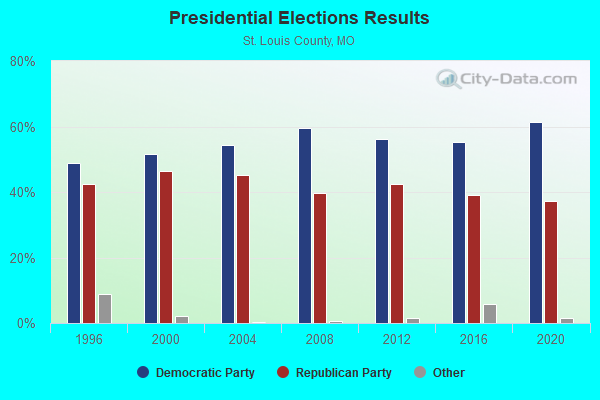
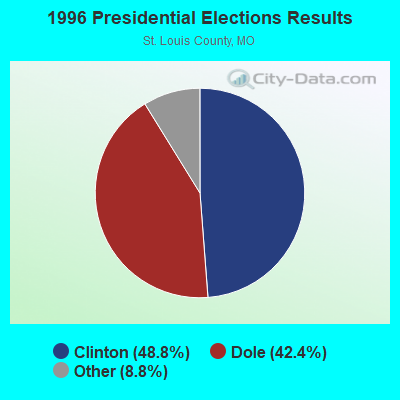
1996 Presidential Elections Results (%) - Democratic Party (Clinton)
1996 Presidential Elections Results (%) - Republican Party (Dole)
1996 Presidential Elections Results (%) - Other
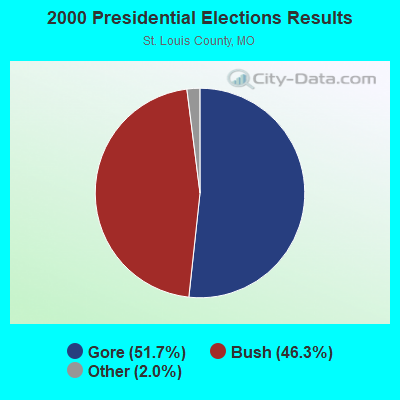
2000 Presidential Elections Results (%) - Democratic Party (Gore)
2000 Presidential Elections Results (%) - Republican Party (Bush)
2000 Presidential Elections Results (%) - Other
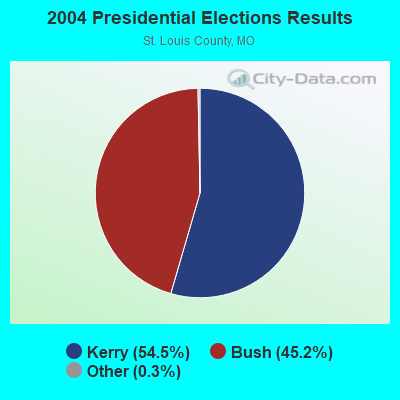
2004 Presidential Elections Results (%) - Democratic Party (Kerry)
2004 Presidential Elections Results (%) - Republican Party (Bush)
2004 Presidential Elections Results (%) - Other
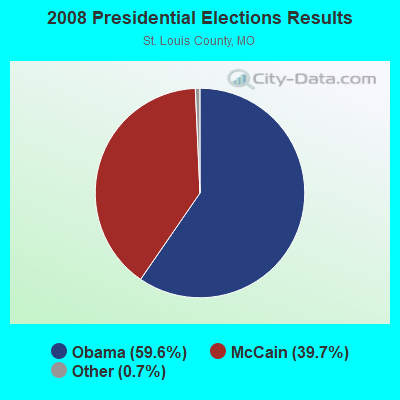
2008 Presidential Elections Results (%) - Democratic Party (Obama)
2008 Presidential Elections Results (%) - Republican Party (McCain)
2008 Presidential Elections Results (%) - Other
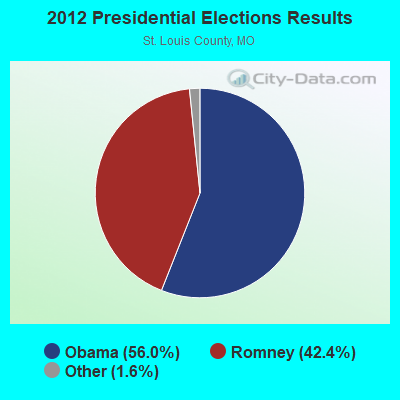
2012 Presidential Elections Results (%) - Democratic Party (Obama)
2012 Presidential Elections Results (%) - Republican Party (Romney)
2012 Presidential Elections Results (%) - Other
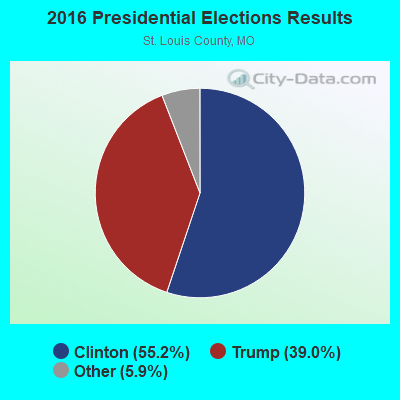
2016 Presidential Elections Results (%) - Democratic Party (Clinton)
2016 Presidential Elections Results (%) - Republican Party (Trump)
2016 Presidential Elections Results (%) - Other
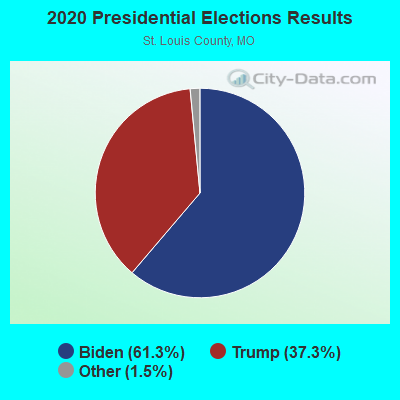
2020 Presidential Elections Results (%) - Democratic Party (Biden)
2020 Presidential Elections Results (%) - Republican Party (Trump)
2020 Presidential Elections Results (%) - Other
Ancestries Reported - Arab (%)
Ancestries Reported - Czech (%)
Ancestries Reported - Danish (%)
Ancestries Reported - Dutch (%)
Ancestries Reported - English (%)
Ancestries Reported - French (%)
Ancestries Reported - French Canadian (%)
Ancestries Reported - German (%)
Ancestries Reported - Greek (%)
Ancestries Reported - Hungarian (%)
Ancestries Reported - Irish (%)
Ancestries Reported - Italian (%)
Ancestries Reported - Lithuanian (%)
Ancestries Reported - Norwegian (%)
Ancestries Reported - Polish (%)
Ancestries Reported - Portuguese (%)
Ancestries Reported - Russian (%)
Ancestries Reported - Scotch-Irish (%)
Ancestries Reported - Scottish (%)
Ancestries Reported - Slovak (%)
Ancestries Reported - Subsaharan African (%)
Ancestries Reported - Swedish (%)
Ancestries Reported - Swiss (%)
Ancestries Reported - Ukrainian (%)
Ancestries Reported - United States (%)
Ancestries Reported - Welsh (%)
Ancestries Reported - West Indian (%)
Ancestries Reported - Other (%)
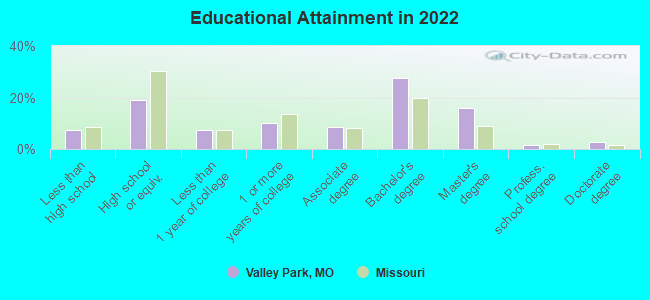
Educational Attainment - No schooling completed (%)
Educational Attainment - Less than high school (%)
Educational Attainment - High school or equivalent (%)
Educational Attainment - Less than 1 year of college (%)
Educational Attainment - 1 or more years of college (%)
Educational Attainment - Associate degree (%)
Educational Attainment - Bachelor's degree (%)
Educational Attainment - Master's degree (%)
Educational Attainment - Professional school degree (%)
Educational Attainment - Doctorate degree (%)
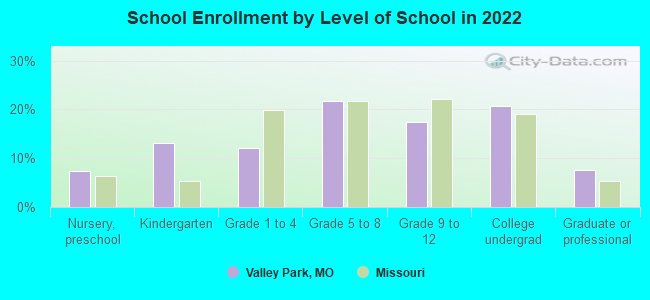
School Enrollment - Nursery, preschool (%)
School Enrollment - Kindergarten (%)
School Enrollment - Grade 1 to 4 (%)
School Enrollment - Grade 5 to 8 (%)
School Enrollment - Grade 9 to 12 (%)
School Enrollment - College undergrad (%)
School Enrollment - Graduate or professional (%)
School Enrollment - Not enrolled in school (%)
School enrollment - Public schools (%)
School enrollment - Private schools (%)
School enrollment - Not enrolled (%)
Median number of rooms in houses and condos
Median number of rooms in apartments
Housing units lacking complete plumbing facilities (%)
Housing units lacking complete kitchen facilities (%)
Density of houses
Urban houses (%)
Rural houses (%)
Households with people 60 years and over (%)
Households with people 65 years and over (%)
Households with people 75 years and over (%)
Households with one or more nonrelatives (%)
Households with no nonrelatives (%)
Population in households (%)
Family households (%)
Nonfamily households (%)
Population in families (%)
Family households with own children (%)
Median number of bedrooms in owner occupied houses
Mean number of bedrooms in owner occupied houses
Median number of bedrooms in renter occupied houses
Mean number of bedrooms in renter occupied houses
Median number of vehichles in owner occupied houses
Mean number of vehichles in owner occupied houses
Median number of vehichles in renter occupied houses
Mean number of vehichles in renter occupied houses
Mortgage status - with mortgage (%)
Mortgage status - with second mortgage (%)
Mortgage status - with home equity loan (%)
Mortgage status - with both second mortgage and home equity loan (%)
Mortgage status - without a mortgage (%)
Average family size
Average family size - White
Average family size - Black or African American
Average family size - Asian
Average family size - Hispanic or Latino
Average family size - American Indian and Alaska Native
Average family size - Multirace
Average family size - Other Race
Geographical mobility - Same house 1 year ago (%)
Geographical mobility - Moved within same county (%)
Geographical mobility - Moved from different county within same state (%)
Geographical mobility - Moved from different state (%)
Geographical mobility - Moved from abroad (%)
Place of birth - Born in state of residence (%)
Place of birth - Born in other state (%)
Place of birth - Native, outside of US (%)
Place of birth - Foreign born (%)
Housing units in structures - 1, detached (%)
Housing units in structures - 1, attached (%)
Housing units in structures - 2 (%)
Housing units in structures - 3 or 4 (%)
Housing units in structures - 5 to 9 (%)
Housing units in structures - 10 to 19 (%)
Housing units in structures - 20 to 49 (%)
Housing units in structures - 50 or more (%)
Housing units in structures - Mobile home (%)
Housing units in structures - Boat, RV, van, etc. (%)
House/condo owner moved in on average (years ago)
Renter moved in on average (years ago)
Year householder moved into unit - Moved in 1999 to March 2000 (%)
Year householder moved into unit - Moved in 1995 to 1998 (%)
Year householder moved into unit - Moved in 1990 to 1994 (%)
Year householder moved into unit - Moved in 1980 to 1989 (%)
Year householder moved into unit - Moved in 1970 to 1979 (%)
Year householder moved into unit - Moved in 1969 or earlier (%)
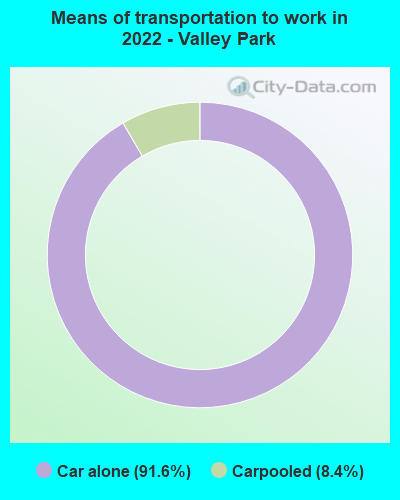
Means of transportation to work - Drove car alone (%)
Means of transportation to work - Carpooled (%)
Means of transportation to work - Public transportation (%)
Means of transportation to work - Bus or trolley bus (%)
Means of transportation to work - Streetcar or trolley car (%)
Means of transportation to work - Subway or elevated (%)
Means of transportation to work - Railroad (%)
Means of transportation to work - Ferryboat (%)
Means of transportation to work - Taxicab (%)
Means of transportation to work - Motorcycle (%)
Means of transportation to work - Bicycle (%)
Means of transportation to work - Walked (%)
Means of transportation to work - Other means (%)
Working at home (%)
Industry diversity
Most Common Industries - Agriculture, forestry, fishing and hunting, and mining (%)
Most Common Industries - Agriculture, forestry, fishing and hunting (%)
Most Common Industries - Mining, quarrying, and oil and gas extraction (%)
Most Common Industries - Construction (%)
Most Common Industries - Manufacturing (%)
Most Common Industries - Wholesale trade (%)
Most Common Industries - Retail trade (%)
Most Common Industries - Transportation and warehousing, and utilities (%)
Most Common Industries - Transportation and warehousing (%)
Most Common Industries - Utilities (%)
Most Common Industries - Information (%)
Most Common Industries - Finance and insurance, and real estate and rental and leasing (%)
Most Common Industries - Finance and insurance (%)
Most Common Industries - Real estate and rental and leasing (%)
Most Common Industries - Professional, scientific, and management, and administrative and waste management services (%)
Most Common Industries - Professional, scientific, and technical services (%)
Most Common Industries - Management of companies and enterprises (%)
Most Common Industries - Administrative and support and waste management services (%)
Most Common Industries - Educational services, and health care and social assistance (%)
Most Common Industries - Educational services (%)
Most Common Industries - Health care and social assistance (%)
Most Common Industries - Arts, entertainment, and recreation, and accommodation and food services (%)
Most Common Industries - Arts, entertainment, and recreation (%)
Most Common Industries - Accommodation and food services (%)
Most Common Industries - Other services, except public administration (%)
Most Common Industries - Public administration (%)
Occupation diversity
Most Common Occupations - Management, business, science, and arts occupations (%)
Most Common Occupations - Management, business, and financial occupations (%)
Most Common Occupations - Management occupations (%)
Most Common Occupations - Business and financial operations occupations (%)
Most Common Occupations - Computer, engineering, and science occupations (%)
Most Common Occupations - Computer and mathematical occupations (%)
Most Common Occupations - Architecture and engineering occupations (%)
Most Common Occupations - Life, physical, and social science occupations (%)
Most Common Occupations - Education, legal, community service, arts, and media occupations (%)
Most Common Occupations - Community and social service occupations (%)
Most Common Occupations - Legal occupations (%)
Most Common Occupations - Education, training, and library occupations (%)
Most Common Occupations - Arts, design, entertainment, sports, and media occupations (%)
Most Common Occupations - Healthcare practitioners and technical occupations (%)
Most Common Occupations - Health diagnosing and treating practitioners and other technical occupations (%)
Most Common Occupations - Health technologists and technicians (%)
Most Common Occupations - Service occupations (%)
Most Common Occupations - Healthcare support occupations (%)
Most Common Occupations - Protective service occupations (%)
Most Common Occupations - Fire fighting and prevention, and other protective service workers including supervisors (%)
Most Common Occupations - Law enforcement workers including supervisors (%)
Most Common Occupations - Food preparation and serving related occupations (%)
Most Common Occupations - Building and grounds cleaning and maintenance occupations (%)
Most Common Occupations - Personal care and service occupations (%)
Most Common Occupations - Sales and office occupations (%)
Most Common Occupations - Sales and related occupations (%)
Most Common Occupations - Office and administrative support occupations (%)
Most Common Occupations - Natural resources, construction, and maintenance occupations (%)
Most Common Occupations - Farming, fishing, and forestry occupations (%)
Most Common Occupations - Construction and extraction occupations (%)
Most Common Occupations - Installation, maintenance, and repair occupations (%)
Most Common Occupations - Production, transportation, and material moving occupations (%)
Most Common Occupations - Production occupations (%)
Most Common Occupations - Transportation occupations (%)
Most Common Occupations - Material moving occupations (%)
People in Group quarters - Institutionalized population (%)
People in Group quarters - Correctional institutions (%)
People in Group quarters - Federal prisons and detention centers (%)
People in Group quarters - Halfway houses (%)
People in Group quarters - Local jails and other confinement facilities (including police lockups) (%)
People in Group quarters - Military disciplinary barracks (%)
People in Group quarters - State prisons (%)
People in Group quarters - Other types of correctional institutions (%)
People in Group quarters - Nursing homes (%)
People in Group quarters - Hospitals/wards, hospices, and schools for the handicapped (%)
People in Group quarters - Hospitals/wards and hospices for chronically ill (%)
People in Group quarters - Hospices or homes for chronically ill (%)
People in Group quarters - Military hospitals or wards for chronically ill (%)
People in Group quarters - Other hospitals or wards for chronically ill (%)
People in Group quarters - Hospitals or wards for drug/alcohol abuse (%)
People in Group quarters - Mental (Psychiatric) hospitals or wards (%)
People in Group quarters - Schools, hospitals, or wards for the mentally retarded (%)
People in Group quarters - Schools, hospitals, or wards for the physically handicapped (%)
People in Group quarters - Institutions for the deaf (%)
People in Group quarters - Institutions for the blind (%)
People in Group quarters - Orthopedic wards and institutions for the physically handicapped (%)
People in Group quarters - Wards in general hospitals for patients who have no usual home elsewhere (%)
People in Group quarters - Wards in military hospitals for patients who have no usual home elsewhere (%)
People in Group quarters - Juvenile institutions (%)
People in Group quarters - Long-term care (%)
People in Group quarters - Homes for abused, dependent, and neglected children (%)
People in Group quarters - Residential treatment centers for emotionally disturbed children (%)
People in Group quarters - Training schools for juvenile delinquents (%)
People in Group quarters - Short-term care, detention or diagnostic centers for delinquent children (%)
People in Group quarters - Type of juvenile institution unknown (%)
People in Group quarters - Noninstitutionalized population (%)
People in Group quarters - College dormitories (includes college quarters off campus) (%)
People in Group quarters - Military quarters (%)
People in Group quarters - On base (%)
People in Group quarters - Barracks, unaccompanied personnel housing (UPH), (Enlisted/Officer), ;and similar group living quarters for military personnel (%)
People in Group quarters - Transient quarters for temporary residents (%)
People in Group quarters - Military ships (%)
People in Group quarters - Group homes (%)
People in Group quarters - Homes or halfway houses for drug/alcohol abuse (%)
People in Group quarters - Homes for the mentally ill (%)
People in Group quarters - Homes for the mentally retarded (%)
People in Group quarters - Homes for the physically handicapped (%)
People in Group quarters - Other group homes (%)
People in Group quarters - Religious group quarters (%)
People in Group quarters - Dormitories (%)
People in Group quarters - Agriculture workers' dormitories on farms (%)
People in Group quarters - Job Corps and vocational training facilities (%)
People in Group quarters - Other workers' dormitories (%)
People in Group quarters - Crews of maritime vessels (%)
People in Group quarters - Other nonhousehold living situations (%)
People in Group quarters - Other noninstitutional group quarters (%)
Residents speaking English at home (%)
Residents speaking English at home - Born in the United States (%)
Residents speaking English at home - Native, born elsewhere (%)
Residents speaking English at home - Foreign born (%)
Residents speaking Spanish at home (%)
Residents speaking Spanish at home - Born in the United States (%)
Residents speaking Spanish at home - Native, born elsewhere (%)
Residents speaking Spanish at home - Foreign born (%)
Residents speaking other language at home (%)
Residents speaking other language at home - Born in the United States (%)
Residents speaking other language at home - Native, born elsewhere (%)
Residents speaking other language at home - Foreign born (%)
Class of Workers - Employee of private company (%)
Class of Workers - Self-employed in own incorporated business (%)
Class of Workers - Private not-for-profit wage and salary workers (%)
Class of Workers - Local government workers (%)
Class of Workers - State government workers (%)
Class of Workers - Federal government workers (%)
Class of Workers - Self-employed workers in own not incorporated business and Unpaid family workers (%)
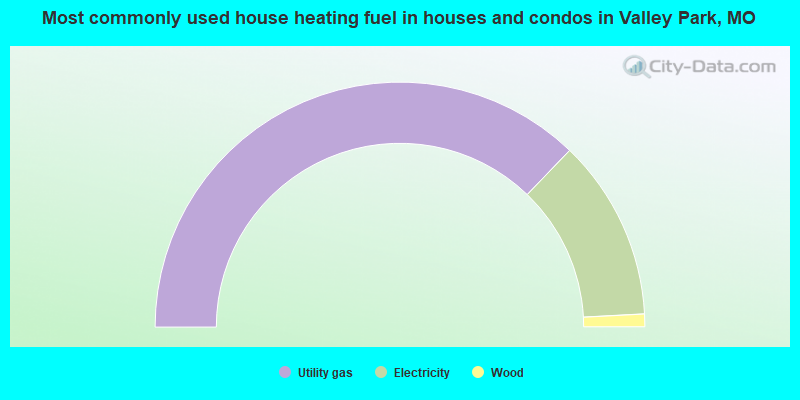
House heating fuel used in houses and condos - Utility gas (%)
House heating fuel used in houses and condos - Bottled, tank, or LP gas (%)
House heating fuel used in houses and condos - Electricity (%)
House heating fuel used in houses and condos - Fuel oil, kerosene, etc. (%)
House heating fuel used in houses and condos - Coal or coke (%)
House heating fuel used in houses and condos - Wood (%)
House heating fuel used in houses and condos - Solar energy (%)
House heating fuel used in houses and condos - Other fuel (%)
House heating fuel used in houses and condos - No fuel used (%)
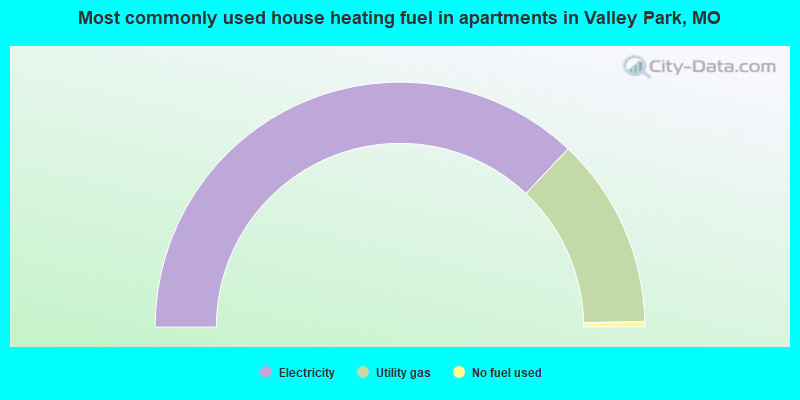
House heating fuel used in apartments - Utility gas (%)
House heating fuel used in apartments - Bottled, tank, or LP gas (%)
House heating fuel used in apartments - Electricity (%)
House heating fuel used in apartments - Fuel oil, kerosene, etc. (%)
House heating fuel used in apartments - Coal or coke (%)
House heating fuel used in apartments - Wood (%)
House heating fuel used in apartments - Solar energy (%)
House heating fuel used in apartments - Other fuel (%)
House heating fuel used in apartments - No fuel used (%)
Armed forces status - In Armed Forces (%)
Armed forces status - Civilian (%)
Armed forces status - Civilian - Veteran (%)
Armed forces status - Civilian - Nonveteran (%)
Fatal accidents locations in years 2005-2021
Fatal accidents locations in 2005
Fatal accidents locations in 2006
Fatal accidents locations in 2007
Fatal accidents locations in 2008
Fatal accidents locations in 2009
Fatal accidents locations in 2010
Fatal accidents locations in 2011
Fatal accidents locations in 2012
Fatal accidents locations in 2013
Fatal accidents locations in 2014
Fatal accidents locations in 2015
Fatal accidents locations in 2016
Fatal accidents locations in 2017
Fatal accidents locations in 2018
Fatal accidents locations in 2019
Fatal accidents locations in 2020
Fatal accidents locations in 2021
Alcohol use - People drinking some alcohol every month (%)
Alcohol use - People not drinking at all (%)
Alcohol use - Average days/month drinking alcohol
Alcohol use - Average drinks/week
Alcohol use - Average days/year people drink much
Audiometry - Average condition of hearing (%)
Audiometry - People that can hear a whisper from across a quiet room (%)
Audiometry - People that can hear normal voice from across a quiet room (%)
Audiometry - Ears ringing, roaring, buzzing (%)
Audiometry - Had a job exposure to loud noise (%)
Audiometry - Had off-work exposure to loud noise (%)
Blood Pressure & Cholesterol - Has high blood pressure (%)
Blood Pressure & Cholesterol - Checking blood pressure at home (%)
Blood Pressure & Cholesterol - Frequently checking blood cholesterol (%)
Blood Pressure & Cholesterol - Has high cholesterol level (%)
Consumer Behavior - Money monthly spent on food at supermarket/grocery store
Consumer Behavior - Money monthly spent on food at other stores
Consumer Behavior - Money monthly spent on eating out
Consumer Behavior - Money monthly spent on carryout/delivered foods
Consumer Behavior - Income spent on food at supermarket/grocery store (%)
Consumer Behavior - Income spent on food at other stores (%)
Consumer Behavior - Income spent on eating out (%)
Consumer Behavior - Income spent on carryout/delivered foods (%)
Current Health Status - General health condition (%)
Current Health Status - Blood donors (%)
Current Health Status - Has blood ever tested for HIV virus (%)
Current Health Status - Left-handed people (%)
Dermatology - People using sunscreen (%)
Diabetes - Diabetics (%)
Diabetes - Had a blood test for high blood sugar (%)
Diabetes - People taking insulin (%)
Diet Behavior & Nutrition - Diet health (%)
Diet Behavior & Nutrition - Milk product consumption (# of products/month)
Diet Behavior & Nutrition - Meals not home prepared (#/week)
Diet Behavior & Nutrition - Meals from fast food or pizza place (#/week)
Diet Behavior & Nutrition - Ready-to-eat foods (#/month)
Diet Behavior & Nutrition - Frozen meals/pizza (#/month)
Drug Use - People that ever used marijuana or hashish (%)
Drug Use - Ever used hard drugs (%)
Drug Use - Ever used any form of cocaine (%)
Drug Use - Ever used heroin (%)
Drug Use - Ever used methamphetamine (%)
Health Insurance - People covered by health insurance (%)
Kidney Conditions-Urology - Avg. # of times urinating at night
Medical Conditions - People with asthma (%)
Medical Conditions - People with anemia (%)
Medical Conditions - People with psoriasis (%)
Medical Conditions - People with overweight (%)
Medical Conditions - Elderly people having difficulties in thinking or remembering (%)
Medical Conditions - People who ever received blood transfusion (%)
Medical Conditions - People having trouble seeing even with glass/contacts (%)
Medical Conditions - People with arthritis (%)
Medical Conditions - People with gout (%)
Medical Conditions - People with congestive heart failure (%)
Medical Conditions - People with coronary heart disease (%)
Medical Conditions - People with angina pectoris (%)
Medical Conditions - People who ever had heart attack (%)
Medical Conditions - People who ever had stroke (%)
Medical Conditions - People with emphysema (%)
Medical Conditions - People with thyroid problem (%)
Medical Conditions - People with chronic bronchitis (%)
Medical Conditions - People with any liver condition (%)
Medical Conditions - People who ever had cancer or malignancy (%)
Mental Health - People who have little interest in doing things (%)
Mental Health - People feeling down, depressed, or hopeless (%)
Mental Health - People who have trouble sleeping or sleeping too much (%)
Mental Health - People feeling tired or having little energy (%)
Mental Health - People with poor appetite or overeating (%)
Mental Health - People feeling bad about themself (%)
Mental Health - People who have trouble concentrating on things (%)
Mental Health - People moving or speaking slowly or too fast (%)
Mental Health - People having thoughts they would be better off dead (%)
Oral Health - Average years since last visit a dentist
Oral Health - People embarrassed because of mouth (%)
Oral Health - People with gum disease (%)
Oral Health - General health of teeth and gums (%)
Oral Health - Average days a week using dental floss/device
Oral Health - Average days a week using mouthwash for dental problem
Oral Health - Average number of teeth
Pesticide Use - Households using pesticides to control insects (%)
Pesticide Use - Households using pesticides to kill weeds (%)
Physical Activity - People doing vigorous-intensity work activities (%)
Physical Activity - People doing moderate-intensity work activities (%)
Physical Activity - People walking or bicycling (%)
Physical Activity - People doing vigorous-intensity recreational activities (%)
Physical Activity - People doing moderate-intensity recreational activities (%)
Physical Activity - Average hours a day doing sedentary activities
Physical Activity - Average hours a day watching TV or videos
Physical Activity - Average hours a day using computer
Physical Functioning - People having limitations keeping them from working (%)
Physical Functioning - People limited in amount of work they can do (%)
Physical Functioning - People that need special equipment to walk (%)
Physical Functioning - People experiencing confusion/memory problems (%)
Physical Functioning - People requiring special healthcare equipment (%)
Prescription Medications - Average number of prescription medicines taking
Preventive Aspirin Use - Adults 40+ taking low-dose aspirin (%)
Reproductive Health - Vaginal deliveries (%)
Reproductive Health - Cesarean deliveries (%)
Reproductive Health - Deliveries resulted in a live birth (%)
Reproductive Health - Pregnancies resulted in a delivery (%)
Reproductive Health - Women breastfeeding newborns (%)
Reproductive Health - Women that had a hysterectomy (%)
Reproductive Health - Women that had both ovaries removed (%)
Reproductive Health - Women that have ever taken birth control pills (%)
Reproductive Health - Women taking birth control pills (%)
Reproductive Health - Women that have ever used Depo-Provera or injectables (%)
Reproductive Health - Women that have ever used female hormones (%)
Sexual Behavior - People 18+ that ever had sex (vaginal, anal, or oral) (%)
Sexual Behavior - Males 18+ that ever had vaginal sex with a woman (%)
Sexual Behavior - Males 18+ that ever performed oral sex on a woman (%)
Sexual Behavior - Males 18+ that ever had anal sex with a woman (%)
Sexual Behavior - Males 18+ that ever had any sex with a man (%)
Sexual Behavior - Females 18+ that ever had vaginal sex with a man (%)
Sexual Behavior - Females 18+ that ever performed oral sex on a man (%)
Sexual Behavior - Females 18+ that ever had anal sex with a man (%)
Sexual Behavior - Females 18+ that ever had any kind of sex with a woman (%)
Sexual Behavior - Average age people first had sex
Sexual Behavior - Average number of female sex partners in lifetime (males 18+)
Sexual Behavior - Average number of female vaginal sex partners in lifetime (males 18+)
Sexual Behavior - Average age people first performed oral sex on a woman (18+)
Sexual Behavior - Average number of woman performed oral sex on in lifetime (18+)
Sexual Behavior - Average number of male sex partners in lifetime (males 18+)
Sexual Behavior - Average number of male anal sex partners in lifetime (males 18+)
Sexual Behavior - Average age people first performed oral sex on a man (18+)
Sexual Behavior - Average number of male oral sex partners in lifetime (18+)
Sexual Behavior - People using protection when performing oral sex (%)
Sexual Behavior - Average number of times people have vaginal or anal sex a year
Sexual Behavior - People having sex without condom (%)
Sexual Behavior - Average number of male sex partners in lifetime (females 18+)
Sexual Behavior - Average number of male vaginal sex partners in lifetime (females 18+)
Sexual Behavior - Average number of female sex partners in lifetime (females 18+)
Sexual Behavior - Circumcised males 18+ (%)
Sleep Disorders - Average hours sleeping at night
Sleep Disorders - People that has trouble sleeping (%)
Smoking-Cigarette Use - People smoking cigarettes (%)
Taste & Smell - People 40+ having problems with smell (%)
Taste & Smell - People 40+ having problems with taste (%)
Taste & Smell - People 40+ that ever had wisdom teeth removed (%)
Taste & Smell - People 40+ that ever had tonsils teeth removed (%)
Taste & Smell - People 40+ that ever had a loss of consciousness because of a head injury (%)
Taste & Smell - People 40+ that ever had a broken nose or other serious injury to face or skull (%)
Taste & Smell - People 40+ that ever had two or more sinus infections (%)
Weight - Average height (inches)
Weight - Average weight (pounds)
Weight - Average BMI
Weight - People that are obese (%)
Weight - People that ever were obese (%)
Weight - People trying to lose weight (%)
According to our research of Missouri and other state lists, there were 9 registered sex offenders living in Valley Park, Missouri as of May 23, 2024 . The ratio of all residents to sex offenders in Valley Park is 771 to 1.The ratio of registered sex offenders to all residents in this city is lower than the state average.
Latest news from Valley Park, MO collected exclusively by city-data.com from local newspapers, TV, and radio stations
Valley Park, MO City Guides: Ancestries: German (24.5%), American (10.6%), English (7.4%), Irish (6.0%), Syrian (2.4%), Eastern European (2.3%).
Current Local Time:
Land area: 3.02 square miles.
Population density: 2,239 people per square mile (low).
504 residents are foreign born (3.1% Latin America , 2.9% Asia , 0.9% Africa ).
This city:
7.4%Missouri:
4.2%
Median real estate property taxes paid for housing units with mortgages in 2022: $2,955 (1.3%)Median real estate property taxes paid for housing units with no mortgage in 2022: $2,851 (1.3%)
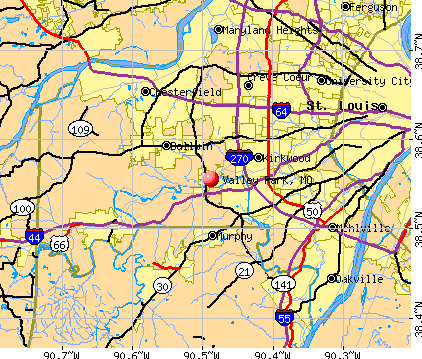
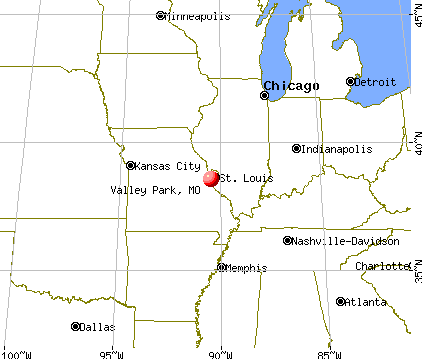
Nearest city with pop. 50,000+: St. Louis, MO
Nearest city with pop. 1,000,000+: Chicago, IL
Nearest cities:
Latitude: 38.56 N, Longitude: 90.49 W
Daytime population change due to commuting: -121 (-1.8%)Workers who live and work in this city: 721 (20.8%)
Property values in Valley Park, MO
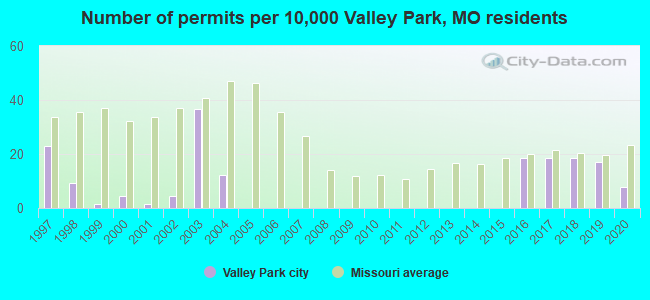
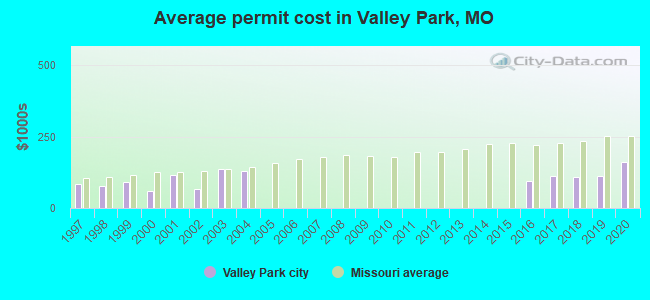
Single-family new house construction building permits:
2020: 5 buildings , average cost: $160,6002019: 11 buildings , average cost: $111,3002018: 12 buildings , average cost: $110,2002017: 12 buildings , average cost: $113,1002016: 12 buildings , average cost: $95,8002004: 8 buildings , average cost: $129,0002003: 24 buildings , average cost: $137,9002002: 3 buildings , average cost: $66,7002001: 1 building , cost: $115,0002000: 3 buildings , average cost: $58,3001999: 1 building , cost: $92,0001998: 6 buildings , average cost: $77,9001997: 15 buildings , average cost: $83,800Unemployment in December 2023:
Population change in the 1990s: +2,284 (+53.9%).
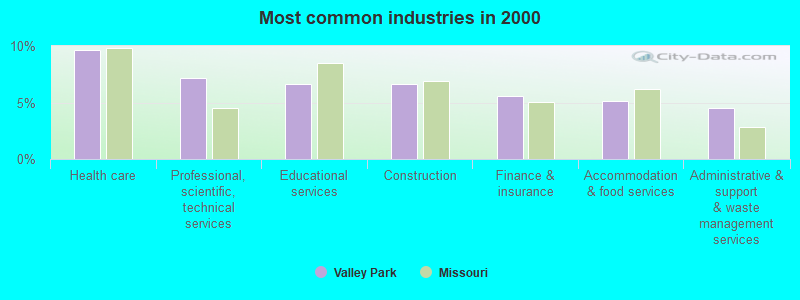
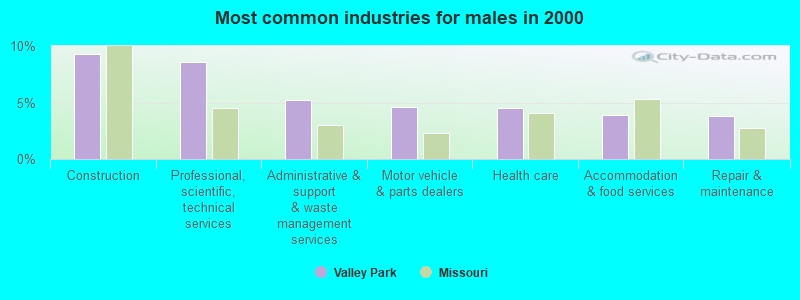
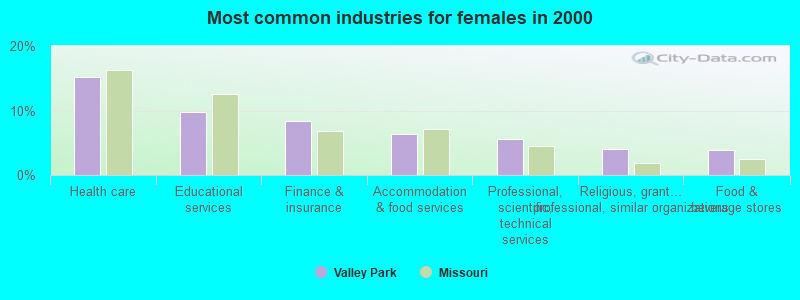
Most common industries in Valley Park, MO (%)
Both Males Females
Health care (9.7%)
Professional, scientific, technical services (7.2%)
Educational services (6.7%)
Construction (6.6%)
Finance & insurance (5.5%)
Accommodation & food services (5.1%)
Administrative & support & waste management services (4.5%)
Construction (9.3%)
Professional, scientific, technical services (8.6%)
Administrative & support & waste management services (5.2%)
Motor vehicle & parts dealers (4.6%)
Health care (4.5%)
Accommodation & food services (3.9%)
Repair & maintenance (3.8%)
Health care (15.2%)
Educational services (9.8%)
Finance & insurance (8.3%)
Accommodation & food services (6.4%)
Professional, scientific, technical services (5.7%)
Religious, grantmaking, civic, professional, similar organizations (4.0%)
Food & beverage stores (3.9%)
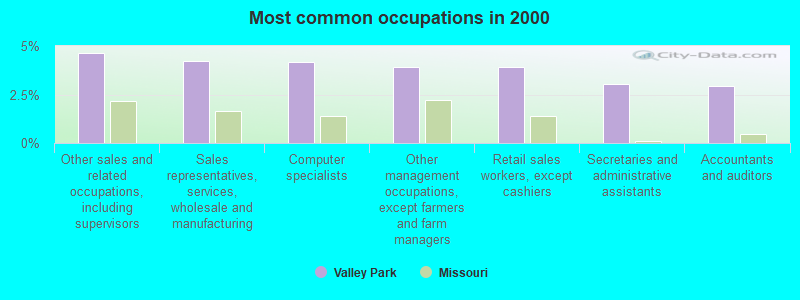
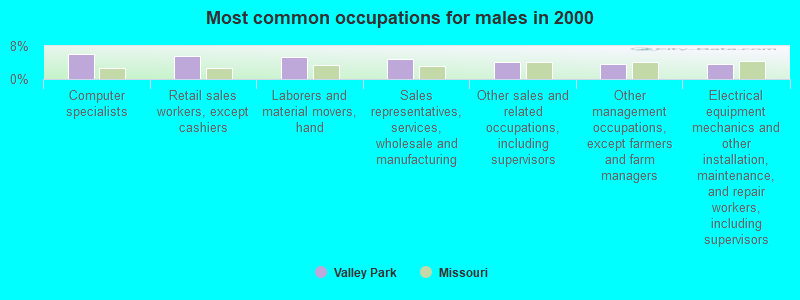
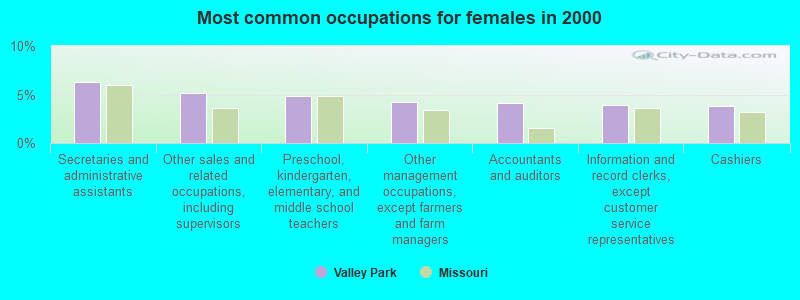
Most common occupations in Valley Park, MO (%)
Both Males Females
Other sales and related occupations, including supervisors (4.7%)
Sales representatives, services, wholesale and manufacturing (4.2%)
Computer specialists (4.2%)
Other management occupations, except farmers and farm managers (3.9%)
Retail sales workers, except cashiers (3.9%)
Secretaries and administrative assistants (3.0%)
Accountants and auditors (2.9%)
Computer specialists (6.1%)
Retail sales workers, except cashiers (5.6%)
Laborers and material movers, hand (5.3%)
Sales representatives, services, wholesale and manufacturing (4.9%)
Other sales and related occupations, including supervisors (4.2%)
Other management occupations, except farmers and farm managers (3.7%)
Electrical equipment mechanics and other installation, maintenance, and repair workers, including supervisors (3.5%)
Secretaries and administrative assistants (6.2%)
Other sales and related occupations, including supervisors (5.2%)
Preschool, kindergarten, elementary, and middle school teachers (4.8%)
Other management occupations, except farmers and farm managers (4.2%)
Accountants and auditors (4.1%)
Information and record clerks, except customer service representatives (4.0%)
Cashiers (3.8%)
Tornado activity:
Valley Park-area historical tornado activity is near Missouri state average. It is 73% greater than the overall U.S. average.
On 2/10/1959, a category F4 (max. wind speeds 207-260 mph) tornado 6.3 miles away from the Valley Park city center killed 21 people and injured 345 people and caused between $5,000,000 and $50,000,000 in damages.
On 1/24/1967, a category F4 tornado 9.2 miles away from the city center killed 3 people and injured 216 people and caused between $5,000,000 and $50,000,000 in damages.
Earthquake activity:
Valley Park-area historical earthquake activity is significantly above Missouri state average. It is 330% greater than the overall U.S. average. On 4/18/2008 at 09:36:59, a magnitude 5.4 (5.1 MB, 4.8 MS, 5.4 MW, 5.2 MW, Class: Moderate, Intensity: VI - VII) earthquake occurred 141.0 miles away from the city center On 4/18/2008 at 09:36:59, a magnitude 5.2 (5.2 MW, Depth: 8.9 mi) earthquake occurred 141.0 miles away from Valley Park center On 9/26/1990 at 13:18:51, a magnitude 5.0 (4.7 MB, 4.8 LG, 5.0 LG, Depth: 7.7 mi) earthquake occurred 109.2 miles away from the city center On 6/10/1987 at 23:48:54, a magnitude 5.1 (4.9 MB, 4.4 MS, 4.6 MS, 5.1 LG) earthquake occurred 141.7 miles away from the city center On 5/4/1991 at 01:18:54, a magnitude 5.0 (4.4 MB, 4.6 LG, 5.0 LG, Depth: 3.1 mi) earthquake occurred 142.5 miles away from Valley Park center On 6/18/2002 at 17:37:15, a magnitude 5.0 (4.3 MB, 4.6 MW, 5.0 LG) earthquake occurred 152.2 miles away from the city center Magnitude types: regional Lg-wave magnitude (LG), body-wave magnitude (MB), surface-wave magnitude (MS), moment magnitude (MW) Natural disasters: The number of natural disasters in St. Louis County (2) is a lot smaller than the US average (15).Flood: 1, Storm: 1, Tornado: 1, Wind: 1, Other: 1 (Note: some incidents may be assigned to more than one category). Hospitals and medical centers in Valley Park: BIG BEND WOODS HEALTHCARE CENTER (110 HIGHLAND AVENUE)
GARDEN VIEW CARE CENTER AT DOUGHERTY FERRY (13612 BIG BEND ROAD)
Other hospitals and medical centers near Valley Park: ALTERNATIVE HOSPICE (Hospital, about 2 miles away; FENTON, MO)
FENTON DIALYSIS CENTER (Dialysis Facility, about 3 miles away; FENTON, MO)
SSM ST CLARE HEALTH CENTER (about 3 miles away; FENTON, MO)
BOWLES AVENUE DIALYSIS (Dialysis Facility, about 3 miles away; FENTON, MO)
DES PERES HOSPITAL (about 3 miles away; SAINT LOUIS, MO)
ST LOUIS RENAL CARE - DES PERES (Dialysis Facility, about 3 miles away; SAINT LOUIS, MO)
PATIENT CARE PROFESSIONALS (Home Health Center, about 4 miles away; BALLWIN, MO)
Amtrak stations near Valley Park: 5 miles: KIRKWOOD (110 W. ARGONNE RD.) Services: ticket office, partially wheelchair accessible, enclosed waiting area, public restrooms, public payphones, free short-term parking, free long-term parking, taxi stand, intercity bus service, public transit connection.
17 miles: ST. LOUIS (550 S. 16TH ST.) Services: ticket office, partially wheelchair accessible, enclosed waiting area, public restrooms, public payphones, vending machines, free short-term parking, free long-term parking, call for car rental service, taxi stand.
Colleges/universities with over 2000 students nearest to Valley Park:
Missouri Baptist University (about 7 miles; Saint Louis, MO ; Full-time enrollment: 2,898)
Maryville University of Saint Louis (about 7 miles; Saint Louis, MO ; FT enrollment: 3,651)
Webster University (about 9 miles; Saint Louis, MO ; FT enrollment: 12,406)
Washington University in St Louis (about 12 miles; Saint Louis, MO ; FT enrollment: 10,823)
University of Missouri-St Louis (about 15 miles; Saint Louis, MO ; FT enrollment: 10,322)
Ranken Technical College (about 15 miles; Saint Louis, MO ; FT enrollment: 2,134)
Saint Louis University (about 15 miles; Saint Louis, MO ; FT enrollment: 11,606)
Public high school in Valley Park:
Public elementary/middle schools in Valley Park:
Private elementary/middle school in Valley Park: SACRED HEART ELEMENTARY SCHOOL Students: 319, Location: 12 ANN AVE, Grades: KG-8)
See full list of schools located in Valley Park Library in Valley Park: VALLEY PARK COMMUNITY LIBRARY Operating income: $78,925; Location: 320 BENTON STREET; 12,945 books ; 676 audio materials ; 1,305 video materials ; 14 state licensed databases ; 45 print serial subscriptions ; 11 electronic serial subscriptions )
St. Louis County has a predicted average indoor radon screening level between 2 and 4 pCi/L (pico curies per liter) - Moderate Potential Drinking water stations with addresses in Valley Park and their reported violations in the past:
WORLD BIRD SANCTUARY (Population served: 25, Groundwater):
Past monitoring violations:
2 routine major monitoring violations
One minor monitoring violation
Average household size: This city:
2.3 peopleMissouri:
2.5 people
Percentage of family households: This city:
55.1%Whole state:
65.3%
Percentage of households with unmarried partners: This city:
7.6%Whole state:
6.7%
Likely homosexual households (counted as self-reported same-sex unmarried-partner households)
Lesbian couples: 0.2% of all households Gay men: 0.2% of all households
202 people in nursing facilities/skilled-nursing facilities in 2010people in nursing homes in 2000
Banks with branches in Valley Park (2011 data):
PNC Bank, National Association: Big Bend Branch at 840 Meramec Station Road, branch established on 1914/01/01; Cape Albeon Branch at 3380 Lake Bend Drive, branch established on 2001/01/08. Info updated 2012/03/20: Bank assets: $263,309.6 mil, Deposits: $197,343.0 mil, headquarters in Wilmington, DE, positive income , Commercial Lending Specialization, 3085 total offices , Holding Company: Pnc Financial Services Group, Inc., The
Fifth Third Bank: Valley Park Branch at 2981 Dougherty Ferry, branch established on 2007/01/09. Info updated 2009/10/05: Bank assets: $114,540.4 mil, Deposits: $89,689.1 mil, headquarters in Cincinnati, OH, positive income , Commercial Lending Specialization, 1378 total offices , Holding Company: Fifth Third Bancorp
Meramec Valley Bank: at 35 Marshall Road, branch established on 1918/01/01. Info updated 2006/11/03: Bank assets: $97.5 mil, Deposits: $80.7 mil, local headquarters , negative income in the last year , Commercial Lending Specialization, 2 total offices , Holding Company: Valley Bancshares, Inc.
Commerce Bank: Twin Oaks Banking Center Branch at 858 Meramec Station Rd, branch established on 2006/03/01. Info updated 2011/07/07: Bank assets: $20,493.6 mil, Deposits: $16,805.3 mil, headquarters in Kansas City, MO, positive income , 206 total offices , Holding Company: Commerce Bancshares, Inc.
For population 15 years and over in Valley Park:
Never married: 30.3%Now married: 43.7%Separated: 1.6%Widowed: 8.0%Divorced: 16.5% For population 25 years and over in Valley Park:
High school or higher: 92.5%Bachelor's degree or higher: 45.6%Graduate or professional degree: 19.4%Unemployed: 5.7%Mean travel time to work (commute): 17.9 minutes
Education Gini index (Inequality in education) Here:
10.7Missouri average:
11.1
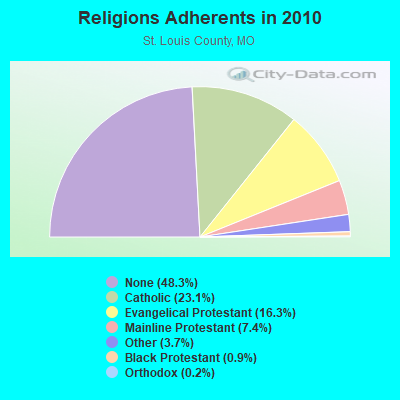
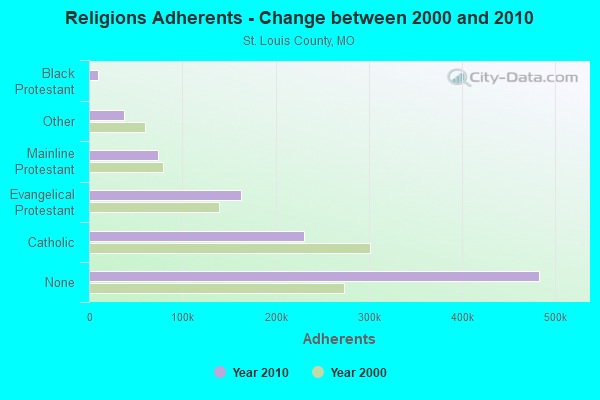
Religion statistics for Valley Park, MO (based on St. Louis County data)
Religion Adherents Congregations Catholic 230,488 74 Evangelical Protestant 162,614 384 Mainline Protestant 74,404 130 Other 37,156 87 Black Protestant 9,369 48 Orthodox 2,042 7 None 482,881 -
Source: Clifford Grammich, Kirk Hadaway, Richard Houseal, Dale E.Jones, Alexei Krindatch, Richie Stanley and Richard H.Taylor. 2012. 2010 U.S.Religion Census: Religious Congregations & Membership Study. Association of Statisticians of American Religious Bodies. Jones, Dale E., et al. 2002. Congregations and Membership in the United States 2000. Nashville, TN: Glenmary Research Center. Graphs represent county-level data
Food Environment Statistics: Number of grocery stores : 176St. Louis County :
1.77 / 10,000 pop.State :
1.88 / 10,000 pop.
Number of supercenters and club stores : 9St. Louis County :
0.09 / 10,000 pop.Missouri :
0.18 / 10,000 pop.
Number of convenience stores (no gas) : 50Here :
0.50 / 10,000 pop.Missouri :
0.60 / 10,000 pop.
Number of convenience stores (with gas) : 293St. Louis County :
2.95 / 10,000 pop.Missouri :
4.34 / 10,000 pop.
Number of full-service restaurants : 683St. Louis County :
6.87 / 10,000 pop.Missouri :
7.37 / 10,000 pop.
Adult diabetes rate : St. Louis County :
8.6%Missouri :
8.8%
Low-income preschool obesity rate : This county :
11.9%Missouri :
13.5%
Health and Nutrition: Healthy diet rate : Valley Park:
50.2%Missouri:
50.9%
Average overall health of teeth and gums : Valley Park:
46.6%State:
48.6%
Average BMI : This city:
28.4Missouri:
28.7
People feeling badly about themselves : Valley Park:
20.1%Missouri:
20.6%
People not drinking alcohol at all : Valley Park:
11.9%Missouri:
10.1%
Average hours sleeping at night : General health condition : Valley Park:
58.3%Missouri:
57.5%
Average condition of hearing : This city:
80.9%Missouri:
79.3%
More about Health and Nutrition of Valley Park, MO Residents
Local government employment and payroll (March 2022)
Function
Full-time employees
Monthly full-time payroll
Average yearly full-time wage
Part-time employees
Monthly part-time payroll
Streets and Highways
11 $38,431 $41,925 0 $0 Solid Waste Management
4 $19,765 $59,295 0 $0 Parks and Recreation
0 $0 3 $3,584
Totals for Government
15 $58,196 $46,557 3 $3,584
Valley Park government finances - Expenditure in 2021 (per resident):
Current Operations - Police Protection: $1,511,000 ($223.26)
Housing and Community Development: $1,168,000 ($172.58)Regular Highways: $886,000 ($130.91)Financial Administration: $850,000 ($125.59)Solid Waste Management: $517,000 ($76.39)Parks and Recreation: $280,000 ($41.37)Judicial and Legal Services: $78,000 ($11.52)General Public Buildings: $28,000 ($4.14)Sewerage: $26,000 ($3.84)Central Staff Services: $10,000 ($1.48)General - Other: $3,000 ($0.44)General - Interest on Debt: $431,000 ($63.68)
Valley Park government finances - Revenue in 2021 (per resident):
Charges - Solid Waste Management: $432,000 ($63.83)
Other: $7,000 ($1.03)Miscellaneous - Fines and Forfeits: $123,000 ($18.17)
General Revenue - Other: $40,000 ($5.91)Interest Earnings: $29,000 ($4.28)State Intergovernmental - Other: $535,000 ($79.05)
Highways: $401,000 ($59.25)Tax - General Sales and Gross Receipts: $3,315,000 ($489.80)
Property: $1,267,000 ($187.20)Occupation and Business License - Other: $865,000 ($127.81)Other License: $355,000 ($52.45)Motor Vehicle License: $36,000 ($5.32)Alcoholic Beverage License: $15,000 ($2.22)
Valley Park government finances - Debt in 2021 (per resident):
Long Term Debt - Beginning Outstanding - Unspecified Public Purpose: $6,729,000 ($994.24)
Retired Unspecified Public Purpose: $4,674,000 ($690.60)Outstanding Unspecified Public Purpose: $2,055,000 ($303.63)
Valley Park government finances - Cash and Securities in 2021 (per resident):
Other Funds - Cash and Securities: $2,437,000 ($360.08)
Sinking Funds - Cash and Securities: $1,660,000 ($245.27)
5.97% of this county's 2021 resident taxpayers lived in other counties in 2020 ($70,859 average adjusted gross income )
Here:
5.97%Missouri average:
7.67%
0.01% of residents moved from foreign countries ($97 average AGI )St. Louis County:
0.01%Missouri average:
0.02%
Top counties from which taxpayers relocated into this county between 2020 and 2021:
6.59% of this county's 2020 resident taxpayers moved to other counties in 2021 ($77,630 average adjusted gross income )
Here:
6.59%Missouri average:
7.51%
0.01% of residents moved to foreign countries ($63 average AGI )St. Louis County:
0.01%Missouri average:
0.01%
Top counties to which taxpayers relocated from this county between 2020 and 2021:
Businesses in Valley Park, MO
Name Count Name Count
AT&T 1 McDonald's 1 Brunswick Bowling & Billiards 1 Papa John's Pizza 1 Circle K 2 Ruby Tuesday 1 Hardee's 2 Starbucks 1 Kincaid 1 Steak 'n Shake 1 Lane Furniture 1 Taco Bell 1
Strongest AM radio stations in Valley Park:
KMOX (1120 AM; 50 kW; ST. LOUIS, MO; Owner: INFINITY BROADCASTING OPERATIONS, INC.)
KXEN (1010 AM; 50 kW; FESTUS-ST. LOUIS, MO; Owner: BDJ RADIO ENTERPRISES, LLC)
KSIV (1320 AM; 5 kW; CLAYTON, MO; Owner: BOTT COMMUNICATIONS, INC.)
KFUO (850 AM; 5 kW; CLAYTON, MO; Owner: LUTHERAN CHURCH-MISSOURI SYNOD)
KTRS (550 AM; 5 kW; ST. LOUIS, MO; Owner: KTRS-AM LICENSE, L.L.C.)
KSLG (1380 AM; 5 kW; ST. LOUIS, MO; Owner: NEW HORIZON 7TH-DAY CHRISTIAN CHURCH, INC.)
WSDZ (1260 AM; 20 kW; BELLEVILLE, IL)
KJSL (630 AM; 5 kW; ST. LOUIS, MO; Owner: WMUZ RADIO, INC.)
WRTH (1430 AM; 5 kW; ST. LOUIS, MO)
KRFT (1190 AM; 10 kW; DE SOTO, MO; Owner: ALL SPORTS RADIO, LLC)
KIRL (1460 AM; 5 kW; ST. CHARLES, MO; Owner: BRONCO BROADCASTING CO., INC.)
KATZ (1600 AM; 5 kW; ST. LOUIS, MO; Owner: CITICASTERS LICENSES, L.P.)
KSTL (690 AM; 1 kW; ST. LOUIS, MO; Owner: WMUZ RADIO, INC.)
Strongest FM radio stations in Valley Park:
WIL-FM (92.3 FM; ST. LOUIS, MO; Owner: BONNEVILLE HOLDING COMPANY)
KSD (93.7 FM; ST. LOUIS, MO; Owner: CITICASTERS LICENSES, L.P.)
KSLZ (107.7 FM; ST. LOUIS, MO; Owner: CITICASTERS LICENSES, L.P.)
KFUO-FM (99.1 FM; CLAYTON, MO; Owner: THE LUTHERAN CHURCH-MISSOURI SYNOD)
KYKY (98.1 FM; ST. LOUIS, MO; Owner: INFINITY RADIO SUBSIDIARY OPERATIONS INC.)
WSSM (106.5 FM; GRANITE CITY, IL; Owner: BONNEVILLE HOLDING COMPANY)
KWMU (90.7 FM; ST. LOUIS, MO; Owner: THE CURATORS OF THE UNIVERSITY OF MISSOURI)
KSHE (94.7 FM; CRESTWOOD, MO; Owner: EMMIS RADIO LICENSE CORPORATION)
KEZK-FM (102.5 FM; ST. LOUIS, MO; Owner: INFINITY RADIO SUBSIDIARY OPERATIONS INC.)
KIHT (96.3 FM; ST. LOUIS, MO; Owner: EMMIS RADIO LICENSE CORPORATION)
KLOU (103.3 FM; ST. LOUIS, MO; Owner: CITICASTERS LICENSES, L.P.)
KDHX (88.1 FM; ST. LOUIS, MO; Owner: DOUBLE HELIX CORPORATION)
KSIV-FM (91.5 FM; ST. LOUIS, MO; Owner: COMMUNITY BROADCASTING, INC.)
KNLH (89.5 FM; CEDAR HILL, MO; Owner: NEW LIFE EVANGELISTIC CENTER, INC.)
KPNT (105.7 FM; ST. GENEVIEVE, MO; Owner: EMMIS RADIO LICENSE CORPORATION)
KYMC (89.7 FM; BALLWIN, MO; Owner: THE YMCA OF GREATER ST. LOUIS)
KMJM-FM (104.9 FM; COLUMBIA, IL; Owner: CITICASTERS LICENSES, L.P.)
KFTK-FM1 (97.1 FM; ST. LOUIS, MO; Owner: EMMIS RADIO LICENSE CORPORATION)
WSIE (88.7 FM; EDWARDSVILLE, IL; Owner: BOARD OF TRUSTEES, S. ILLINOIS UNIV.)
KFTK (97.1 FM; FLORISSANT, MO; Owner: EMMIS RADIO LICENSE CORPORATION)
TV broadcast stations around Valley Park:
KTVI (Channel 2; ST. LOUIS, MO; Owner: KTVI LICENSE, INC.)
KETC (Channel 9; ST. LOUIS, MO; Owner: ST. LOUIS REGIONAL & EDUCATIONAL PUBLIC TV COMMISSION)
KSDK (Channel 5; ST. LOUIS, MO; Owner: MULTIMEDIA KSDK, INC.)
KPLR-TV (Channel 11; ST. LOUIS, MO; Owner: KPLR, INC.)
KDNL-TV (Channel 30; ST. LOUIS, MO; Owner: KDNL LICENSEE, LLC)
KMOV (Channel 4; ST. LOUIS, MO; Owner: KMOV-TV, INC.)
KPTN-LP (Channel 58; ST. LOUIS, MO; Owner: KURT J. PETERSEN)
WRBU (Channel 46; EAST ST. LOUIS, IL; Owner: ROBERTS BROADCASTING COMPANY)
K18BT (Channel 18; ST. LOUIS, MO; Owner: TRINITY BROADCASTING NETWORK)
KNLC (Channel 24; ST. LOUIS, MO; Owner: NEW LIFE EVANGELISTIC CENTER, INC.)
K65FN (Channel 65; BATESVILLE, AR; Owner: MS COMMUNICATIONS, LLC)
K62EG (Channel 62; ST. LOUIS, MO; Owner: ETERNAL FAMILY NETWORK)
K40FF (Channel 40; ST. LOUIS, MO; Owner: EBC ST. LOUIS, INC.)
K63FW (Channel 63; JAMESTOWN, MO; Owner: ROGER E. HARDERS)
K49FC (Channel 49; ST. LOUIS, MO; Owner: THREE ANGELS BROADCASTING NETWORK)
K64DT (Channel 64; ST. LOUIS, MO; Owner: WORD OF GOD FELLOWSHIP, INC.)
K59GP (Channel 59; ST. CHARLES, MO; Owner: TRINITY BROADCASTING NETWORK)
K38HD (Channel 38; ST. LOUIS, MO; Owner: VENTANA TELEVISION, INC.)
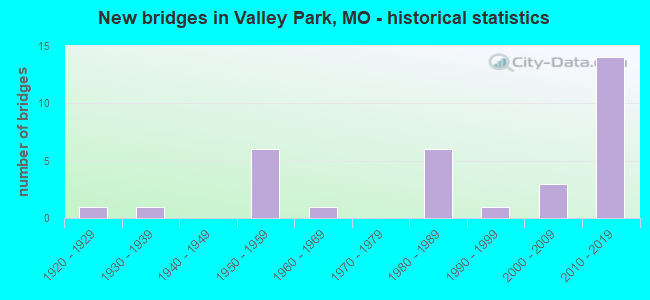
National Bridge Inventory (NBI) Statistics 33 Number of bridges433ft / 132m Total length $5,282,000 Total costs778,933 Total average daily traffic70,446 Total average daily truck traffic
New bridges - historical statistics
1 1920-1929 1 1930-1939 6 1950-1959 1 1960-1969 6 1980-1989 1 1990-1999 3 2000-2009 14 2010-2019
See full National Bridge Inventory statistics for Valley Park, MO
FCC Registered Antenna Towers: 16 (
See the full list of FCC Registered Antenna Towers in Valley Park )
FCC Registered Broadcast Land Mobile Towers: 12 (
See the full list of FCC Registered Broadcast Land Mobile Towers in Valley Park, MO )
FCC Registered Microwave Towers: 2
Valley Park, Adj To Burlington Northern Rr 1.0 Mi E Of (Lat: 38.559750 Lon: -90.479278), Type: Mast, Structure height: 22.9 m, Overall height: 29 m, Call Sign: WQW73, Assigned Frequencies: 2145.20 MHz, 2137.20 MHz, Grant Date: 04/13/2000, Expiration Date: 07/11/2010, Cancellation Date: 06/08/2009, Registrant: Bnsf Railway Co., 4515 Kansas Ave, Kansas City, KS 66106, Phone: (913) 551-4640, Fax: (913) 551-4053, Email:
MO-STL195C, 310 Vance Rd (Lat: 38.550500 Lon: -90.507250), Type: Tower, Structure height: 45.7 m, Call Sign: WQLL712, Assigned Frequencies: 11225.0 MHz, 23025.0 MHz, 11345.0 MHz, 23125.0 MHz, Grant Date: 03/03/2010, Expiration Date: 03/03/2020, Cancellation Date: 02/19/2019, Certifier: Nadja S Sodos-Wallace, Registrant: Sprint Corporation, 12502 Sunrise Valley Drive, M/S: Varesa, Reston, VA 20196, Phone: (800) 572-8256, Fax: (703) 433-4483, Email:
FCC Registered Amateur Radio Licenses: 23 (
See the full list of FCC Registered Amateur Radio Licenses in Valley Park )
FAA Registered Aircraft: 1
Aircraft: CESSNA 172M (Category: Land, Seats: 4, Weight: Up to 12,499 Pounds, Speed: 108 mph), Engine: LYCOMING 0-320 SERIES (180 HP) (4 Cycle)N-Number: 80307, N80307, N-80307, Serial Number: 17266511, Year manufactured: 1975, Airworthiness Date: 01/23/1976, Certificate Issue Date: 09/17/2009Registrant (LLC): Chart & Compass Aviation LLC, 785 Eastwind Ct, Valley Park, MO 63088
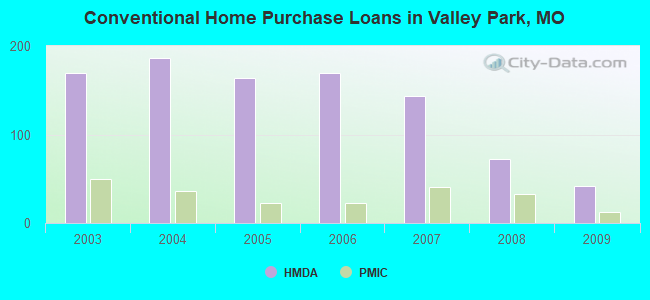
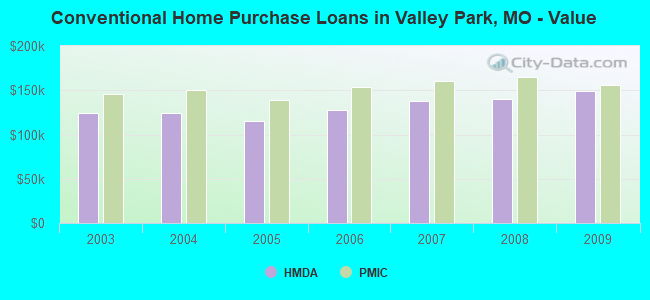
Home Mortgage Disclosure Act Aggregated Statistics For Year 2009(Based on 2 partial tracts) A) FHA, FSA/RHS & VA B) Conventional C) Refinancings D) Home Improvement Loans E) Loans on Dwellings For 5+ Families F) Non-occupant Loans on Number Average Value Number Average Value Number Average Value Number Average Value Number Average Value Number Average Value
LOANS ORIGINATED 44 $152,916 42 $149,140 237 $155,079 5 $102,852 1 $1,629,310 6 $237,603 APPLICATIONS APPROVED, NOT ACCEPTED 1 $151,990 4 $155,630 17 $149,608 1 $3,380 0 $0 2 $127,190 APPLICATIONS DENIED 5 $130,472 3 $192,147 47 $158,677 6 $78,922 0 $0 3 $82,823 APPLICATIONS WITHDRAWN 1 $259,390 3 $158,097 38 $162,634 1 $135,100 0 $0 1 $140,110 FILES CLOSED FOR INCOMPLETENESS 1 $83,190 0 $0 8 $136,524 0 $0 0 $0 0 $0
Aggregated Statistics For Year 2008(Based on 2 partial tracts) A) FHA, FSA/RHS & VA B) Conventional C) Refinancings D) Home Improvement Loans E) Loans on Dwellings For 5+ Families F) Non-occupant Loans on G) Loans On Manufactured Number Average Value Number Average Value Number Average Value Number Average Value Number Average Value Number Average Value Number Average Value
LOANS ORIGINATED 26 $159,895 72 $140,515 131 $145,876 6 $57,990 2 $3,415,330 20 $87,392 0 $0 APPLICATIONS APPROVED, NOT ACCEPTED 1 $123,620 6 $110,873 16 $165,019 1 $25,750 0 $0 2 $116,775 0 $0 APPLICATIONS DENIED 3 $102,790 12 $86,791 59 $147,007 9 $20,592 0 $0 10 $86,501 3 $18,240 APPLICATIONS WITHDRAWN 4 $134,338 9 $433,782 36 $144,655 2 $74,470 0 $0 1 $106,730 0 $0 FILES CLOSED FOR INCOMPLETENESS 2 $104,655 4 $161,118 11 $182,130 1 $179,250 0 $0 1 $60,800 0 $0
Aggregated Statistics For Year 2007(Based on 2 partial tracts) A) FHA, FSA/RHS & VA B) Conventional C) Refinancings D) Home Improvement Loans E) Loans on Dwellings For 5+ Families F) Non-occupant Loans on G) Loans On Manufactured Number Average Value Number Average Value Number Average Value Number Average Value Number Average Value Number Average Value Number Average Value
LOANS ORIGINATED 9 $167,006 143 $137,290 142 $136,371 14 $58,847 1 $565,390 19 $98,242 0 $0 APPLICATIONS APPROVED, NOT ACCEPTED 0 $0 15 $127,069 31 $141,734 2 $29,360 0 $0 1 $128,860 1 $23,640 APPLICATIONS DENIED 0 $0 12 $126,776 89 $138,358 7 $58,371 0 $0 14 $98,955 2 $27,685 APPLICATIONS WITHDRAWN 0 $0 18 $122,864 37 $141,033 3 $80,583 0 $0 3 $140,503 0 $0 FILES CLOSED FOR INCOMPLETENESS 0 $0 3 $121,167 18 $144,463 0 $0 0 $0 0 $0 0 $0
Aggregated Statistics For Year 2006(Based on 2 partial tracts) A) FHA, FSA/RHS & VA B) Conventional C) Refinancings D) Home Improvement Loans E) Loans on Dwellings For 5+ Families F) Non-occupant Loans on G) Loans On Manufactured Number Average Value Number Average Value Number Average Value Number Average Value Number Average Value Number Average Value Number Average Value
LOANS ORIGINATED 3 $182,167 169 $128,062 165 $126,430 16 $55,572 1 $497,170 18 $125,720 0 $0 APPLICATIONS APPROVED, NOT ACCEPTED 0 $0 20 $109,042 23 $126,450 3 $42,990 0 $0 1 $82,380 0 $0 APPLICATIONS DENIED 1 $33,100 26 $102,696 77 $127,517 6 $35,885 0 $0 4 $107,198 2 $77,685 APPLICATIONS WITHDRAWN 1 $146,580 19 $109,358 48 $133,491 7 $85,137 0 $0 7 $106,473 0 $0 FILES CLOSED FOR INCOMPLETENESS 0 $0 4 $171,465 15 $144,299 2 $108,050 0 $0 0 $0 0 $0
Aggregated Statistics For Year 2005(Based on 2 partial tracts) A) FHA, FSA/RHS & VA B) Conventional C) Refinancings D) Home Improvement Loans E) Loans on Dwellings For 5+ Families F) Non-occupant Loans on G) Loans On Manufactured Number Average Value Number Average Value Number Average Value Number Average Value Number Average Value Number Average Value Number Average Value
LOANS ORIGINATED 9 $138,771 164 $114,740 203 $126,717 11 $67,885 1 $222,240 20 $105,357 0 $0 APPLICATIONS APPROVED, NOT ACCEPTED 1 $151,190 12 $99,799 30 $122,764 1 $71,880 0 $0 1 $69,520 0 $0 APPLICATIONS DENIED 0 $0 18 $113,978 93 $121,171 13 $49,774 0 $0 4 $92,305 1 $106,730 APPLICATIONS WITHDRAWN 1 $125,410 24 $119,761 84 $130,946 5 $246,420 0 $0 5 $97,686 1 $99,970 FILES CLOSED FOR INCOMPLETENESS 0 $0 2 $192,195 12 $150,243 1 $42,660 0 $0 0 $0 0 $0
Aggregated Statistics For Year 2004(Based on 2 partial tracts) A) FHA, FSA/RHS & VA B) Conventional C) Refinancings D) Home Improvement Loans E) Loans on Dwellings For 5+ Families F) Non-occupant Loans on G) Loans On Manufactured Number Average Value Number Average Value Number Average Value Number Average Value Number Average Value Number Average Value Number Average Value
LOANS ORIGINATED 14 $145,589 186 $124,762 253 $123,289 14 $55,505 3 $5,168,250 30 $105,419 1 $10,130 APPLICATIONS APPROVED, NOT ACCEPTED 1 $126,990 16 $128,583 41 $115,578 2 $55,880 0 $0 2 $118,675 1 $75,660 APPLICATIONS DENIED 1 $149,960 20 $108,347 74 $207,095 9 $36,148 0 $0 7 $122,604 1 $38,460 APPLICATIONS WITHDRAWN 1 $193,870 11 $167,900 63 $124,898 2 $36,335 0 $0 3 $80,160 0 $0 FILES CLOSED FOR INCOMPLETENESS 1 $99,300 4 $117,368 12 $142,917 2 $67,550 0 $0 0 $0 0 $0
Aggregated Statistics For Year 2003(Based on 2 partial tracts) A) FHA, FSA/RHS & VA B) Conventional C) Refinancings D) Home Improvement Loans E) Loans on Dwellings For 5+ Families F) Non-occupant Loans on Number Average Value Number Average Value Number Average Value Number Average Value Number Average Value Number Average Value
LOANS ORIGINATED 32 $130,324 169 $123,772 606 $114,902 10 $29,554 1 $12,530,530 30 $87,399 APPLICATIONS APPROVED, NOT ACCEPTED 0 $0 12 $120,286 50 $111,827 3 $19,070 0 $0 2 $75,965 APPLICATIONS DENIED 1 $99,390 10 $125,499 76 $120,389 7 $21,849 0 $0 3 $52,683 APPLICATIONS WITHDRAWN 1 $174,280 10 $148,098 76 $131,213 1 $10,130 0 $0 1 $56,740 FILES CLOSED FOR INCOMPLETENESS 0 $0 3 $175,597 17 $115,701 1 $29,050 0 $0 1 $47,280
Detailed HMDA statistics for the following Tracts:
2179.42
, 2181.01
Private Mortgage Insurance Companies Aggregated Statistics For Year 2009(Based on 2 partial tracts) A) Conventional B) Refinancings Number Average Value Number Average Value
LOANS ORIGINATED 12 $156,368 11 $170,694 APPLICATIONS APPROVED, NOT ACCEPTED 2 $139,535 6 $152,145 APPLICATIONS DENIED 2 $114,290 3 $178,310 APPLICATIONS WITHDRAWN 0 $0 0 $0 FILES CLOSED FOR INCOMPLETENESS 0 $0 0 $0
Aggregated Statistics For Year 2008(Based on 2 partial tracts) A) Conventional B) Refinancings C) Non-occupant Loans on Number Average Value Number Average Value Number Average Value
LOANS ORIGINATED 33 $164,556 17 $167,484 2 $102,000 APPLICATIONS APPROVED, NOT ACCEPTED 7 $166,553 7 $176,860 1 $60,800 APPLICATIONS DENIED 0 $0 2 $203,515 0 $0 APPLICATIONS WITHDRAWN 2 $174,995 0 $0 0 $0 FILES CLOSED FOR INCOMPLETENESS 0 $0 0 $0 0 $0
Aggregated Statistics For Year 2007(Based on 2 partial tracts) A) Conventional B) Refinancings C) Non-occupant Loans on Number Average Value Number Average Value Number Average Value
LOANS ORIGINATED 41 $160,472 23 $176,877 1 $132,380 APPLICATIONS APPROVED, NOT ACCEPTED 7 $161,567 2 $194,290 1 $27,700 APPLICATIONS DENIED 1 $65,520 1 $84,440 0 $0 APPLICATIONS WITHDRAWN 1 $228,990 1 $111,920 0 $0 FILES CLOSED FOR INCOMPLETENESS 0 $0 0 $0 0 $0
Aggregated Statistics For Year 2006(Based on 2 partial tracts) A) Conventional B) Refinancings C) Non-occupant Loans on Number Average Value Number Average Value Number Average Value
LOANS ORIGINATED 23 $153,159 12 $183,160 0 $0 APPLICATIONS APPROVED, NOT ACCEPTED 5 $133,454 3 $226,987 1 $151,990 APPLICATIONS DENIED 0 $0 0 $0 0 $0 APPLICATIONS WITHDRAWN 0 $0 0 $0 0 $0 FILES CLOSED FOR INCOMPLETENESS 0 $0 0 $0 0 $0
Aggregated Statistics For Year 2005(Based on 2 partial tracts) A) Conventional B) Refinancings Number Average Value Number Average Value
LOANS ORIGINATED 23 $138,516 19 $152,553 APPLICATIONS APPROVED, NOT ACCEPTED 7 $149,000 6 $157,277 APPLICATIONS DENIED 0 $0 2 $158,775 APPLICATIONS WITHDRAWN 2 $161,315 1 $206,030 FILES CLOSED FOR INCOMPLETENESS 0 $0 0 $0
Aggregated Statistics For Year 2004(Based on 2 partial tracts) A) Conventional B) Refinancings C) Non-occupant Loans on Number Average Value Number Average Value Number Average Value
LOANS ORIGINATED 36 $149,795 23 $143,535 3 $154,013 APPLICATIONS APPROVED, NOT ACCEPTED 3 $168,593 9 $136,769 2 $94,570 APPLICATIONS DENIED 1 $100,420 1 $109,430 0 $0 APPLICATIONS WITHDRAWN 4 $111,198 4 $116,185 0 $0 FILES CLOSED FOR INCOMPLETENESS 0 $0 1 $90,520 0 $0
Aggregated Statistics For Year 2003(Based on 2 partial tracts) A) Conventional B) Refinancings C) Non-occupant Loans on Number Average Value Number Average Value Number Average Value
LOANS ORIGINATED 50 $146,073 72 $139,403 1 $112,930 APPLICATIONS APPROVED, NOT ACCEPTED 5 $167,618 19 $137,665 0 $0 APPLICATIONS DENIED 0 $0 1 $154,690 0 $0 APPLICATIONS WITHDRAWN 3 $107,270 4 $113,662 0 $0 FILES CLOSED FOR INCOMPLETENESS 0 $0 1 $108,040 0 $0
Detailed PMIC statistics for the following Tracts:
2179.42
, 2181.01 Valley Park compared to Missouri state average:
Unemployed percentage below state average. Foreign-born population percentage above state average. Length of stay since moving in significantly above state average. House age below state average. Percentage of population with a bachelor's degree or higher above state average. Valley Park on our top lists :
#72 on the list of "Top 101 cities with largest percentage of females in industries: wholesale trade (population 5,000+)"
#27 on the list of "Top 101 counties with the highest surface withdrawal of fresh water for public supply"
#27 on the list of "Top 101 counties with the most Catholic congregations"
#34 on the list of "Top 101 counties with the most Mainline Protestant adherents"
#36 on the list of "Top 101 counties with the most Evangelical Protestant adherents"
#39 on the list of "Top 101 counties with the highest total withdrawal of fresh water for public supply (pop. 50,000+)"
Top Patent Applicants
Joshua A. Allbright (7)
James L. Young (6)
Chetan O. Modi (6)
Marcos Alfonso Iglesias (3)
David Hertweck (3)
Xiaodong C. Xu (3)
Nancy Gail Limback (3)
Dion L. Bellamy (3)
Michael Pohlman (2)
Stephen C. Nemish (2)
Total of 64 patent applications in 2008-2024.


 Recent articles from our blog. Our writers, many of them Ph.D. graduates or candidates, create easy-to-read articles on a wide variety of topics.

 (14.2 miles
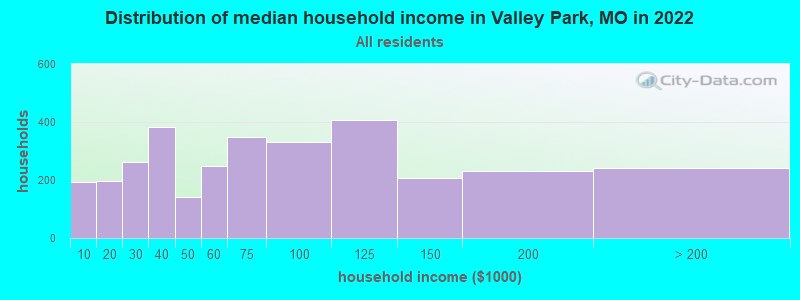


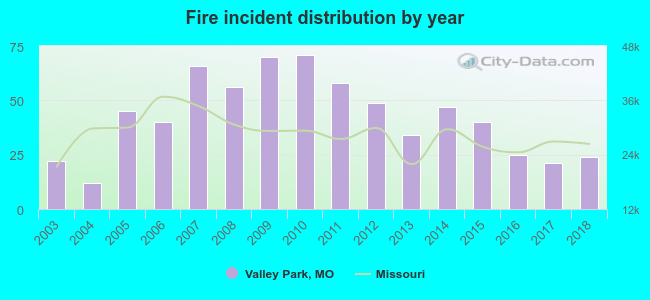 Based on the data from the years 2003 - 2018 the average number of fires per year is 42. The highest number of reported fire incidents - 71 took place in 2010, and the least - 12 in 2004. The data has a rising trend.
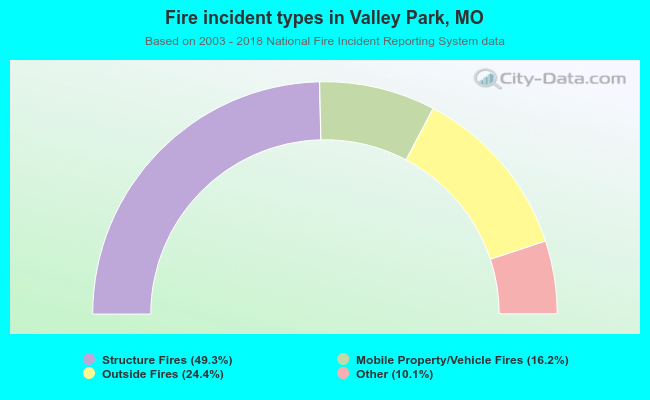 When looking into fire subcategories, the most reports belonged to: Structure Fires (49.3%), and Outside Fires (24.4%).