Temple City, California Submit your own pictures of this city and show them to the world
OSM Map
General Map
Google Map
MSN Map
OSM Map
General Map
Google Map
MSN Map
OSM Map
General Map
Google Map
MSN Map
OSM Map
General Map
Google Map
MSN Map
Please wait while loading the map...
Population in 2022: 35,296 (100% urban, 0% rural). Population change since 2000: +5.7%Males: 16,749 Females: 18,547
March 2022 cost of living index in Temple City: 142.7 (very high, U.S. average is 100) Percentage of residents living in poverty in 2022: 10.1%for White Non-Hispanic residents , 5.1% for Black residents , 16.2% for Hispanic or Latino residents , 11.3% for American Indian residents , 18.0% for other race residents , 12.0% for two or more races residents )
Profiles of local businesses
Business Search - 14 Million verified businesses
Data:
Median household income ($)
Median household income (% change since 2000)
Household income diversity
Ratio of average income to average house value (%)
Ratio of average income to average rent
Median household income ($) - White
Median household income ($) - Black or African American
Median household income ($) - Asian
Median household income ($) - Hispanic or Latino
Median household income ($) - American Indian and Alaska Native
Median household income ($) - Multirace
Median household income ($) - Other Race
Median household income for houses/condos with a mortgage ($)
Median household income for apartments without a mortgage ($)
Races - White alone (%)
Races - White alone (% change since 2000)
Races - Black alone (%)
Races - Black alone (% change since 2000)
Races - American Indian alone (%)
Races - American Indian alone (% change since 2000)
Races - Asian alone (%)
Races - Asian alone (% change since 2000)
Races - Hispanic (%)
Races - Hispanic (% change since 2000)
Races - Native Hawaiian and Other Pacific Islander alone (%)
Races - Native Hawaiian and Other Pacific Islander alone (% change since 2000)
Races - Two or more races (%)
Races - Two or more races (% change since 2000)
Races - Other race alone (%)
Races - Other race alone (% change since 2000)
Racial diversity
Unemployment (%)
Unemployment (% change since 2000)
Unemployment (%) - White
Unemployment (%) - Black or African American
Unemployment (%) - Asian
Unemployment (%) - Hispanic or Latino
Unemployment (%) - American Indian and Alaska Native
Unemployment (%) - Multirace
Unemployment (%) - Other Race
Population density (people per square mile)
Population - Males (%)
Population - Females (%)
Population - Males (%) - White
Population - Males (%) - Black or African American
Population - Males (%) - Asian
Population - Males (%) - Hispanic or Latino
Population - Males (%) - American Indian and Alaska Native
Population - Males (%) - Multirace
Population - Males (%) - Other Race
Population - Females (%) - White
Population - Females (%) - Black or African American
Population - Females (%) - Asian
Population - Females (%) - Hispanic or Latino
Population - Females (%) - American Indian and Alaska Native
Population - Females (%) - Multirace
Population - Females (%) - Other Race
Coronavirus confirmed cases (May 23, 2024)
Deaths caused by coronavirus (May 23, 2024)
Coronavirus confirmed cases (per 100k population) (May 23, 2024)
Deaths caused by coronavirus (per 100k population) (May 23, 2024)
Daily increase in number of cases (May 23, 2024)
Weekly increase in number of cases (May 23, 2024)
Cases doubled (in days) (May 23, 2024)
Hospitalized patients (Apr 18, 2022)
Negative test results (Apr 18, 2022)
Total test results (Apr 18, 2022)
COVID Vaccine doses distributed (per 100k population) (Sep 19, 2023)
COVID Vaccine doses administered (per 100k population) (Sep 19, 2023)
COVID Vaccine doses distributed (Sep 19, 2023)
COVID Vaccine doses administered (Sep 19, 2023)
Likely homosexual households (%)
Likely homosexual households (% change since 2000)
Likely homosexual households - Lesbian couples (%)
Likely homosexual households - Lesbian couples (% change since 2000)
Likely homosexual households - Gay men (%)
Likely homosexual households - Gay men (% change since 2000)
Cost of living index
Median gross rent ($)
Median contract rent ($)
Median monthly housing costs ($)
Median house or condo value ($)
Median house or condo value ($ change since 2000)
Mean house or condo value by units in structure - 1, detached ($)
Mean house or condo value by units in structure - 1, attached ($)
Mean house or condo value by units in structure - 2 ($)
Mean house or condo value by units in structure by units in structure - 3 or 4 ($)
Mean house or condo value by units in structure - 5 or more ($)
Mean house or condo value by units in structure - Boat, RV, van, etc. ($)
Mean house or condo value by units in structure - Mobile home ($)
Median house or condo value ($) - White
Median house or condo value ($) - Black or African American
Median house or condo value ($) - Asian
Median house or condo value ($) - Hispanic or Latino
Median house or condo value ($) - American Indian and Alaska Native
Median house or condo value ($) - Multirace
Median house or condo value ($) - Other Race
Median resident age
Resident age diversity
Median resident age - Males
Median resident age - Females
Median resident age - White
Median resident age - Black or African American
Median resident age - Asian
Median resident age - Hispanic or Latino
Median resident age - American Indian and Alaska Native
Median resident age - Multirace
Median resident age - Other Race
Median resident age - Males - White
Median resident age - Males - Black or African American
Median resident age - Males - Asian
Median resident age - Males - Hispanic or Latino
Median resident age - Males - American Indian and Alaska Native
Median resident age - Males - Multirace
Median resident age - Males - Other Race
Median resident age - Females - White
Median resident age - Females - Black or African American
Median resident age - Females - Asian
Median resident age - Females - Hispanic or Latino
Median resident age - Females - American Indian and Alaska Native
Median resident age - Females - Multirace
Median resident age - Females - Other Race
Commute - mean travel time to work (minutes)
Travel time to work - Less than 5 minutes (%)
Travel time to work - Less than 5 minutes (% change since 2000)
Travel time to work - 5 to 9 minutes (%)
Travel time to work - 5 to 9 minutes (% change since 2000)
Travel time to work - 10 to 19 minutes (%)
Travel time to work - 10 to 19 minutes (% change since 2000)
Travel time to work - 20 to 29 minutes (%)
Travel time to work - 20 to 29 minutes (% change since 2000)
Travel time to work - 30 to 39 minutes (%)
Travel time to work - 30 to 39 minutes (% change since 2000)
Travel time to work - 40 to 59 minutes (%)
Travel time to work - 40 to 59 minutes (% change since 2000)
Travel time to work - 60 to 89 minutes (%)
Travel time to work - 60 to 89 minutes (% change since 2000)
Travel time to work - 90 or more minutes (%)
Travel time to work - 90 or more minutes (% change since 2000)
Marital status - Never married (%)
Marital status - Now married (%)
Marital status - Separated (%)
Marital status - Widowed (%)
Marital status - Divorced (%)
Median family income ($)
Median family income (% change since 2000)
Median non-family income ($)
Median non-family income (% change since 2000)
Median per capita income ($)
Median per capita income (% change since 2000)
Median family income ($) - White
Median family income ($) - Black or African American
Median family income ($) - Asian
Median family income ($) - Hispanic or Latino
Median family income ($) - American Indian and Alaska Native
Median family income ($) - Multirace
Median family income ($) - Other Race
Median year house/condo built
Median year apartment built
Year house built - Built 2005 or later (%)
Year house built - Built 2000 to 2004 (%)
Year house built - Built 1990 to 1999 (%)
Year house built - Built 1980 to 1989 (%)
Year house built - Built 1970 to 1979 (%)
Year house built - Built 1960 to 1969 (%)
Year house built - Built 1950 to 1959 (%)
Year house built - Built 1940 to 1949 (%)
Year house built - Built 1939 or earlier (%)
Average household size
Household density (households per square mile)
Average household size - White
Average household size - Black or African American
Average household size - Asian
Average household size - Hispanic or Latino
Average household size - American Indian and Alaska Native
Average household size - Multirace
Average household size - Other Race
Occupied housing units (%)
Vacant housing units (%)
Owner occupied housing units (%)
Renter occupied housing units (%)
Vacancy status - For rent (%)
Vacancy status - For sale only (%)
Vacancy status - Rented or sold, not occupied (%)
Vacancy status - For seasonal, recreational, or occasional use (%)
Vacancy status - For migrant workers (%)
Vacancy status - Other vacant (%)
Residents with income below the poverty level (%)
Residents with income below 50% of the poverty level (%)
Children below poverty level (%)
Poor families by family type - Married-couple family (%)
Poor families by family type - Male, no wife present (%)
Poor families by family type - Female, no husband present (%)
Poverty status for native-born residents (%)
Poverty status for foreign-born residents (%)
Poverty among high school graduates not in families (%)
Poverty among people who did not graduate high school not in families (%)
Residents with income below the poverty level (%) - White
Residents with income below the poverty level (%) - Black or African American
Residents with income below the poverty level (%) - Asian
Residents with income below the poverty level (%) - Hispanic or Latino
Residents with income below the poverty level (%) - American Indian and Alaska Native
Residents with income below the poverty level (%) - Multirace
Residents with income below the poverty level (%) - Other Race
Air pollution - Air Quality Index (AQI)
Air pollution - CO
Air pollution - NO2
Air pollution - SO2
Air pollution - Ozone
Air pollution - PM10
Air pollution - PM25
Air pollution - Pb
Crime - Murders per 100,000 population
Crime - Rapes per 100,000 population
Crime - Robberies per 100,000 population
Crime - Assaults per 100,000 population
Crime - Burglaries per 100,000 population
Crime - Thefts per 100,000 population
Crime - Auto thefts per 100,000 population
Crime - Arson per 100,000 population
Crime - City-data.com crime index
Crime - Violent crime index
Crime - Property crime index
Crime - Murders per 100,000 population (5 year average)
Crime - Rapes per 100,000 population (5 year average)
Crime - Robberies per 100,000 population (5 year average)
Crime - Assaults per 100,000 population (5 year average)
Crime - Burglaries per 100,000 population (5 year average)
Crime - Thefts per 100,000 population (5 year average)
Crime - Auto thefts per 100,000 population (5 year average)
Crime - Arson per 100,000 population (5 year average)
Crime - City-data.com crime index (5 year average)
Crime - Violent crime index (5 year average)
Crime - Property crime index (5 year average)
1996 Presidential Elections Results (%) - Democratic Party (Clinton)
1996 Presidential Elections Results (%) - Republican Party (Dole)
1996 Presidential Elections Results (%) - Other
2000 Presidential Elections Results (%) - Democratic Party (Gore)
2000 Presidential Elections Results (%) - Republican Party (Bush)
2000 Presidential Elections Results (%) - Other
2004 Presidential Elections Results (%) - Democratic Party (Kerry)
2004 Presidential Elections Results (%) - Republican Party (Bush)
2004 Presidential Elections Results (%) - Other
2008 Presidential Elections Results (%) - Democratic Party (Obama)
2008 Presidential Elections Results (%) - Republican Party (McCain)
2008 Presidential Elections Results (%) - Other
2012 Presidential Elections Results (%) - Democratic Party (Obama)
2012 Presidential Elections Results (%) - Republican Party (Romney)
2012 Presidential Elections Results (%) - Other
2016 Presidential Elections Results (%) - Democratic Party (Clinton)
2016 Presidential Elections Results (%) - Republican Party (Trump)
2016 Presidential Elections Results (%) - Other
2020 Presidential Elections Results (%) - Democratic Party (Biden)
2020 Presidential Elections Results (%) - Republican Party (Trump)
2020 Presidential Elections Results (%) - Other
Ancestries Reported - Arab (%)
Ancestries Reported - Czech (%)
Ancestries Reported - Danish (%)
Ancestries Reported - Dutch (%)
Ancestries Reported - English (%)
Ancestries Reported - French (%)
Ancestries Reported - French Canadian (%)
Ancestries Reported - German (%)
Ancestries Reported - Greek (%)
Ancestries Reported - Hungarian (%)
Ancestries Reported - Irish (%)
Ancestries Reported - Italian (%)
Ancestries Reported - Lithuanian (%)
Ancestries Reported - Norwegian (%)
Ancestries Reported - Polish (%)
Ancestries Reported - Portuguese (%)
Ancestries Reported - Russian (%)
Ancestries Reported - Scotch-Irish (%)
Ancestries Reported - Scottish (%)
Ancestries Reported - Slovak (%)
Ancestries Reported - Subsaharan African (%)
Ancestries Reported - Swedish (%)
Ancestries Reported - Swiss (%)
Ancestries Reported - Ukrainian (%)
Ancestries Reported - United States (%)
Ancestries Reported - Welsh (%)
Ancestries Reported - West Indian (%)
Ancestries Reported - Other (%)
Educational Attainment - No schooling completed (%)
Educational Attainment - Less than high school (%)
Educational Attainment - High school or equivalent (%)
Educational Attainment - Less than 1 year of college (%)
Educational Attainment - 1 or more years of college (%)
Educational Attainment - Associate degree (%)
Educational Attainment - Bachelor's degree (%)
Educational Attainment - Master's degree (%)
Educational Attainment - Professional school degree (%)
Educational Attainment - Doctorate degree (%)
School Enrollment - Nursery, preschool (%)
School Enrollment - Kindergarten (%)
School Enrollment - Grade 1 to 4 (%)
School Enrollment - Grade 5 to 8 (%)
School Enrollment - Grade 9 to 12 (%)
School Enrollment - College undergrad (%)
School Enrollment - Graduate or professional (%)
School Enrollment - Not enrolled in school (%)
School enrollment - Public schools (%)
School enrollment - Private schools (%)
School enrollment - Not enrolled (%)
Median number of rooms in houses and condos
Median number of rooms in apartments
Housing units lacking complete plumbing facilities (%)
Housing units lacking complete kitchen facilities (%)
Density of houses
Urban houses (%)
Rural houses (%)
Households with people 60 years and over (%)
Households with people 65 years and over (%)
Households with people 75 years and over (%)
Households with one or more nonrelatives (%)
Households with no nonrelatives (%)
Population in households (%)
Family households (%)
Nonfamily households (%)
Population in families (%)
Family households with own children (%)
Median number of bedrooms in owner occupied houses
Mean number of bedrooms in owner occupied houses
Median number of bedrooms in renter occupied houses
Mean number of bedrooms in renter occupied houses
Median number of vehichles in owner occupied houses
Mean number of vehichles in owner occupied houses
Median number of vehichles in renter occupied houses
Mean number of vehichles in renter occupied houses
Mortgage status - with mortgage (%)
Mortgage status - with second mortgage (%)
Mortgage status - with home equity loan (%)
Mortgage status - with both second mortgage and home equity loan (%)
Mortgage status - without a mortgage (%)
Average family size
Average family size - White
Average family size - Black or African American
Average family size - Asian
Average family size - Hispanic or Latino
Average family size - American Indian and Alaska Native
Average family size - Multirace
Average family size - Other Race
Geographical mobility - Same house 1 year ago (%)
Geographical mobility - Moved within same county (%)
Geographical mobility - Moved from different county within same state (%)
Geographical mobility - Moved from different state (%)
Geographical mobility - Moved from abroad (%)
Place of birth - Born in state of residence (%)
Place of birth - Born in other state (%)
Place of birth - Native, outside of US (%)
Place of birth - Foreign born (%)
Housing units in structures - 1, detached (%)
Housing units in structures - 1, attached (%)
Housing units in structures - 2 (%)
Housing units in structures - 3 or 4 (%)
Housing units in structures - 5 to 9 (%)
Housing units in structures - 10 to 19 (%)
Housing units in structures - 20 to 49 (%)
Housing units in structures - 50 or more (%)
Housing units in structures - Mobile home (%)
Housing units in structures - Boat, RV, van, etc. (%)
House/condo owner moved in on average (years ago)
Renter moved in on average (years ago)
Year householder moved into unit - Moved in 1999 to March 2000 (%)
Year householder moved into unit - Moved in 1995 to 1998 (%)
Year householder moved into unit - Moved in 1990 to 1994 (%)
Year householder moved into unit - Moved in 1980 to 1989 (%)
Year householder moved into unit - Moved in 1970 to 1979 (%)
Year householder moved into unit - Moved in 1969 or earlier (%)
Means of transportation to work - Drove car alone (%)
Means of transportation to work - Carpooled (%)
Means of transportation to work - Public transportation (%)
Means of transportation to work - Bus or trolley bus (%)
Means of transportation to work - Streetcar or trolley car (%)
Means of transportation to work - Subway or elevated (%)
Means of transportation to work - Railroad (%)
Means of transportation to work - Ferryboat (%)
Means of transportation to work - Taxicab (%)
Means of transportation to work - Motorcycle (%)
Means of transportation to work - Bicycle (%)
Means of transportation to work - Walked (%)
Means of transportation to work - Other means (%)
Working at home (%)
Industry diversity
Most Common Industries - Agriculture, forestry, fishing and hunting, and mining (%)
Most Common Industries - Agriculture, forestry, fishing and hunting (%)
Most Common Industries - Mining, quarrying, and oil and gas extraction (%)
Most Common Industries - Construction (%)
Most Common Industries - Manufacturing (%)
Most Common Industries - Wholesale trade (%)
Most Common Industries - Retail trade (%)
Most Common Industries - Transportation and warehousing, and utilities (%)
Most Common Industries - Transportation and warehousing (%)
Most Common Industries - Utilities (%)
Most Common Industries - Information (%)
Most Common Industries - Finance and insurance, and real estate and rental and leasing (%)
Most Common Industries - Finance and insurance (%)
Most Common Industries - Real estate and rental and leasing (%)
Most Common Industries - Professional, scientific, and management, and administrative and waste management services (%)
Most Common Industries - Professional, scientific, and technical services (%)
Most Common Industries - Management of companies and enterprises (%)
Most Common Industries - Administrative and support and waste management services (%)
Most Common Industries - Educational services, and health care and social assistance (%)
Most Common Industries - Educational services (%)
Most Common Industries - Health care and social assistance (%)
Most Common Industries - Arts, entertainment, and recreation, and accommodation and food services (%)
Most Common Industries - Arts, entertainment, and recreation (%)
Most Common Industries - Accommodation and food services (%)
Most Common Industries - Other services, except public administration (%)
Most Common Industries - Public administration (%)
Occupation diversity
Most Common Occupations - Management, business, science, and arts occupations (%)
Most Common Occupations - Management, business, and financial occupations (%)
Most Common Occupations - Management occupations (%)
Most Common Occupations - Business and financial operations occupations (%)
Most Common Occupations - Computer, engineering, and science occupations (%)
Most Common Occupations - Computer and mathematical occupations (%)
Most Common Occupations - Architecture and engineering occupations (%)
Most Common Occupations - Life, physical, and social science occupations (%)
Most Common Occupations - Education, legal, community service, arts, and media occupations (%)
Most Common Occupations - Community and social service occupations (%)
Most Common Occupations - Legal occupations (%)
Most Common Occupations - Education, training, and library occupations (%)
Most Common Occupations - Arts, design, entertainment, sports, and media occupations (%)
Most Common Occupations - Healthcare practitioners and technical occupations (%)
Most Common Occupations - Health diagnosing and treating practitioners and other technical occupations (%)
Most Common Occupations - Health technologists and technicians (%)
Most Common Occupations - Service occupations (%)
Most Common Occupations - Healthcare support occupations (%)
Most Common Occupations - Protective service occupations (%)
Most Common Occupations - Fire fighting and prevention, and other protective service workers including supervisors (%)
Most Common Occupations - Law enforcement workers including supervisors (%)
Most Common Occupations - Food preparation and serving related occupations (%)
Most Common Occupations - Building and grounds cleaning and maintenance occupations (%)
Most Common Occupations - Personal care and service occupations (%)
Most Common Occupations - Sales and office occupations (%)
Most Common Occupations - Sales and related occupations (%)
Most Common Occupations - Office and administrative support occupations (%)
Most Common Occupations - Natural resources, construction, and maintenance occupations (%)
Most Common Occupations - Farming, fishing, and forestry occupations (%)
Most Common Occupations - Construction and extraction occupations (%)
Most Common Occupations - Installation, maintenance, and repair occupations (%)
Most Common Occupations - Production, transportation, and material moving occupations (%)
Most Common Occupations - Production occupations (%)
Most Common Occupations - Transportation occupations (%)
Most Common Occupations - Material moving occupations (%)
People in Group quarters - Institutionalized population (%)
People in Group quarters - Correctional institutions (%)
People in Group quarters - Federal prisons and detention centers (%)
People in Group quarters - Halfway houses (%)
People in Group quarters - Local jails and other confinement facilities (including police lockups) (%)
People in Group quarters - Military disciplinary barracks (%)
People in Group quarters - State prisons (%)
People in Group quarters - Other types of correctional institutions (%)
People in Group quarters - Nursing homes (%)
People in Group quarters - Hospitals/wards, hospices, and schools for the handicapped (%)
People in Group quarters - Hospitals/wards and hospices for chronically ill (%)
People in Group quarters - Hospices or homes for chronically ill (%)
People in Group quarters - Military hospitals or wards for chronically ill (%)
People in Group quarters - Other hospitals or wards for chronically ill (%)
People in Group quarters - Hospitals or wards for drug/alcohol abuse (%)
People in Group quarters - Mental (Psychiatric) hospitals or wards (%)
People in Group quarters - Schools, hospitals, or wards for the mentally retarded (%)
People in Group quarters - Schools, hospitals, or wards for the physically handicapped (%)
People in Group quarters - Institutions for the deaf (%)
People in Group quarters - Institutions for the blind (%)
People in Group quarters - Orthopedic wards and institutions for the physically handicapped (%)
People in Group quarters - Wards in general hospitals for patients who have no usual home elsewhere (%)
People in Group quarters - Wards in military hospitals for patients who have no usual home elsewhere (%)
People in Group quarters - Juvenile institutions (%)
People in Group quarters - Long-term care (%)
People in Group quarters - Homes for abused, dependent, and neglected children (%)
People in Group quarters - Residential treatment centers for emotionally disturbed children (%)
People in Group quarters - Training schools for juvenile delinquents (%)
People in Group quarters - Short-term care, detention or diagnostic centers for delinquent children (%)
People in Group quarters - Type of juvenile institution unknown (%)
People in Group quarters - Noninstitutionalized population (%)
People in Group quarters - College dormitories (includes college quarters off campus) (%)
People in Group quarters - Military quarters (%)
People in Group quarters - On base (%)
People in Group quarters - Barracks, unaccompanied personnel housing (UPH), (Enlisted/Officer), ;and similar group living quarters for military personnel (%)
People in Group quarters - Transient quarters for temporary residents (%)
People in Group quarters - Military ships (%)
People in Group quarters - Group homes (%)
People in Group quarters - Homes or halfway houses for drug/alcohol abuse (%)
People in Group quarters - Homes for the mentally ill (%)
People in Group quarters - Homes for the mentally retarded (%)
People in Group quarters - Homes for the physically handicapped (%)
People in Group quarters - Other group homes (%)
People in Group quarters - Religious group quarters (%)
People in Group quarters - Dormitories (%)
People in Group quarters - Agriculture workers' dormitories on farms (%)
People in Group quarters - Job Corps and vocational training facilities (%)
People in Group quarters - Other workers' dormitories (%)
People in Group quarters - Crews of maritime vessels (%)
People in Group quarters - Other nonhousehold living situations (%)
People in Group quarters - Other noninstitutional group quarters (%)
Residents speaking English at home (%)
Residents speaking English at home - Born in the United States (%)
Residents speaking English at home - Native, born elsewhere (%)
Residents speaking English at home - Foreign born (%)
Residents speaking Spanish at home (%)
Residents speaking Spanish at home - Born in the United States (%)
Residents speaking Spanish at home - Native, born elsewhere (%)
Residents speaking Spanish at home - Foreign born (%)
Residents speaking other language at home (%)
Residents speaking other language at home - Born in the United States (%)
Residents speaking other language at home - Native, born elsewhere (%)
Residents speaking other language at home - Foreign born (%)
Class of Workers - Employee of private company (%)
Class of Workers - Self-employed in own incorporated business (%)
Class of Workers - Private not-for-profit wage and salary workers (%)
Class of Workers - Local government workers (%)
Class of Workers - State government workers (%)
Class of Workers - Federal government workers (%)
Class of Workers - Self-employed workers in own not incorporated business and Unpaid family workers (%)
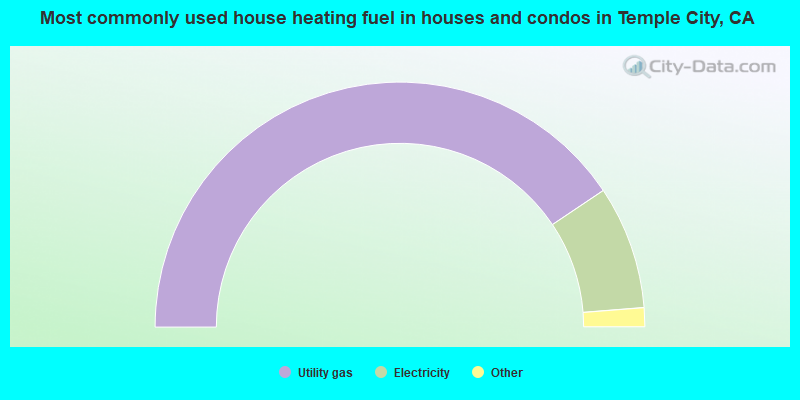
House heating fuel used in houses and condos - Utility gas (%)
House heating fuel used in houses and condos - Bottled, tank, or LP gas (%)
House heating fuel used in houses and condos - Electricity (%)
House heating fuel used in houses and condos - Fuel oil, kerosene, etc. (%)
House heating fuel used in houses and condos - Coal or coke (%)
House heating fuel used in houses and condos - Wood (%)
House heating fuel used in houses and condos - Solar energy (%)
House heating fuel used in houses and condos - Other fuel (%)
House heating fuel used in houses and condos - No fuel used (%)
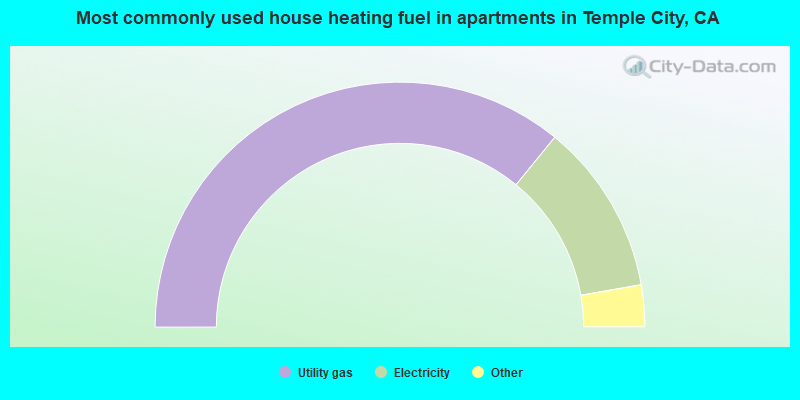
House heating fuel used in apartments - Utility gas (%)
House heating fuel used in apartments - Bottled, tank, or LP gas (%)
House heating fuel used in apartments - Electricity (%)
House heating fuel used in apartments - Fuel oil, kerosene, etc. (%)
House heating fuel used in apartments - Coal or coke (%)
House heating fuel used in apartments - Wood (%)
House heating fuel used in apartments - Solar energy (%)
House heating fuel used in apartments - Other fuel (%)
House heating fuel used in apartments - No fuel used (%)
Armed forces status - In Armed Forces (%)
Armed forces status - Civilian (%)
Armed forces status - Civilian - Veteran (%)
Armed forces status - Civilian - Nonveteran (%)
Fatal accidents locations in years 2005-2021
Fatal accidents locations in 2005
Fatal accidents locations in 2006
Fatal accidents locations in 2007
Fatal accidents locations in 2008
Fatal accidents locations in 2009
Fatal accidents locations in 2010
Fatal accidents locations in 2011
Fatal accidents locations in 2012
Fatal accidents locations in 2013
Fatal accidents locations in 2014
Fatal accidents locations in 2015
Fatal accidents locations in 2016
Fatal accidents locations in 2017
Fatal accidents locations in 2018
Fatal accidents locations in 2019
Fatal accidents locations in 2020
Fatal accidents locations in 2021
Alcohol use - People drinking some alcohol every month (%)
Alcohol use - People not drinking at all (%)
Alcohol use - Average days/month drinking alcohol
Alcohol use - Average drinks/week
Alcohol use - Average days/year people drink much
Audiometry - Average condition of hearing (%)
Audiometry - People that can hear a whisper from across a quiet room (%)
Audiometry - People that can hear normal voice from across a quiet room (%)
Audiometry - Ears ringing, roaring, buzzing (%)
Audiometry - Had a job exposure to loud noise (%)
Audiometry - Had off-work exposure to loud noise (%)
Blood Pressure & Cholesterol - Has high blood pressure (%)
Blood Pressure & Cholesterol - Checking blood pressure at home (%)
Blood Pressure & Cholesterol - Frequently checking blood cholesterol (%)
Blood Pressure & Cholesterol - Has high cholesterol level (%)
Consumer Behavior - Money monthly spent on food at supermarket/grocery store
Consumer Behavior - Money monthly spent on food at other stores
Consumer Behavior - Money monthly spent on eating out
Consumer Behavior - Money monthly spent on carryout/delivered foods
Consumer Behavior - Income spent on food at supermarket/grocery store (%)
Consumer Behavior - Income spent on food at other stores (%)
Consumer Behavior - Income spent on eating out (%)
Consumer Behavior - Income spent on carryout/delivered foods (%)
Current Health Status - General health condition (%)
Current Health Status - Blood donors (%)
Current Health Status - Has blood ever tested for HIV virus (%)
Current Health Status - Left-handed people (%)
Dermatology - People using sunscreen (%)
Diabetes - Diabetics (%)
Diabetes - Had a blood test for high blood sugar (%)
Diabetes - People taking insulin (%)
Diet Behavior & Nutrition - Diet health (%)
Diet Behavior & Nutrition - Milk product consumption (# of products/month)
Diet Behavior & Nutrition - Meals not home prepared (#/week)
Diet Behavior & Nutrition - Meals from fast food or pizza place (#/week)
Diet Behavior & Nutrition - Ready-to-eat foods (#/month)
Diet Behavior & Nutrition - Frozen meals/pizza (#/month)
Drug Use - People that ever used marijuana or hashish (%)
Drug Use - Ever used hard drugs (%)
Drug Use - Ever used any form of cocaine (%)
Drug Use - Ever used heroin (%)
Drug Use - Ever used methamphetamine (%)
Health Insurance - People covered by health insurance (%)
Kidney Conditions-Urology - Avg. # of times urinating at night
Medical Conditions - People with asthma (%)
Medical Conditions - People with anemia (%)
Medical Conditions - People with psoriasis (%)
Medical Conditions - People with overweight (%)
Medical Conditions - Elderly people having difficulties in thinking or remembering (%)
Medical Conditions - People who ever received blood transfusion (%)
Medical Conditions - People having trouble seeing even with glass/contacts (%)
Medical Conditions - People with arthritis (%)
Medical Conditions - People with gout (%)
Medical Conditions - People with congestive heart failure (%)
Medical Conditions - People with coronary heart disease (%)
Medical Conditions - People with angina pectoris (%)
Medical Conditions - People who ever had heart attack (%)
Medical Conditions - People who ever had stroke (%)
Medical Conditions - People with emphysema (%)
Medical Conditions - People with thyroid problem (%)
Medical Conditions - People with chronic bronchitis (%)
Medical Conditions - People with any liver condition (%)
Medical Conditions - People who ever had cancer or malignancy (%)
Mental Health - People who have little interest in doing things (%)
Mental Health - People feeling down, depressed, or hopeless (%)
Mental Health - People who have trouble sleeping or sleeping too much (%)
Mental Health - People feeling tired or having little energy (%)
Mental Health - People with poor appetite or overeating (%)
Mental Health - People feeling bad about themself (%)
Mental Health - People who have trouble concentrating on things (%)
Mental Health - People moving or speaking slowly or too fast (%)
Mental Health - People having thoughts they would be better off dead (%)
Oral Health - Average years since last visit a dentist
Oral Health - People embarrassed because of mouth (%)
Oral Health - People with gum disease (%)
Oral Health - General health of teeth and gums (%)
Oral Health - Average days a week using dental floss/device
Oral Health - Average days a week using mouthwash for dental problem
Oral Health - Average number of teeth
Pesticide Use - Households using pesticides to control insects (%)
Pesticide Use - Households using pesticides to kill weeds (%)
Physical Activity - People doing vigorous-intensity work activities (%)
Physical Activity - People doing moderate-intensity work activities (%)
Physical Activity - People walking or bicycling (%)
Physical Activity - People doing vigorous-intensity recreational activities (%)
Physical Activity - People doing moderate-intensity recreational activities (%)
Physical Activity - Average hours a day doing sedentary activities
Physical Activity - Average hours a day watching TV or videos
Physical Activity - Average hours a day using computer
Physical Functioning - People having limitations keeping them from working (%)
Physical Functioning - People limited in amount of work they can do (%)
Physical Functioning - People that need special equipment to walk (%)
Physical Functioning - People experiencing confusion/memory problems (%)
Physical Functioning - People requiring special healthcare equipment (%)
Prescription Medications - Average number of prescription medicines taking
Preventive Aspirin Use - Adults 40+ taking low-dose aspirin (%)
Reproductive Health - Vaginal deliveries (%)
Reproductive Health - Cesarean deliveries (%)
Reproductive Health - Deliveries resulted in a live birth (%)
Reproductive Health - Pregnancies resulted in a delivery (%)
Reproductive Health - Women breastfeeding newborns (%)
Reproductive Health - Women that had a hysterectomy (%)
Reproductive Health - Women that had both ovaries removed (%)
Reproductive Health - Women that have ever taken birth control pills (%)
Reproductive Health - Women taking birth control pills (%)
Reproductive Health - Women that have ever used Depo-Provera or injectables (%)
Reproductive Health - Women that have ever used female hormones (%)
Sexual Behavior - People 18+ that ever had sex (vaginal, anal, or oral) (%)
Sexual Behavior - Males 18+ that ever had vaginal sex with a woman (%)
Sexual Behavior - Males 18+ that ever performed oral sex on a woman (%)
Sexual Behavior - Males 18+ that ever had anal sex with a woman (%)
Sexual Behavior - Males 18+ that ever had any sex with a man (%)
Sexual Behavior - Females 18+ that ever had vaginal sex with a man (%)
Sexual Behavior - Females 18+ that ever performed oral sex on a man (%)
Sexual Behavior - Females 18+ that ever had anal sex with a man (%)
Sexual Behavior - Females 18+ that ever had any kind of sex with a woman (%)
Sexual Behavior - Average age people first had sex
Sexual Behavior - Average number of female sex partners in lifetime (males 18+)
Sexual Behavior - Average number of female vaginal sex partners in lifetime (males 18+)
Sexual Behavior - Average age people first performed oral sex on a woman (18+)
Sexual Behavior - Average number of woman performed oral sex on in lifetime (18+)
Sexual Behavior - Average number of male sex partners in lifetime (males 18+)
Sexual Behavior - Average number of male anal sex partners in lifetime (males 18+)
Sexual Behavior - Average age people first performed oral sex on a man (18+)
Sexual Behavior - Average number of male oral sex partners in lifetime (18+)
Sexual Behavior - People using protection when performing oral sex (%)
Sexual Behavior - Average number of times people have vaginal or anal sex a year
Sexual Behavior - People having sex without condom (%)
Sexual Behavior - Average number of male sex partners in lifetime (females 18+)
Sexual Behavior - Average number of male vaginal sex partners in lifetime (females 18+)
Sexual Behavior - Average number of female sex partners in lifetime (females 18+)
Sexual Behavior - Circumcised males 18+ (%)
Sleep Disorders - Average hours sleeping at night
Sleep Disorders - People that has trouble sleeping (%)
Smoking-Cigarette Use - People smoking cigarettes (%)
Taste & Smell - People 40+ having problems with smell (%)
Taste & Smell - People 40+ having problems with taste (%)
Taste & Smell - People 40+ that ever had wisdom teeth removed (%)
Taste & Smell - People 40+ that ever had tonsils teeth removed (%)
Taste & Smell - People 40+ that ever had a loss of consciousness because of a head injury (%)
Taste & Smell - People 40+ that ever had a broken nose or other serious injury to face or skull (%)
Taste & Smell - People 40+ that ever had two or more sinus infections (%)
Weight - Average height (inches)
Weight - Average weight (pounds)
Weight - Average BMI
Weight - People that are obese (%)
Weight - People that ever were obese (%)
Weight - People trying to lose weight (%)
23,266 65.8% Asian alone 6,309 17.8% Hispanic 4,606 13.0% White alone 987 2.8% Two or more races 218 0.6% Native Hawaiian and Other 119 0.3% Black alone 44 0.1% American Indian alone 40 0.1% Other race alone
According to our research of California and other state lists, there were 19 registered sex offenders living in Temple City, California as of May 23, 2024 . The ratio of all residents to sex offenders in Temple City is 1,914 to 1.The ratio of registered sex offenders to all residents in this city is much lower than the state average.
Officers per 1,000 residents here:
0.03California average:
1.98
Latest news from Temple City, CA collected exclusively by city-data.com from local newspapers, TV, and radio stations
Ancestries: English (1.5%), American (1.4%), German (1.1%).
Current Local Time:
Land area: 4.01 square miles.
Population density: 8,792 people per square mile (high).
17,675 residents are foreign born (42.4% Asia , 5.9% Latin America ).
This city:
50.0%California:
26.5%
Median real estate property taxes paid for housing units with mortgages in 2022: $7,408 (0.8%)Median real estate property taxes paid for housing units with no mortgage in 2022: $4,905 (0.5%)
Nearest city with pop. 50,000+: Upper San Gabriel Valley, CA (1.8 miles
Nearest city with pop. 1,000,000+: Los Angeles, CA
Nearest cities:
Latitude: 34.10 N, Longitude: 118.06 W
Daytime population change due to commuting: -8,131 (-23.0%)Workers who live and work in this city: 3,424 (20.8%)
Area code commonly used in this area: 626
Property values in Temple City, CA
Single-family new house construction building permits:
2022: 82 buildings , average cost: $169,7002021: 66 buildings , average cost: $156,1002020: 51 buildings , average cost: $189,0002019: 76 buildings , average cost: $276,2002018: 83 buildings , average cost: $266,9002017: 92 buildings , average cost: $311,4002016: 84 buildings , average cost: $360,2002015: 117 buildings , average cost: $349,7002014: 104 buildings , average cost: $356,6002013: 58 buildings , average cost: $310,4002012: 24 buildings , average cost: $436,9002011: 32 buildings , average cost: $394,7002010: 38 buildings , average cost: $356,2002009: 33 buildings , average cost: $314,7002008: 38 buildings , average cost: $283,8002007: 23 buildings , average cost: $233,0002006: 34 buildings , average cost: $233,0002005: 44 buildings , average cost: $233,0002004: 44 buildings , average cost: $233,0002003: 40 buildings , average cost: $233,0002002: 34 buildings , average cost: $233,0002001: 32 buildings , average cost: $233,0002000: 32 buildings , average cost: $232,9001999: 23 buildings , average cost: $208,1001998: 22 buildings , average cost: $217,1001997: 21 buildings , average cost: $182,800Unemployment in December 2023:
Population change in the 1990s: +2,238 (+7.2%).
Most common occupations in Temple City, CA (%)
Both Males Females
Other sales and related occupations, including supervisors (5.5%)
Other management occupations, except farmers and farm managers (5.2%)
Other office and administrative support workers, including supervisors (4.9%)
Secretaries and administrative assistants (3.8%)
Other production occupations, including supervisors (3.4%)
Sales representatives, services, wholesale and manufacturing (3.1%)
Retail sales workers, except cashiers (3.0%)
Other management occupations, except farmers and farm managers (7.2%)
Other sales and related occupations, including supervisors (6.5%)
Other production occupations, including supervisors (4.2%)
Computer specialists (4.1%)
Electrical equipment mechanics and other installation, maintenance, and repair workers, including supervisors (3.9%)
Sales representatives, services, wholesale and manufacturing (3.6%)
Building and grounds cleaning and maintenance occupations (3.1%)
Secretaries and administrative assistants (7.8%)
Other office and administrative support workers, including supervisors (7.0%)
Other sales and related occupations, including supervisors (4.4%)
Bookkeeping, accounting, and auditing clerks (4.3%)
Preschool, kindergarten, elementary, and middle school teachers (4.0%)
Information and record clerks, except customer service representatives (3.9%)
Accountants and auditors (3.6%)
Earthquake activity:
Temple City-area historical earthquake activity is significantly above California state average. It is 7146% greater than the overall U.S. average. On 7/21/1952 at 11:52:14, a magnitude 7.7 (7.7 UK, Class: Major, Intensity: VIII - XII) earthquake occurred 82.0 miles away from the city center, causing $50,000,000 total damage On 6/28/1992 at 11:57:34, a magnitude 7.6 (6.2 MB, 7.6 MS, 7.3 MW, Depth: 0.7 mi) earthquake occurred 87.5 miles away from the city center, causing 3 deaths ( 1 shaking deaths, 2 other deaths) and 400 injuries, causing $100,000,000 total damage and $40,000,000 insured lossesOn 10/16/1999 at 09:46:44, a magnitude 7.4 (6.3 MB, 7.4 MS, 7.2 MW, 7.3 ML) earthquake occurred 97.0 miles away from Temple City center On 11/4/1927 at 13:51:53, a magnitude 7.5 (7.5 UK) earthquake occurred 178.5 miles away from the city center On 1/17/1994 at 12:30:55, a magnitude 6.8 (6.4 MB, 6.8 MS, 6.7 MW, Depth: 11.4 mi, Class: Strong, Intensity: VII - IX) earthquake occurred 29.8 miles away from Temple City center, causing 60 deaths ( 60 shaking deaths) and 7000 injuriesOn 4/21/1918 at 22:32:30, a magnitude 6.8 (6.8 UK) earthquake occurred 40.8 miles away from Temple City center Magnitude types: body-wave magnitude (MB), local magnitude (ML), surface-wave magnitude (MS), moment magnitude (MW) Natural disasters: The number of natural disasters in Los Angeles County (57) is a lot greater than the US average (15).Major Disasters (Presidential) Declared: 27Emergencies Declared: 3Fires: 37, Floods: 16, Storms: 9, Winter Storms: 6, Landslides: 5, Mudslides: 5, Earthquakes: 3, Freeze: 1, Heavy Rain: 1, Hurricane: 1, Snow: 1, Tornado: 1, Wind: 1, Other: 1 (Note: some incidents may be assigned to more than one category). Hospitals and medical centers in Temple City: TEMPLE GARDEN HOMES #3 (9556 BROADWAY) TEMPLE GARDENS HOMES IV (5120 BALDWIN AVENUE) BALDWIN GARDENS NURSING CENTER (10786 LIVE OAK AVENUE)
SANTA ANITA CONVALESCENT HOSP (5522 GRACEWOOD AVE.)
TEMPLE CITY CONVALESCENT HOSP (5101 TYLER AVENUE)
TEMPLE CITY DIALYSIS FACILITY, INC. (9945 LOWER AZUSA ROAD)
BRIGHT CARE HOME HEALTH, INC (9908 LAS TUNAS DRIVE, UNIT L)
ROYAL HEALTH HOMECARE AGENCY, INC (4808 BALDWAIN AVENUE, SUITE 101)
Amtrak stations near Temple City: 6 miles: PASADENA (150 S. ROBLES AVE.) - Bus Station Services: fully wheelchair accessible, enclosed waiting area, public restrooms, public payphones, full-service food facilities, paid short-term parking, paid long-term parking, taxi stand, public transit connection.
11 miles: LOS ANGELES (800 N. ALAMEDA ST.) Services: ticket office, fully wheelchair accessible, enclosed waiting area, public restrooms, public payphones, snack bar, free short-term parking, paid long-term parking, car rental agency, taxi stand, public transit connection.
12 miles: GLENDALE (400 W. CERRITOS AVE.) Services: fully wheelchair accessible, public payphones, free short-term parking, free long-term parking, call for taxi service, intercity bus service, public transit connection.
Colleges/universities with over 2000 students nearest to Temple City:
Pasadena City College (about 5 miles; Pasadena, CA ; Full-time enrollment: 14,712)
California Institute of Technology (about 5 miles; Pasadena, CA ; FT enrollment: 2,246)
Le Cordon Bleu College of Culinary Arts-Pasadena (about 6 miles; Pasadena, CA ; FT enrollment: 2,934)
Rio Hondo College (about 6 miles; Whittier, CA ; FT enrollment: 9,610)
East Los Angeles College (about 7 miles; Monterey Park, CA ; FT enrollment: 17,297)
California State University-Los Angeles (about 7 miles; Los Angeles, CA ; FT enrollment: 17,545)
Hacienda La Puente Adult Education (about 9 miles; La Puente, CA ; FT enrollment: 2,750)
Public high schools in Temple City:
Public elementary/middle schools in Temple City: OAK AVENUE INTERMEDIATE Students: 872, Location: 6623 OAK AVE., Grades: 7-8)LONGDEN ELEMENTARY Students: 725, Location: 9501 WENDON ST., Grades: KG-6)CLOVERLY ELEMENTARY Students: 439, Location: 5476 CLOVERLY AVE., Grades: 4-6)CLEMINSON ELEMENTARY Students: 262, Location: 5213 N. DALEVIEW AVE., Grades: KG-6)LA ROSA ELEMENTARY Students: 249, Location: 9301 LA ROSA DR., Grades: KG-3)Private elementary/middle schools in Temple City: ST LUKE THE EVANGELIST CATHOLIC SCHOOL Students: 186, Location: 5521 CLOVERLY AVE, Grades: KG-8)
FIRST LUTHERAN SCHOOL Students: 89, Location: 9123 BROADWAY, Grades: PK-8)
See full list of schools located in Temple City
Notable locations in Temple City: (A) , Temple City City Hall (B) , Temple City Branch County of Los Angeles Public Library (C) , Temple Sheriffs Station (D) , Los Angeles County Fire Department Station 47 (E) . Display/hide their locations on the map
Shopping Centers: (1) , Elm Center Shopping Center (2) . Display/hide their locations on the map
Churches in Temple City include: (A) , Church of the Nazarene (B) , The Church of Jesus Christ of Latter Day Saints (C) , First Lutheran Church (D) , First Southern Baptist Church (E) , First United Methodist Church (F) , Grace Baptist Church (G) , New Beginnings Family Church (H) , Pacific Ackworth Friends Meeting House (I) . Display/hide their locations on the map
Parks in Temple City include: (1) , Temple City Park (2) . Display/hide their locations on the map
Birthplace of: Julia Ling - Actor.
Los Angeles County has a predicted average indoor radon screening level between 2 and 4 pCi/L (pico curies per liter) - Moderate Potential Average household size: This city:
3.0 peopleCalifornia:
2.9 people
Percentage of family households: This city:
77.6%Whole state:
68.7%
Percentage of households with unmarried partners: This city:
4.0%Whole state:
7.2%
Likely homosexual households (counted as self-reported same-sex unmarried-partner households)
Lesbian couples: 0.4% of all households Gay men: 0.2% of all households
People in group quarters in Temple City in 2010:
388 people in nursing facilities/skilled-nursing facilities
15 people in group homes intended for adults
10 people in other noninstitutional facilities
5 people in group homes for juveniles (non-correctional)
3 people in residential treatment centers for adults
People in group quarters in Temple City in 2000:
409 people in nursing homes
91 people in other group homes
4 people in schools, hospitals, or wards for the intellectually disabled
4 people in homes for the mentally retarded
3 people in religious group quarters
Banks with branches in Temple City (2011 data):
JPMorgan Chase Bank, National Association: Temple City Branch at 8905 Las Tunas Drive, branch established on 1889/01/01; 9647 East Las Tunas Dr Branch at 9647 E. Las Tunas Dr., branch established on 1988/12/27. Info updated 2011/11/10: Bank assets: $1,811,678.0 mil, Deposits: $1,190,738.0 mil, headquarters in Columbus, OH, positive income , International Specialization, 5577 total offices , Holding Company: Jpmorgan Chase & Co.
Citibank, National Association: Temple City Branch at 9503 East Las Tunas Drive, branch established on 1987/06/30. Info updated 2012/01/10: Bank assets: $1,288,658.0 mil, Deposits: $882,541.0 mil, headquarters in Sioux Falls, SD, positive income , International Specialization, 1048 total offices , Holding Company: Citigroup Inc.
HSBC Bank USA, National Association: Temple City Branch at 9601 Las Tunas Drive, branch established on 2010/01/25. Info updated 2010/11/30: Bank assets: $206,009.7 mil, Deposits: $149,026.8 mil, headquarters in Mc Lean, VA, positive income , 474 total offices , Holding Company: Hsbc Holdings Plc
Wells Fargo Bank, National Association: Temple City Branch at 9635 Las Tunas Drive, branch established on 2003/01/06. Info updated 2011/04/05: Bank assets: $1,161,490.0 mil, Deposits: $905,653.0 mil, headquarters in Sioux Falls, SD, positive income , 6395 total offices , Holding Company: Wells Fargo & Company
Bank of America, National Association: Temple City Branch at 9545 East Las Tunas Drive, branch established on 1962/11/09. Info updated 2009/11/18: Bank assets: $1,451,969.3 mil, Deposits: $1,077,176.8 mil, headquarters in Charlotte, NC, positive income , 5782 total offices , Holding Company: Bank Of America Corporation
East West Bank: Temple City Branch at 5607 North Rosemead Blvd., branch established on 1985/06/30. Info updated 2010/06/14: Bank assets: $21,962.4 mil, Deposits: $17,501.8 mil, headquarters in Pasadena, CA, positive income , Commercial Lending Specialization, 131 total offices , Holding Company: East West Bancorp, Inc.
The Bank of East Asia (USA), National Association: Temple City Branch at 5773 Rosemead Boulevard, branch established on 2003/08/08. Info updated 2006/05/30: Bank assets: $780.4 mil, Deposits: $620.7 mil, headquarters in New York, NY, positive income , Commercial Lending Specialization, 13 total offices , Holding Company: Bank Of East Asia, Limited, The
Bank of the West: Temple City Branch at 9934 East Las Tunas Drive, branch established on 1978/02/01. Info updated 2009/11/16: Bank assets: $62,408.3 mil, Deposits: $43,995.2 mil, headquarters in San Francisco, CA, positive income , 647 total offices , Holding Company: Bnp Paribas
For population 15 years and over in Temple City:
Never married: 31.7%Now married: 51.8%Separated: 1.3%Widowed: 7.7%Divorced: 7.5% For population 25 years and over in Temple City:
High school or higher: 88.2%Bachelor's degree or higher: 41.9%Graduate or professional degree: 14.1%Unemployed: 5.0%Mean travel time to work (commute): 26.2 minutes
Education Gini index (Inequality in education) Here:
13.7California average:
15.5
Religion statistics for Temple City, CA (based on Los Angeles County data)
Religion Adherents Congregations Catholic 3,542,994 275 Evangelical Protestant 814,611 3,249 Other 451,594 1,023 Mainline Protestant 229,056 860 Black Protestant 112,338 290 Orthodox 63,517 76 None 4,604,495 -
Source: Clifford Grammich, Kirk Hadaway, Richard Houseal, Dale E.Jones, Alexei Krindatch, Richie Stanley and Richard H.Taylor. 2012. 2010 U.S.Religion Census: Religious Congregations & Membership Study. Association of Statisticians of American Religious Bodies. Jones, Dale E., et al. 2002. Congregations and Membership in the United States 2000. Nashville, TN: Glenmary Research Center. Graphs represent county-level data
Food Environment Statistics: Number of grocery stores : 2,084Los Angeles County :
2.12 / 10,000 pop.California :
2.14 / 10,000 pop.
Number of supercenters and club stores : 32Los Angeles County :
0.03 / 10,000 pop.State :
0.04 / 10,000 pop.
Number of convenience stores (no gas) : 567This county :
0.58 / 10,000 pop.California :
0.62 / 10,000 pop.
Number of convenience stores (with gas) : 1,206Here :
1.23 / 10,000 pop.State :
1.49 / 10,000 pop.
Number of full-service restaurants : 7,008Los Angeles County :
7.15 / 10,000 pop.California :
7.42 / 10,000 pop.
Adult diabetes rate : Los Angeles County :
7.5%State :
7.3%
Adult obesity rate : Los Angeles County :
20.4%State :
21.3%
Low-income preschool obesity rate : This county :
18.6%State :
17.9%
Health and Nutrition: Healthy diet rate : Here:
54.3%California:
49.4%
Average overall health of teeth and gums : Here:
50.8%California:
48.0%
Average BMI : Temple City:
27.0California:
28.1
People feeling badly about themselves : This city:
17.0%California:
20.2%
People not drinking alcohol at all : This city:
16.8%California:
11.2%
Average hours sleeping at night : Temple City:
6.9California:
6.8
Overweight people : Temple City:
27.9%California:
31.5%
General health condition : This city:
57.6%California:
56.4%
Average condition of hearing : More about Health and Nutrition of Temple City, CA Residents
Temple City government finances - Expenditure in 2017 (per resident):
Construction - Housing and Community Development: $120,000 ($3.40)
Current Operations - Central Staff Services: $5,881,000 ($166.62)
Police Protection: $4,574,000 ($129.59)Parks and Recreation: $2,298,000 ($65.11)Protective Inspection and Regulation - Other: $1,644,000 ($46.58)Regular Highways: $1,549,000 ($43.89)Transit Utilities: $684,000 ($19.38)Financial Administration: $603,000 ($17.08)Health - Other: $338,000 ($9.58)Housing and Community Development: $307,000 ($8.70)Parking Facilities: $153,000 ($4.33)General - Interest on Debt: $268,000 ($7.59)
Other Capital Outlay - General - Other: $152,000 ($4.31)
Central Staff Services: $107,000 ($3.03)Protective Inspection and Regulation - Other: $86,000 ($2.44)Parks and Recreation: $67,000 ($1.90)Financial Administration: $8,000 ($0.23)Regular Highways: $3,000 ($0.08)Health - Other: $1,000 ($0.03)
Temple City government finances - Revenue in 2017 (per resident):
Charges - Regular Highways: $1,374,000 ($38.93)
Other: $1,119,000 ($31.70)Parks and Recreation: $598,000 ($16.94)Federal Intergovernmental - Housing and Community Development: $288,000 ($8.16)
Other: $87,000 ($2.46)Local Intergovernmental - Other: $412,000 ($11.67)
Miscellaneous - Fines and Forfeits: $825,000 ($23.37)
General Revenue - Other: $334,000 ($9.46)Interest Earnings: $91,000 ($2.58)Rents: $87,000 ($2.46)Revenue - Transit Utilities: $87,000 ($2.46)
State Intergovernmental - Other: $1,680,000 ($47.60)
Highways: $694,000 ($19.66)General Local Government Support: $25,000 ($0.71)Tax - Property: $7,192,000 ($203.76)
General Sales and Gross Receipts: $1,959,000 ($55.50)Other License: $1,450,000 ($41.08)Public Utilities Sales: $538,000 ($15.24)Occupation and Business License - Other: $199,000 ($5.64)Documentary and Stock Transfer: $194,000 ($5.50)Other Selective Sales: $55,000 ($1.56)
Temple City government finances - Debt in 2017 (per resident):
Long Term Debt - Beginning Outstanding - Unspecified Public Purpose: $6,712,000 ($190.16)
Outstanding Unspecified Public Purpose: $6,397,000 ($181.24)Retired Unspecified Public Purpose: $315,000 ($8.92)
Temple City government finances - Cash and Securities in 2017 (per resident):
Bond Funds - Cash and Securities: $222,000 ($6.29)
Other Funds - Cash and Securities: $27,445,000 ($777.57)
2.98% of this county's 2021 resident taxpayers lived in other counties in 2020 ($81,235 average adjusted gross income )
Here:
2.98%California average:
5.19%
0.01% of residents moved from foreign countries ($155 average AGI )Los Angeles County:
0.01%California average:
0.03%
Top counties from which taxpayers relocated into this county between 2020 and 2021:
4.68% of this county's 2020 resident taxpayers moved to other counties in 2021 ($97,324 average adjusted gross income )
Here:
4.68%California average:
6.14%
0.01% of residents moved to foreign countries ($196 average AGI )Los Angeles County:
0.01%California average:
0.02%
Top counties to which taxpayers relocated from this county between 2020 and 2021:
Businesses in Temple City, CA
Name Count Name Count
7-Eleven 1 H&R Block 1 99 Cents Only Stores 1 HomeTown Buffet 1 AT&T 1 Kmart 1 Applebee's 1 Kroger 1 AutoZone 1 Little Caesars Pizza 1 Baskin-Robbins 1 MasterBrand Cabinets 6 Blockbuster 1 McDonald's 1 Burger King 1 Office Depot 1 CVS 2 Payless 1 Carl\s Jr. 1 RadioShack 1 Curves 1 Rite Aid 1 DHL 1 SAS Shoes 1 Decora Cabinetry 2 Sears 1 Dennys 1 Starbucks 1 Domino's Pizza 1 Subway 1 El Pollo Loco 1 T.J.Maxx 1 FedEx 2 UPS 3 GNC 1
Strongest AM radio stations in Temple City:
KLAC (570 AM; 50 kW; LOS ANGELES, CA; Owner: AMFM RADIO LICENSES, L.L.C.)
KDIS (1110 AM; 50 kW; PASADENA, CA; Owner: ABC,INC.)
KTNQ (1020 AM; 50 kW; LOS ANGELES, CA; Owner: KTNQ-AM LICENSE CORP.)
KMRB (1430 AM; 5 kW; SAN GABRIEL, CA; Owner: POLYETHNIC BROADCASTING, INC.)
KXTA (1150 AM; 50 kW; LOS ANGELES, CA; Owner: CITICASTERS LICENSES, L.P.)
KFWB (980 AM; 50 kW; LOS ANGELES, CA; Owner: INFINITY BROADCASTING OPERATIONS, INC.)
KMPC (1540 AM; 50 kW; LOS ANGELES, CA; Owner: ROSE CITY RADIO CORPORATION)
KFI (640 AM; 50 kW; LOS ANGELES, CA; Owner: CAPSTAR TX LIMITED PARTNERSHIP)
KXMX (1190 AM; 25 kW; ANAHEIM, CA; Owner: NEW INSPIRATION BROADCASTING COMPANY)
KBLA (1580 AM; 50 kW; SANTA MONICA, CA)
KRLA (870 AM; 20 kW; GLENDALE, CA; Owner: NEW INSPIRATION BROADCASTING COMPANY)
KAZN (1300 AM; 5 kW; PASADENA, CA; Owner: MULTICULTURAL RADIO BROADCASTING, INC.)
KSPN (710 AM; 50 kW; LOS ANGELES, CA; Owner: KABC-AM RADIO, INC.)
Strongest FM radio stations in Temple City:
KCBS-FM (93.1 FM; LOS ANGELES, CA; Owner: INFINITY BROADCASTING OPERATIONS, INC.)
KSCA (101.9 FM; GLENDALE, CA; Owner: HBC LICENSE CORPORATION)
KOST (103.5 FM; LOS ANGELES, CA; Owner: CAPSTAR TX LIMITED PARTNERSHIP)
KLOS (95.5 FM; LOS ANGELES, CA; Owner: KLOS-FM RADIO, INC.)
K212FA (90.3 FM; TEMPLE CITY, CA; Owner: EDUCATIONAL MEDIA FOUNDATION)
KIIS-FM (102.7 FM; LOS ANGELES, CA; Owner: CITICASTERS LICENSES, L.P.)
KZLA-FM (93.9 FM; LOS ANGELES, CA; Owner: EMMIS RADIO LICENSE CORPORATION)
KPCC (89.3 FM; PASADENA, CA; Owner: PASADENA AREA COMMUNITY COLLEGE DISTRICT)
KLVE (107.5 FM; LOS ANGELES, CA; Owner: KLVE-FM LICENSE CORP.)
KHHT (92.3 FM; LOS ANGELES, CA; Owner: AMFM RADIO LICENSES, L.L.C.)
KBIG-FM (104.3 FM; LOS ANGELES, CA; Owner: AMFM RADIO LICENSES, L.L.C.)
KTWV (94.7 FM; LOS ANGELES, CA; Owner: INFINITY BROADCASTING OPERATIONS, INC.)
KPWR (105.9 FM; LOS ANGELES, CA; Owner: EMMIS RADIO LICENSE CORPORATION)
KLSX (97.1 FM; LOS ANGELES, CA; Owner: INFINITY BROADCASTING OPERATIONS, INC.)
KMZT-FM (105.1 FM; LOS ANGELES, CA; Owner: MOUNT WILSON FM BROADCASTERS, INC.)
K216EM (91.1 FM; ARCADIA, CA; Owner: LIFE ON THE WAY COMMUNICATIONS, INC.)
KPFK (90.7 FM; LOS ANGELES, CA; Owner: PACIFICA FOUNDATION, INC)
KUSC (91.5 FM; LOS ANGELES, CA; Owner: UNIVERSITY OF SOUTHERN CALIFORNIA)
KKLA-FM (99.5 FM; LOS ANGELES, CA; Owner: NEW INSPIRATION BROADCASTING CO., INC.)
KRTH-FM (101.1 FM; LOS ANGELES, CA; Owner: INFINITY BROADCASTING OPERATIONS, INC.)
TV broadcast stations around Temple City:
KCBS-TV (Channel 2; LOS ANGELES, CA; Owner: CBS BROADCASTING INC.)
KTLA-TV (Channel 5; LOS ANGELES, CA; Owner: KTLA INC.)
KABC-TV (Channel 7; LOS ANGELES, CA; Owner: ABC HOLDING COMPANY, INC.)
KNBC (Channel 4; LOS ANGELES, CA; Owner: NBC SUBSIDIARY (KNBC-TV), INC.)
KCAL-TV (Channel 9; LOS ANGELES, CA; Owner: VIACOM TELEVISION STATIONS GROUP OF LOS ANGELES LLC)
KTRO-LP (Channel 50; LANCASTER, CA; Owner: ROBERT D. ADELMAN)
KSCI (Channel 18; LONG BEACH, CA; Owner: KSLS, INC.)
KMEX-TV (Channel 34; LOS ANGELES, CA; Owner: KMEX LICENSE PARTNERSHIP, G.P.)
KAZA-TV (Channel 54; AVALON, CA; Owner: PAPPAS SOUTHERN CALIFORNIA LICENSE LLC)
KDOC-TV (Channel 56; ANAHEIM, CA; Owner: GOLDEN ORANGE BROADCASTING CO., INC.)
KOCE-TV (Channel 50; HUNTINGTON BEACH, CA; Owner: BD. OF TRUSTEES, COAST COMMUNITY COLLEGE DIST.)
KCET (Channel 28; LOS ANGELES, CA; Owner: COMMUNITY TELEVISION OF SOUTHERN CALIFORNIA)
KXLA (Channel 44; RANCHO PALOS VERDES, CA; Owner: RANCHO PALOS VERDES BROADCASTERS, INC.)
KFTR (Channel 46; ONTARIO, CA; Owner: TELEFUTURA LOS ANGELES LLC)
KTTV (Channel 11; LOS ANGELES, CA; Owner: FOX TELEVISION STATIONS, INC.)
KVEA (Channel 52; CORONA, CA; Owner: ESTRELLA LICENSE CORPORATION)
KWHY-TV (Channel 22; LOS ANGELES, CA; Owner: TELEMUNDO OF LOS ANGELES LICENSE CORPORATION)
KCOP-TV (Channel 13; LOS ANGELES, CA; Owner: FOX TELEVISION STATIONS, INC.)
KSFV-LP (Channel 26; SAN FERNANDO VALLEY, CA; Owner: VENTURE TECHNOLOGIES GROUP, LLC)
KTBN-TV (Channel 40; SANTA ANA, CA; Owner: TRINITY BROADCASTING NETWORK, INC.)
KHIZ (Channel 64; BARSTOW, CA; Owner: SUNBELT TELEVISION, INC.)
KLCS (Channel 58; LOS ANGELES, CA; Owner: LOS ANGELES UNIFIED SCHOOL DISTRICT)
KHTV-LP (Channel 48; INLAND EMPIRE, CA; Owner: VENTURE TECHNOLOGIES GROUP, LLC)
KLAU-LP (Channel 66; REDLANDS, CA; Owner: GERALD BENAVIDES)
KNET-LP (Channel 38; LOS ANGELES, CA; Owner: VENTURE TECHNOLOGIES GROUP, LLC)
Home Mortgage Disclosure Act Aggregated Statistics For Year 2009(Based on 5 full and 5 partial tracts) A) FHA, FSA/RHS & VA B) Conventional C) Refinancings D) Home Improvement Loans F) Non-occupant Loans on Number Average Value Number Average Value Number Average Value Number Average Value Number Average Value
LOANS ORIGINATED 7 $416,746 163 $355,489 775 $316,429 37 $265,993 38 $309,093 APPLICATIONS APPROVED, NOT ACCEPTED 1 $344,000 27 $359,264 103 $333,384 4 $202,610 9 $381,360 APPLICATIONS DENIED 4 $419,270 42 $364,060 216 $353,846 8 $161,216 29 $311,445 APPLICATIONS WITHDRAWN 1 $493,040 33 $335,940 112 $331,707 10 $148,516 13 $297,235 FILES CLOSED FOR INCOMPLETENESS 0 $0 10 $299,661 45 $357,031 0 $0 2 $306,760
Aggregated Statistics For Year 2008(Based on 5 full and 5 partial tracts) A) FHA, FSA/RHS & VA B) Conventional C) Refinancings D) Home Improvement Loans E) Loans on Dwellings For 5+ Families F) Non-occupant Loans on G) Loans On Manufactured Number Average Value Number Average Value Number Average Value Number Average Value Number Average Value Number Average Value Number Average Value
LOANS ORIGINATED 0 $0 198 $372,796 357 $323,112 29 $236,125 1 $958,230 44 $334,695 1 $27,840 APPLICATIONS APPROVED, NOT ACCEPTED 0 $0 37 $354,141 93 $355,968 8 $213,135 0 $0 10 $292,626 3 $87,647 APPLICATIONS DENIED 1 $299,200 53 $368,045 180 $374,350 24 $161,171 0 $0 13 $391,204 3 $50,963 APPLICATIONS WITHDRAWN 1 $286,000 48 $371,454 81 $361,786 10 $247,049 0 $0 9 $397,467 0 $0 FILES CLOSED FOR INCOMPLETENESS 0 $0 14 $398,509 37 $383,594 6 $136,230 0 $0 7 $437,813 0 $0
Aggregated Statistics For Year 2007(Based on 5 full and 5 partial tracts) B) Conventional C) Refinancings D) Home Improvement Loans E) Loans on Dwellings For 5+ Families F) Non-occupant Loans on G) Loans On Manufactured Number Average Value Number Average Value Number Average Value Number Average Value Number Average Value Number Average Value
LOANS ORIGINATED 292 $396,167 507 $357,228 62 $244,052 7 $1,186,164 78 $406,259 0 $0 APPLICATIONS APPROVED, NOT ACCEPTED 70 $422,309 119 $385,268 16 $266,892 0 $0 25 $448,131 2 $56,705 APPLICATIONS DENIED 77 $390,744 203 $392,192 27 $182,175 0 $0 16 $379,976 3 $64,863 APPLICATIONS WITHDRAWN 34 $390,945 121 $345,431 13 $347,576 0 $0 10 $409,467 0 $0 FILES CLOSED FOR INCOMPLETENESS 29 $367,786 36 $395,449 6 $303,440 0 $0 2 $189,205 0 $0
Aggregated Statistics For Year 2006(Based on 5 full and 5 partial tracts) B) Conventional C) Refinancings D) Home Improvement Loans E) Loans on Dwellings For 5+ Families F) Non-occupant Loans on G) Loans On Manufactured Number Average Value Number Average Value Number Average Value Number Average Value Number Average Value Number Average Value
LOANS ORIGINATED 450 $370,080 589 $353,374 88 $231,391 10 $948,516 114 $379,526 2 $60,980 APPLICATIONS APPROVED, NOT ACCEPTED 108 $373,753 89 $383,216 10 $167,046 0 $0 16 $433,556 5 $67,150 APPLICATIONS DENIED 131 $366,960 204 $363,216 57 $293,963 0 $0 21 $468,590 1 $37,680 APPLICATIONS WITHDRAWN 70 $362,867 147 $362,679 18 $212,628 0 $0 17 $399,688 0 $0 FILES CLOSED FOR INCOMPLETENESS 14 $400,665 25 $357,768 5 $262,006 0 $0 1 $419,170 0 $0
Aggregated Statistics For Year 2005(Based on 5 full and 5 partial tracts) B) Conventional C) Refinancings D) Home Improvement Loans E) Loans on Dwellings For 5+ Families F) Non-occupant Loans on G) Loans On Manufactured Number Average Value Number Average Value Number Average Value Number Average Value Number Average Value Number Average Value
LOANS ORIGINATED 511 $376,953 724 $310,788 89 $220,734 6 $1,256,097 119 $341,488 0 $0 APPLICATIONS APPROVED, NOT ACCEPTED 103 $398,406 124 $306,668 11 $151,585 0 $0 18 $346,638 4 $86,405 APPLICATIONS DENIED 112 $414,814 196 $332,082 39 $203,991 1 $861,880 33 $447,734 1 $117,000 APPLICATIONS WITHDRAWN 67 $365,673 189 $295,491 24 $199,088 0 $0 22 $387,006 0 $0 FILES CLOSED FOR INCOMPLETENESS 21 $370,488 69 $340,777 4 $289,568 0 $0 10 $412,383 0 $0
Aggregated Statistics For Year 2004(Based on 5 full and 5 partial tracts) A) FHA, FSA/RHS & VA B) Conventional C) Refinancings D) Home Improvement Loans E) Loans on Dwellings For 5+ Families F) Non-occupant Loans on G) Loans On Manufactured Number Average Value Number Average Value Number Average Value Number Average Value Number Average Value Number Average Value Number Average Value
LOANS ORIGINATED 1 $282,720 517 $330,636 1,017 $260,235 89 $181,760 11 $567,127 128 $304,469 0 $0 APPLICATIONS APPROVED, NOT ACCEPTED 0 $0 89 $334,589 189 $259,360 13 $175,014 0 $0 19 $235,284 0 $0 APPLICATIONS DENIED 1 $282,720 94 $373,226 207 $283,435 32 $127,165 2 $365,475 20 $269,468 1 $8,350 APPLICATIONS WITHDRAWN 0 $0 47 $350,245 196 $248,319 26 $132,810 1 $418,000 8 $229,358 0 $0 FILES CLOSED FOR INCOMPLETENESS 0 $0 13 $329,942 90 $259,820 3 $298,810 0 $0 5 $292,254 0 $0
Aggregated Statistics For Year 2003(Based on 5 full and 5 partial tracts) A) FHA, FSA/RHS & VA B) Conventional C) Refinancings D) Home Improvement Loans E) Loans on Dwellings For 5+ Families F) Non-occupant Loans on Number Average Value Number Average Value Number Average Value Number Average Value Number Average Value Number Average Value
LOANS ORIGINATED 1 $339,810 475 $266,070 2,492 $205,574 29 $85,263 13 $1,070,685 156 $209,343 APPLICATIONS APPROVED, NOT ACCEPTED 0 $0 61 $282,180 417 $213,896 9 $67,458 0 $0 28 $226,943 APPLICATIONS DENIED 0 $0 71 $271,338 343 $223,088 27 $40,537 0 $0 22 $186,558 APPLICATIONS WITHDRAWN 0 $0 54 $226,228 404 $204,364 6 $75,975 2 $512,500 24 $203,438 FILES CLOSED FOR INCOMPLETENESS 0 $0 15 $296,761 76 $210,435 3 $40,287 0 $0 6 $190,917
Aggregated Statistics For Year 2002(Based on 5 full and 5 partial tracts) A) FHA, FSA/RHS & VA B) Conventional C) Refinancings D) Home Improvement Loans E) Loans on Dwellings For 5+ Families F) Non-occupant Loans on Number Average Value Number Average Value Number Average Value Number Average Value Number Average Value Number Average Value
LOANS ORIGINATED 4 $233,872 475 $228,656 1,637 $194,143 29 $75,619 9 $2,347,367 94 $197,907 APPLICATIONS APPROVED, NOT ACCEPTED 2 $134,450 65 $230,031 263 $197,085 11 $46,735 0 $0 12 $178,420 APPLICATIONS DENIED 0 $0 53 $242,399 236 $188,448 12 $99,138 1 $3,075,000 17 $190,911 APPLICATIONS WITHDRAWN 0 $0 55 $225,032 232 $206,734 5 $63,404 2 $257,735 10 $236,608 FILES CLOSED FOR INCOMPLETENESS 0 $0 22 $223,433 93 $183,100 0 $0 0 $0 4 $166,078
Aggregated Statistics For Year 2001(Based on 5 full and 5 partial tracts) A) FHA, FSA/RHS & VA B) Conventional C) Refinancings D) Home Improvement Loans E) Loans on Dwellings For 5+ Families F) Non-occupant Loans on Number Average Value Number Average Value Number Average Value Number Average Value Number Average Value Number Average Value
LOANS ORIGINATED 9 $170,929 440 $205,923 1,084 $180,711 64 $61,943 5 $703,132 70 $183,495 APPLICATIONS APPROVED, NOT ACCEPTED 1 $146,340 47 $195,784 161 $182,334 20 $48,022 0 $0 11 $148,143 APPLICATIONS DENIED 2 $174,500 64 $205,086 204 $172,293 35 $52,794 1 $1,162,000 16 $184,412 APPLICATIONS WITHDRAWN 0 $0 48 $185,691 166 $183,915 11 $55,402 1 $474,050 6 $179,328 FILES CLOSED FOR INCOMPLETENESS 1 $267,900 14 $207,074 65 $191,949 1 $63,860 0 $0 4 $202,732
Aggregated Statistics For Year 2000(Based on 5 full and 5 partial tracts) A) FHA, FSA/RHS & VA B) Conventional C) Refinancings D) Home Improvement Loans E) Loans on Dwellings For 5+ Families F) Non-occupant Loans on Number Average Value Number Average Value Number Average Value Number Average Value Number Average Value Number Average Value
LOANS ORIGINATED 17 $187,945 442 $183,644 217 $140,866 59 $37,198 3 $503,770 31 $158,702 APPLICATIONS APPROVED, NOT ACCEPTED 3 $215,520 51 $178,727 44 $144,535 17 $33,708 0 $0 5 $165,132 APPLICATIONS DENIED 4 $163,580 53 $180,926 125 $151,583 30 $34,521 0 $0 5 $133,550 APPLICATIONS WITHDRAWN 4 $211,285 49 $172,517 67 $136,019 11 $45,775 0 $0 3 $265,867 FILES CLOSED FOR INCOMPLETENESS 0 $0 19 $175,458 32 $173,146 4 $36,465 0 $0 2 $207,205
Aggregated Statistics For Year 1999(Based on 6 full and 4 partial tracts) A) FHA, FSA/RHS & VA B) Conventional C) Refinancings D) Home Improvement Loans E) Loans on Dwellings For 5+ Families F) Non-occupant Loans on Number Average Value Number Average Value Number Average Value Number Average Value Number Average Value Number Average Value
LOANS ORIGINATED 22 $154,485 404 $175,186 523 $147,356 58 $38,012 6 $380,173 69 $145,956 APPLICATIONS APPROVED, NOT ACCEPTED 2 $112,650 36 $161,968 90 $149,779 19 $30,778 0 $0 9 $180,407 APPLICATIONS DENIED 6 $225,070 77 $162,817 175 $143,748 26 $24,485 3 $270,913 17 $112,111 APPLICATIONS WITHDRAWN 3 $155,873 45 $142,454 105 $154,114 6 $16,655 2 $978,650 9 $170,534 FILES CLOSED FOR INCOMPLETENESS 0 $0 23 $186,620 53 $170,801 3 $41,897 1 $762,080 5 $139,252
Detailed mortgage data for all 10 tracts in Temple City, CA
Private Mortgage Insurance Companies Aggregated Statistics For Year 2009(Based on 4 full and 4 partial tracts) A) Conventional B) Refinancings Number Average Value Number Average Value
LOANS ORIGINATED 4 $303,540 1 $204,990 APPLICATIONS APPROVED, NOT ACCEPTED 4 $363,748 2 $350,380 APPLICATIONS DENIED 6 $509,500 1 $375,000 APPLICATIONS WITHDRAWN 0 $0 1 $413,330 FILES CLOSED FOR INCOMPLETENESS 0 $0 1 $463,880
Aggregated Statistics For Year 2008(Based on 5 full and 5 partial tracts) A) Conventional B) Refinancings Number Average Value Number Average Value
LOANS ORIGINATED 10 $434,852 2 $548,415 APPLICATIONS APPROVED, NOT ACCEPTED 3 $521,347 1 $554,810 APPLICATIONS DENIED 2 $461,000 0 $0 APPLICATIONS WITHDRAWN 1 $312,590 0 $0 FILES CLOSED FOR INCOMPLETENESS 0 $0 0 $0
Aggregated Statistics For Year 2007(Based on 4 full and 3 partial tracts) A) Conventional B) Refinancings C) Non-occupant Loans on Number Average Value Number Average Value Number Average Value
LOANS ORIGINATED 3 $615,583 3 $598,823 0 $0 APPLICATIONS APPROVED, NOT ACCEPTED 2 $510,455 1 $660,480 1 $461,910 APPLICATIONS DENIED 0 $0 0 $0 0 $0 APPLICATIONS WITHDRAWN 0 $0 0 $0 0 $0 FILES CLOSED FOR INCOMPLETENESS 0 $0 0 $0 0 $0
Aggregated Statistics For Year 2006(Based on 2 full and 4 partial tracts) A) Conventional B) Refinancings C) Non-occupant Loans on Number Average Value Number Average Value Number Average Value
LOANS ORIGINATED 1 $525,250 1 $378,640 0 $0 APPLICATIONS APPROVED, NOT ACCEPTED 1 $504,000 2 $380,495 1 $504,000 APPLICATIONS DENIED 0 $0 0 $0 0 $0 APPLICATIONS WITHDRAWN 1 $472,000 0 $0 0 $0 FILES CLOSED FOR INCOMPLETENESS 0 $0 0 $0 0 $0
Aggregated Statistics For Year 2005(Based on 4 full and 5 partial tracts) A) Conventional B) Refinancings C) Non-occupant Loans on Number Average Value Number Average Value Number Average Value
LOANS ORIGINATED 6 $474,975 1 $247,350 0 $0 APPLICATIONS APPROVED, NOT ACCEPTED 6 $436,342 1 $420,390 1 $349,890 APPLICATIONS DENIED 1 $421,100 0 $0 0 $0 APPLICATIONS WITHDRAWN 1 $442,960 0 $0 0 $0 FILES CLOSED FOR INCOMPLETENESS 0 $0 0 $0 0 $0
Aggregated Statistics For Year 2004(Based on 5 full and 4 partial tracts) A) Conventional B) Refinancings C) Non-occupant Loans on Number Average Value Number Average Value Number Average Value
LOANS ORIGINATED 15 $372,087 7 $331,046 1 $316,190 APPLICATIONS APPROVED, NOT ACCEPTED 4 $213,982 4 $318,215 0 $0 APPLICATIONS DENIED 2 $457,110 0 $0 0 $0 APPLICATIONS WITHDRAWN 1 $332,050 1 $315,000 0 $0 FILES CLOSED FOR INCOMPLETENESS 1 $383,000 0 $0 0 $0
Aggregated Statistics For Year 2003(Based on 5 full and 5 partial tracts) A) Conventional B) Refinancings C) Non-occupant Loans on Number Average Value Number Average Value Number Average Value
LOANS ORIGINATED 41 $303,576 11 $264,440 0 $0 APPLICATIONS APPROVED, NOT ACCEPTED 29 $282,809 14 $288,822 1 $279,830 APPLICATIONS DENIED 1 $334,230 0 $0 0 $0 APPLICATIONS WITHDRAWN 5 $255,180 3 $276,540 0 $0 FILES CLOSED FOR INCOMPLETENESS 0 $0 1 $207,060 0 $0
Aggregated Statistics For Year 2002(Based on 5 full and 4 partial tracts) A) Conventional B) Refinancings C) Non-occupant Loans on Number Average Value Number Average Value Number Average Value
LOANS ORIGINATED 42 $250,036 19 $239,416 1 $239,000 APPLICATIONS APPROVED, NOT ACCEPTED 17 $227,791 15 $210,179 0 $0 APPLICATIONS DENIED 4 $250,068 1 $148,470 0 $0 APPLICATIONS WITHDRAWN 3 $246,100 4 $244,418 0 $0 FILES CLOSED FOR INCOMPLETENESS 0 $0 0 $0 0 $0
Aggregated Statistics For Year 2001(Based on 5 full and 5 partial tracts) A) Conventional B) Refinancings Number Average Value Number Average Value
LOANS ORIGINATED 74 $226,038 33 $220,026 APPLICATIONS APPROVED, NOT ACCEPTED 15 $226,967 11 $215,597 APPLICATIONS DENIED 2 $246,890 3 $294,393 APPLICATIONS WITHDRAWN 1 $202,530 0 $0 FILES CLOSED FOR INCOMPLETENESS 0 $0 0 $0
Aggregated Statistics For Year 2000(Based on 5 full and 4 partial tracts) A) Conventional B) Refinancings C) Non-occupant Loans on Number Average Value Number Average Value Number Average Value
LOANS ORIGINATED 62 $200,389 15 $216,942 5 $159,442 APPLICATIONS APPROVED, NOT ACCEPTED 11 $206,498 4 $248,550 1 $262,810 APPLICATIONS DENIED 5 $186,082 1 $207,520 0 $0 APPLICATIONS WITHDRAWN 2 $194,500 0 $0 0 $0 FILES CLOSED FOR INCOMPLETENESS 1 $187,000 0 $0 0 $0
Aggregated Statistics For Year 1999(Based on 6 full and 4 partial tracts) A) Conventional B) Refinancings C) Non-occupant Loans on Number Average Value Number Average Value Number Average Value
LOANS ORIGINATED 71 $200,441 30 $202,989 2 $228,850 APPLICATIONS APPROVED, NOT ACCEPTED 5 $157,876 14 $196,831 0 $0 APPLICATIONS DENIED 8 $176,391 1 $218,580 0 $0 APPLICATIONS WITHDRAWN 2 $191,900 3 $210,460 0 $0 FILES CLOSED FOR INCOMPLETENESS 1 $97,550 0 $0 0 $0
Most common first names in Temple City, CA among deceased individuals Name Count Lived (average)
Mary 238 82.1 years John 233 76.0 years William 158 74.9 years Robert 151 73.6 years Helen 125 80.1 years Charles 124 75.6 years James 119 76.7 years George 117 79.1 years Joseph 110 76.2 years Margaret 108 82.0 years
Most common last names in Temple City, CA among deceased individuals Last name Count Lived (average)
Smith 81 80.9 years Miller 61 78.1 years Brown 50 77.7 years Johnson 50 81.2 years Anderson 40 78.7 years Williams 33 78.1 years Jones 31 81.2 years Davis 30 76.4 years Clark 29 81.5 years Thompson 27 77.5 years
Temple City compared to California state average:
Unemployed percentage significantly below state average. Black race population percentage significantly below state average. Hispanic race population percentage below state average. Median age significantly above state average. Foreign-born population percentage above state average. Length of stay since moving in significantly above state average. Percentage of population with a bachelor's degree or higher above state average. Temple City on our top lists :
#4 on the list of "Top 101 cities with the most residents born in China (population 500+)"
#7 on the list of "Top 101 cities with the most residents born in Eastern Asia (population 500+)"
#8 on the list of "Top 101 cities with the most residents born in China, excluding Hong Kong and Taiwan (population 500+)"
#8 on the list of "Top 101 cities with the most residents born in Hong Kong (population 500+)"
#8 on the list of "Top 101 cities with the most residents born in Taiwan (population 500+)"
#22 on the list of "Top 101 cities with the most residents born in Asia (population 500+)"
#38 on the list of "Top 101 cities with the most residents born in Vietnam (population 500+)"
#47 on the list of "Top 101 cities with the most residents born in Indonesia (population 500+)"
#49 on the list of "Top 101 cities with largest percentage of females in industries: wholesale trade (population 5,000+)"
#71 on the list of "Top 101 cities with the most residents born in Malaysia (population 500+)"
#79 on the list of "Top 100 cities with highest percentage of foreign-born residents (pop. 5,000+)"
#95 on the list of "Top 100 cities with highest ratio of median house value to median household income (pop. 5,000+)"
#1 on the list of "Top 101 counties with the most Evangelical Protestant congregations"
#1 on the list of "Top 101 counties with the most Mainline Protestant congregations"
#1 on the list of "Top 101 counties with the most Orthodox adherents"
#1 on the list of "Top 101 counties with the highest ground withdrawal of fresh water for public supply (pop. 50,000+)"
#1 on the list of "Top 101 counties with the most Catholic adherents (pop. 50,000+)"
Top Patent Applicants
Yibing Michelle Wang (26)
Yibing M. Wang (10)
Jeng-Hong Chen (10)
Lingyu Dong (9)
Kenneth Truong (8)
Yi-Hung Chiao (8)
Erik Weiking Pong (8)
Hong Zhong (7)
Joey Chih-Wei Huang (6)
Mario Blanco (6)
Total of 297 patent applications in 2008-2024.
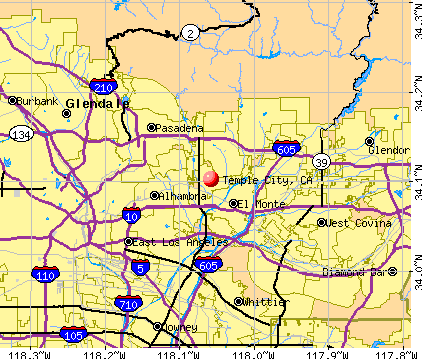


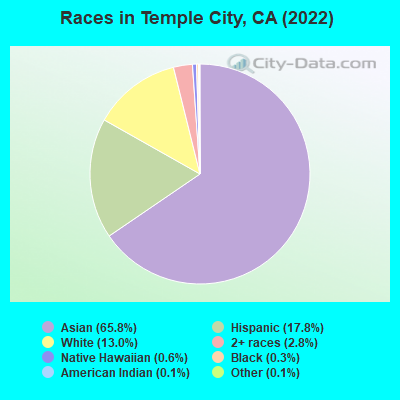
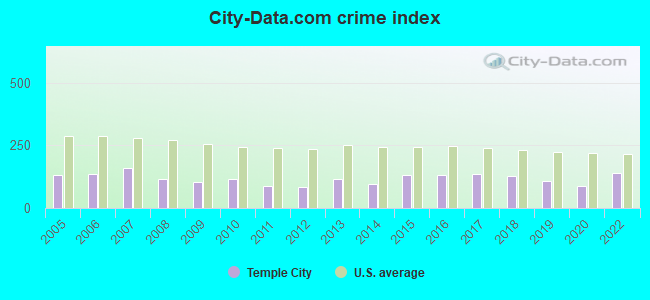
 Recent articles from our blog. Our writers, many of them Ph.D. graduates or candidates, create easy-to-read articles on a wide variety of topics.

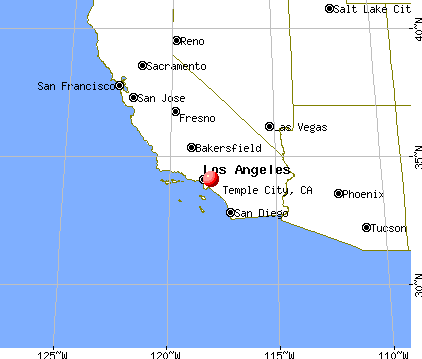
 , pop. 320,969).
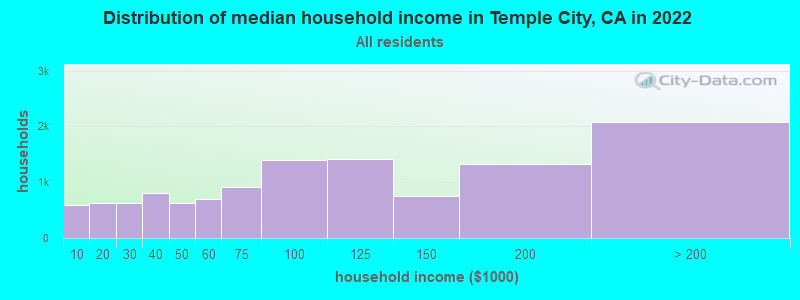
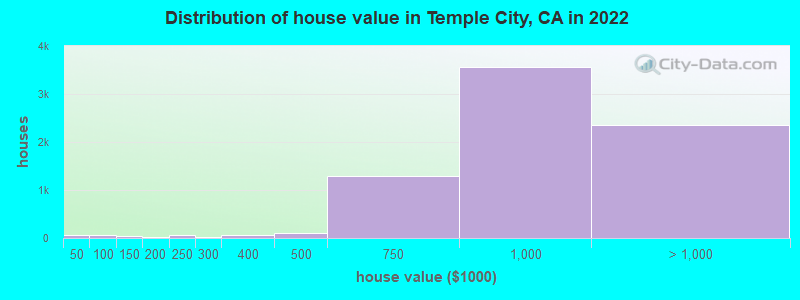
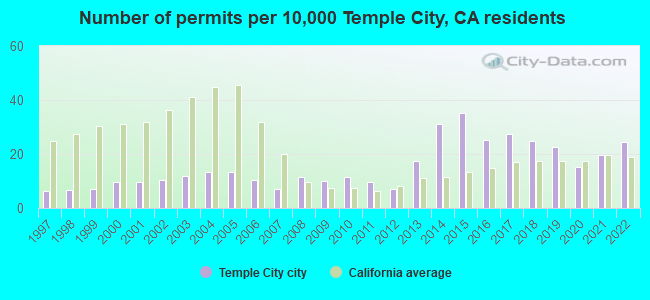
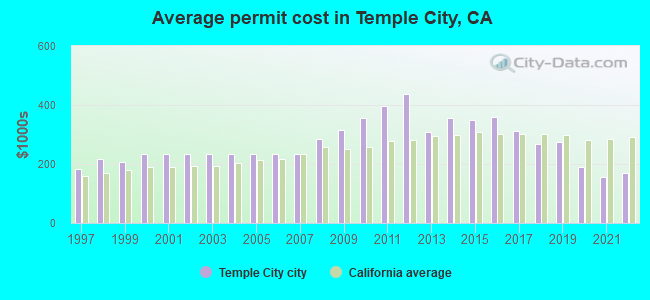
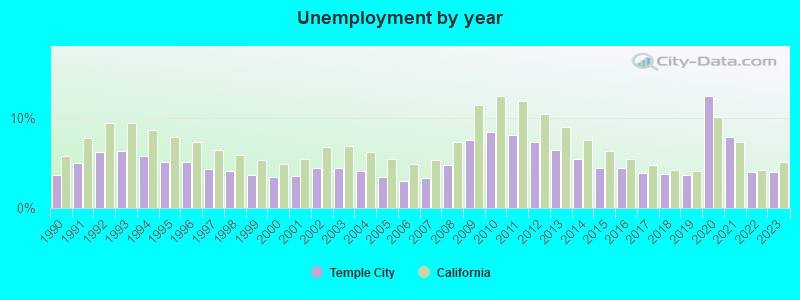
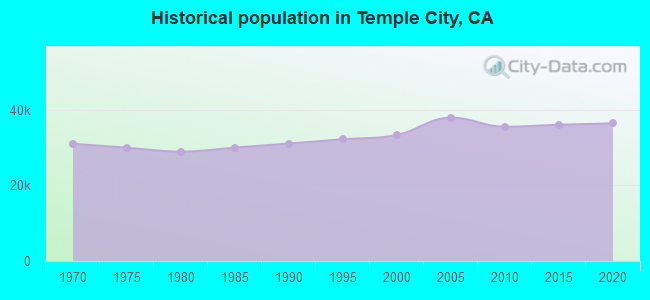
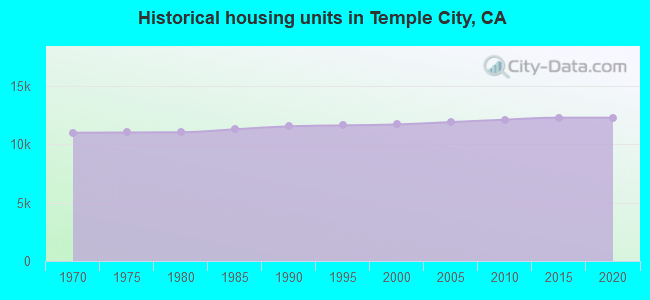
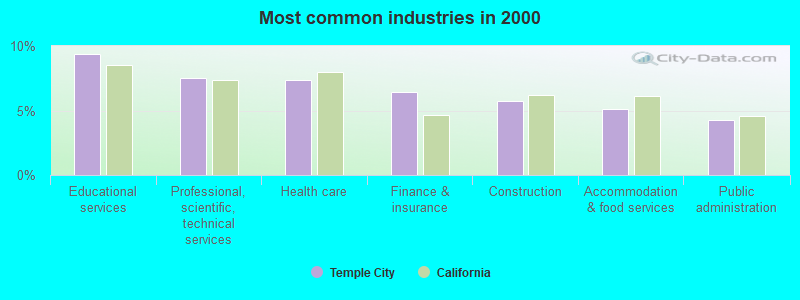
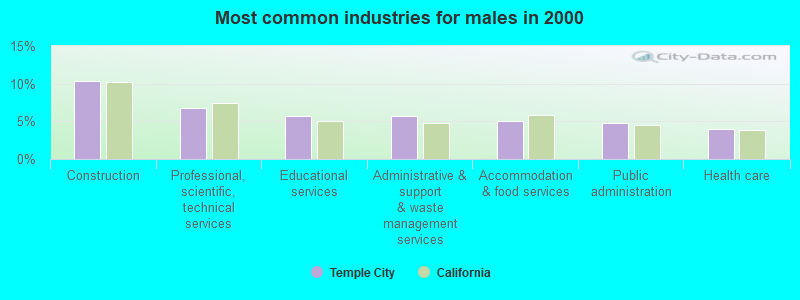
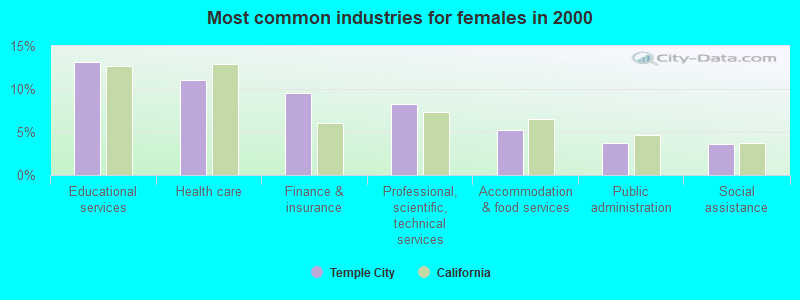
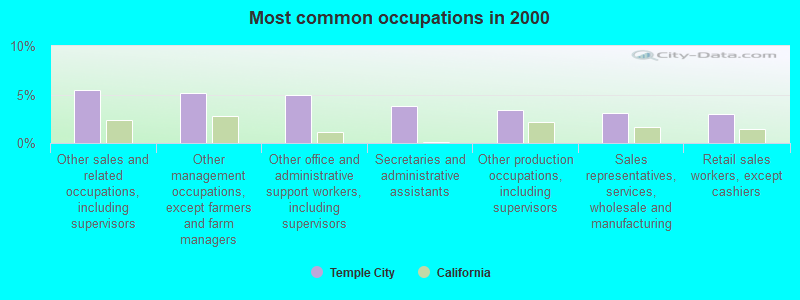
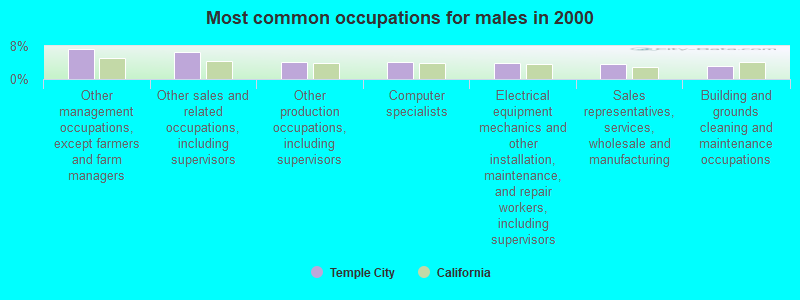
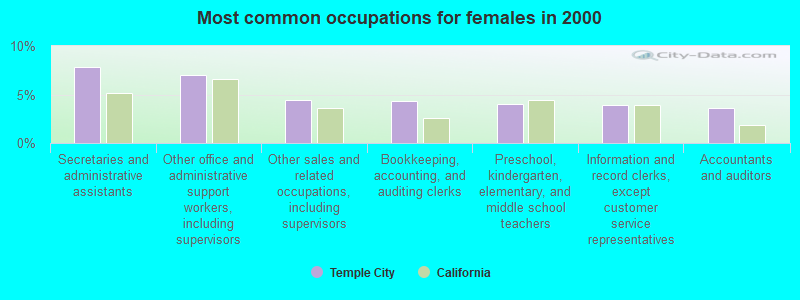
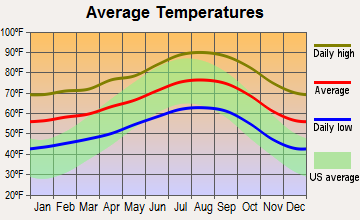
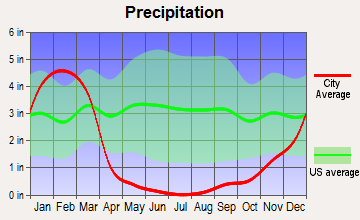
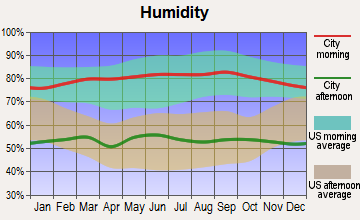
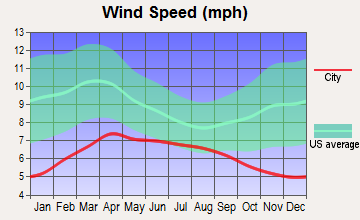
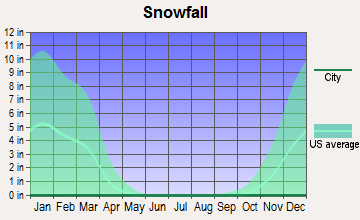
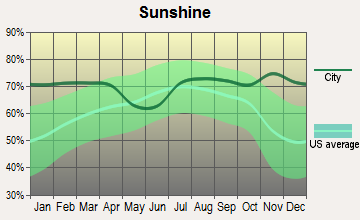
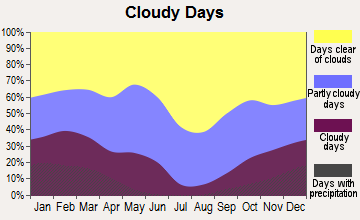


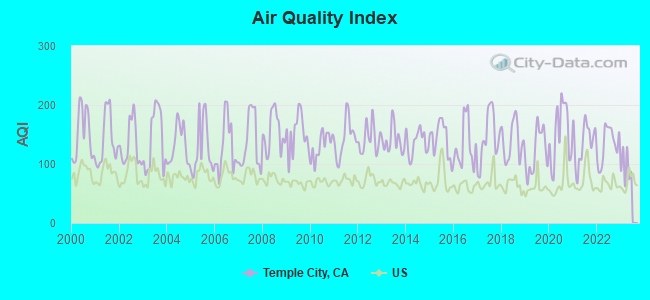
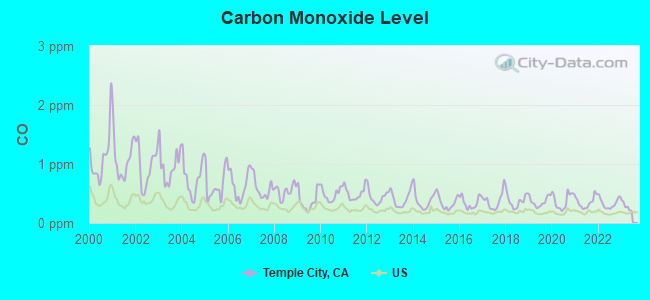
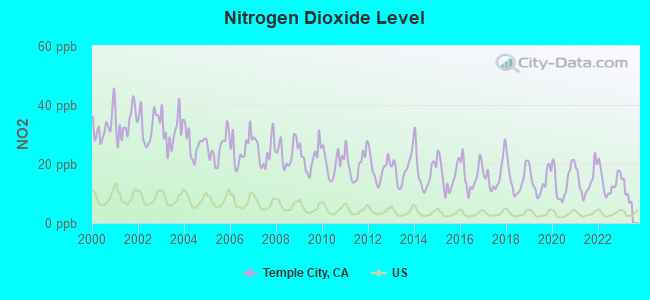
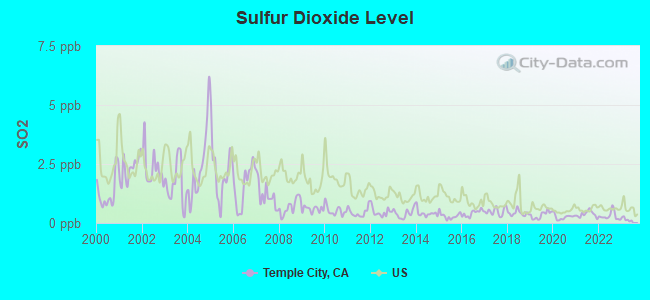
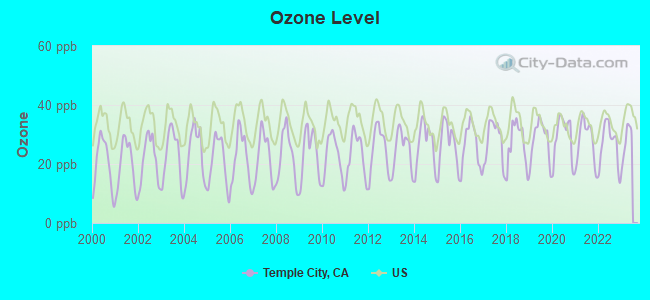
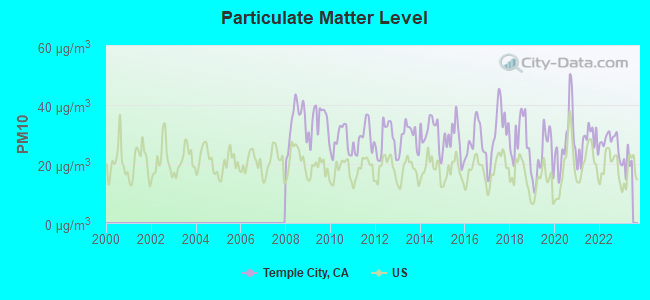
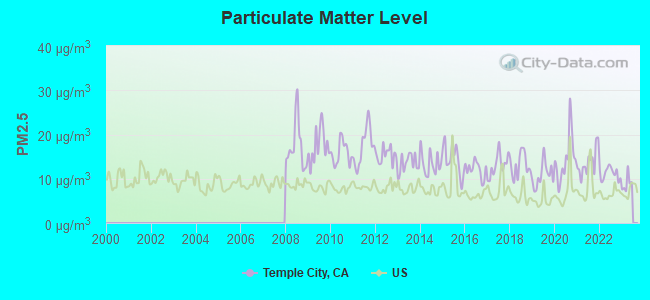
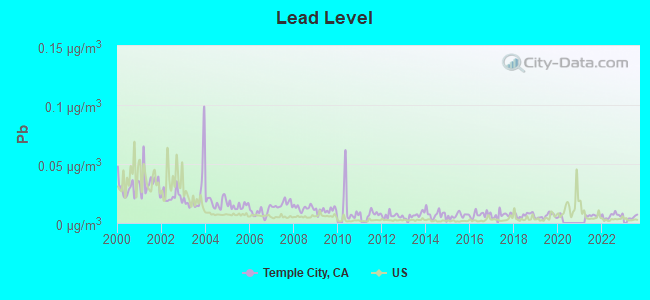

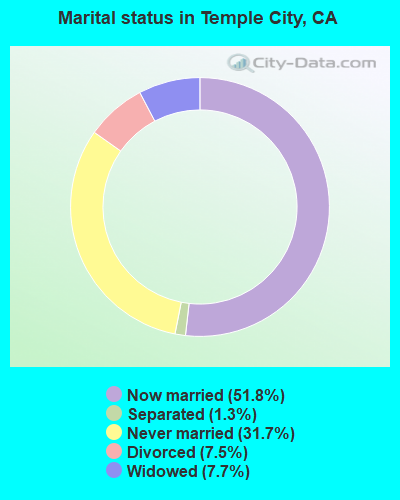
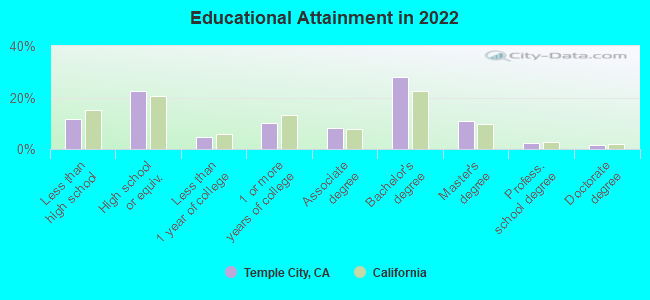
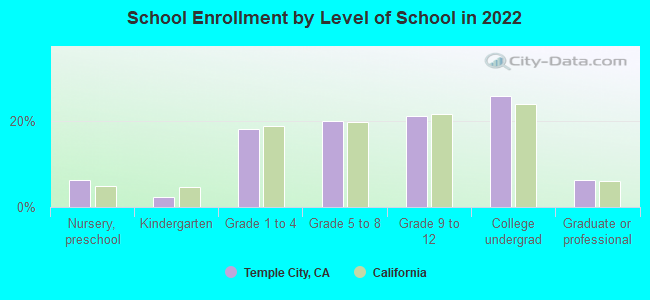
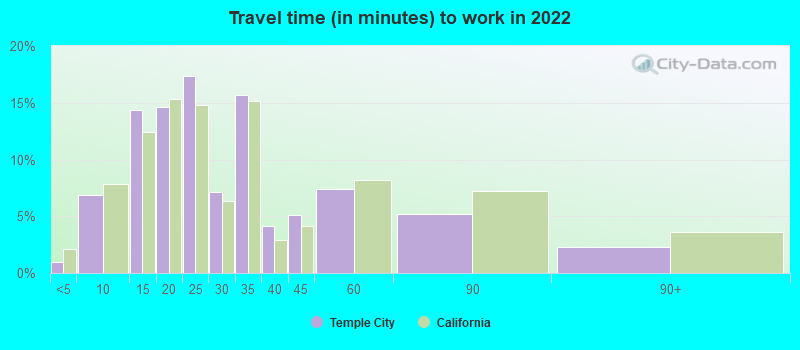
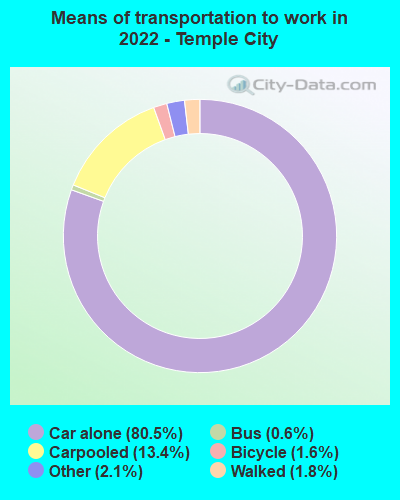


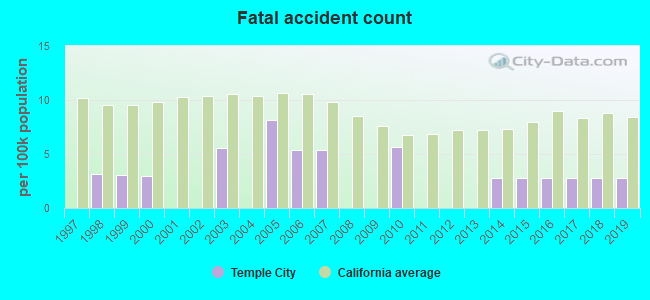
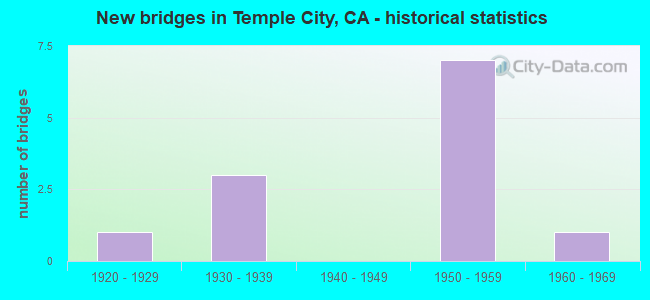
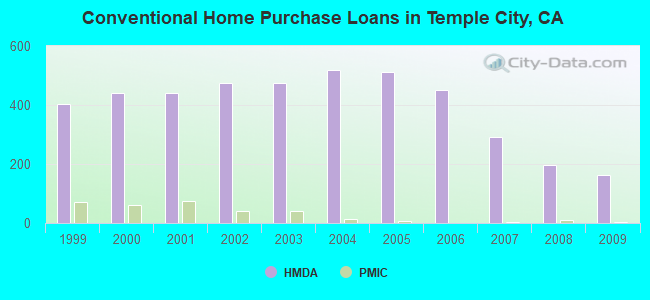
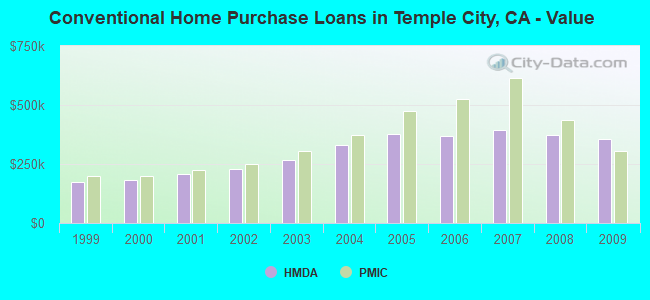
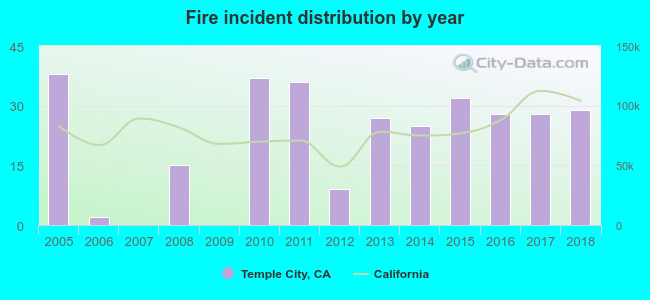 Based on the data from the years 2005 - 2018 the average number of fires per year is 22. The highest number of reported fire incidents - 38 took place in 2005, and the least - 0 in 2007. The data has a declining trend.
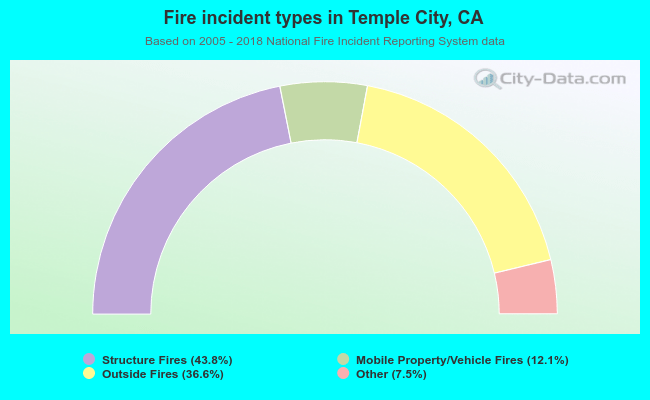 When looking into fire subcategories, the most incidents belonged to: Structure Fires (43.8%), and Outside Fires (36.6%).