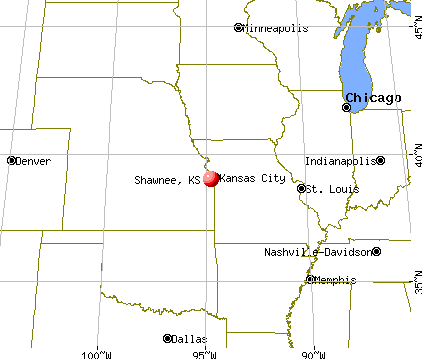
Shawnee, Kansas
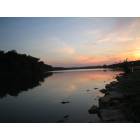
Shawnee: shwanee mission lake

Shawnee: Midwest Spring Weather, Shawnee, Kansas
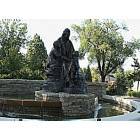
Shawnee: Chief Charles Bluejacket Fountain
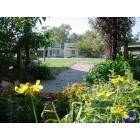
Shawnee: Old Shawnee Town is just one of Shawnee's attractions. This is a picture from one of the little gardens that they have in Old Shawnee Town. This recreated old town is a great place to take a look into the past. They offer field trips and special events throughout the year.
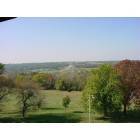
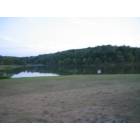
Shawnee: This is a picture from the Shawnee Mission Park Tower of Western Shawnee. The trees are just starting to turn!

Shawnee: Garrett Park in Western Shawnee This is a great little park in western Shawnee. It's located off of 47th street and Monticello Road. A great place for kids to play and families to enjoy!
Shawnee: shwanee mission park
Shawnee: Shawnee City Hall
- add
your
Submit your own pictures of this city and show them to the world
- OSM Map
- General Map
- Google Map
- MSN Map

Population change since 2000: +44.2%
| Males: 34,538 | |
| Females: 34,660 |
| Median resident age: | 37.4 years |
| Kansas median age: | 37.6 years |
Zip codes: 66218.
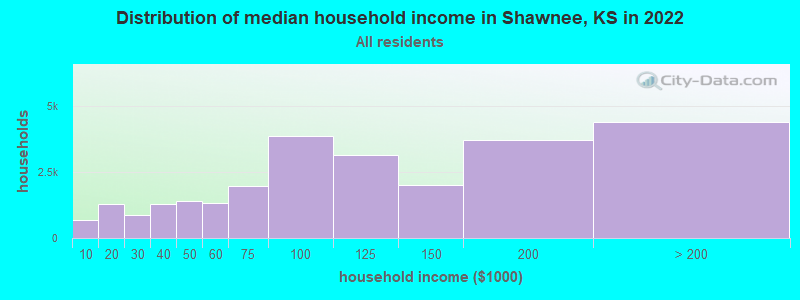
| Shawnee: | $101,063 |
| KS: | $68,925 |
Estimated per capita income in 2022: $49,868 (it was $28,142 in 2000)
Shawnee city income, earnings, and wages data
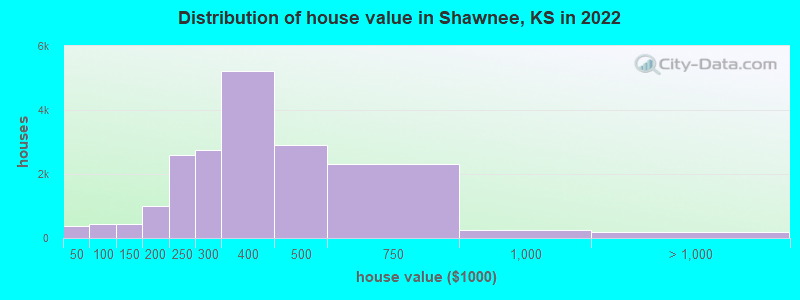
Estimated median house or condo value in 2022: $350,500 (it was $141,100 in 2000)
| Shawnee: | $350,500 |
| KS: | $206,600 |
Mean prices in 2022: all housing units: $359,595; detached houses: $370,932; townhouses or other attached units: $239,726; in 2-unit structures: $94,697; in 3-to-4-unit structures: $134,554; in 5-or-more-unit structures: $109,554; mobile homes: $163,279
Median gross rent in 2022: $1,183.
(3.1% for White Non-Hispanic residents, 26.0% for Black residents, 9.2% for Hispanic or Latino residents, 66.7% for American Indian residents, 33.3% for Native Hawaiian and other Pacific Islander residents, 13.9% for other race residents, 9.3% for two or more races residents)
Detailed information about poverty and poor residents in Shawnee, KS


Compare current foreclosures in Shawnee, KS:
| Photo | Address | Area | Beds / Baths | Price | Details |
|---|---|---|---|---|---|

|
#1
Walker St
Shawnee, KS 66218
|
2,085 sq. feet
|
2 baths 3 beds |
show details | |

|
#2
Charlotte St
Shawnee, KS 66216
|
1,622 sq. feet
|
2 baths 3 beds |
show details | |

|
#3
Nieman Rd
Shawnee, KS 66203
|
960 sq. feet
|
1 baths 3 beds |
show details | |

|
#4
W 61st St
Shawnee, KS 66216
|
1,418 sq. feet
|
2 baths 4 beds |
show details | |

|
#5
Noland Rd
Shawnee, KS 66216
|
1,292 sq. feet
|
2 baths 3 beds |
show details | |

|
#6
W 53rd St
Shawnee, KS 66226
|
1,886 sq. feet
|
2 baths 3 beds |
show details | |

|
#7
Clare Rd
Shawnee, KS 66226
|
2,388 sq. feet
|
2 baths 3 beds |
show details | |

|
#8
Anderson St
Shawnee, KS 66226
|
2,292 sq. feet
|
2 baths 4 beds |
show details | |

|
#9
W 72nd Ter
Shawnee, KS 66216
|
1,288 sq. feet
|
3 baths 4 beds |
show details | |

|
#10
Switzer St
Shawnee, KS 66203
|
1,508 sq. feet
|
2 baths 3 beds |
show details |
| Photo | Address | Area | Beds / Baths | Price | Details |
|---|---|---|---|---|---|

|
#11
W 53rd St
Shawnee, KS 66226
|
2,562 sq. feet
|
3 baths 4 beds |
show details | |

|
#12
Monrovia St
Shawnee, KS 66216
|
1,802 sq. feet
|
2 baths 3 beds |
show details | |

|
#13
Melrose Ln
Shawnee, KS 66203
|
1,785 sq. feet
|
2 baths 3 beds |
show details | |

|
#14
W 64th St
Shawnee, KS 66203
|
720 sq. feet
|
1 baths 2 beds |
show details | |

|
#15
W 52nd St
Shawnee, KS 66216
|
1,116 sq. feet
|
1 baths 3 beds |
show details | |

|
#16
Oakview Ln
Shawnee, KS 66216
|
2,747 sq. feet
|
3 baths 4 beds |
show details | |

|
#17
Caenen St
Shawnee, KS 66216
|
1,536 sq. feet
|
2 baths 4 beds |
show details | |

|
#18
Farley Ct
Shawnee, KS 66203
|
720 sq. feet
|
1 baths 2 beds |
show details | |

|
#19
Halsey St
Shawnee, KS 66216
|
1,747 sq. feet
|
2 baths 2 beds |
show details | |

|
#20
W 52nd Ter
Shawnee, KS 66203
|
2,561 sq. feet
|
2 baths 5 beds |
show details |
| Photo | Address | Area | Beds / Baths | Price | Details |
|---|---|---|---|---|---|

|
#21
Haskins St
Shawnee, KS 66216
|
1,156 sq. feet
|
1 baths 3 beds |
show details | |

|
#22
Flint Dr
Shawnee, KS 66203
|
1,647 sq. feet
|
1 baths 3 beds |
show details | |

|
#23
Circle Dr
Shawnee, KS 66216
|
753 sq. feet
|
1 baths 2 beds |
show details | |

|
#24
W 47th Ct
Shawnee, KS 66218
|
2,159 sq. feet
|
2 baths 4 beds |
show details | |

|
#25
Bradshaw St
Shawnee, KS 66216
|
1,137 sq. feet
|
2 baths 3 beds |
show details | |

|
#26
Maurer Rd
Shawnee, KS 66217
|
4,378 sq. feet
|
4 baths 4 beds |
show details | |

|
#27
Noble St
Shawnee, KS 66226
|
2,860 sq. feet
|
3 baths 4 beds |
show details | |

|
#28
Caenen St
Shawnee, KS 66216
|
1,518 sq. feet
|
2 baths 3 beds |
show details | |

|
#29
W 69th Ter
Shawnee, KS 66216
|
1,427 sq. feet
|
2 baths 3 beds |
show details | |

|
#30
W 45th St
Shawnee, KS 66226
|
2,660 sq. feet
|
3 baths 4 beds |
show details |
| Photo | Address | Area | Beds / Baths | Price | Details |
|---|---|---|---|---|---|

|
#31
Brownridge Dr
Shawnee, KS 66218
|
1,896 sq. feet
|
2 baths 3 beds |
show details | |

|
#32
W 50th Ter
Shawnee, KS 66203
|
1,506 sq. feet
|
3 baths 3 beds |
show details | |

|
#33
Queal Dr
Shawnee, KS 66203
|
2,290 sq. feet
|
2 baths 4 beds |
show details | |

|
#34
W 51st Ter
Shawnee, KS 66226
|
2,233 sq. feet
|
2 baths 3 beds |
show details | |

|
#35
W 54th St
Shawnee, KS 66203
|
2,213 sq. feet
|
3 baths 4 beds |
show details | |

|
#36
Lucille Ln
Shawnee, KS 66203
|
1,248 sq. feet
|
2 baths 3 beds |
show details | |

|
#37
W 52nd St
Shawnee, KS 66203
|
960 sq. feet
|
2 baths 2 beds |
show details | |

|
#38
Bradshaw St
Shawnee, KS 66216
|
1,432 sq. feet
|
2 baths 3 beds |
show details | |

|
#39
Old K 7 Hwy
Shawnee, KS 66226
|
- sq. feet
|
- baths - beds |
show details | |

|
#40
England St
Shawnee, KS 66203
|
- sq. feet
|
- baths - beds |
show details |
| Photo | Address | Area | Beds / Baths | Price | Details |
|---|---|---|---|---|---|

|
#41
W 44th Ter
Shawnee, KS 66226
|
- sq. feet
|
- baths - beds |
show details | |

|
#42
W 70th Ter Apt 102
Shawnee, KS 66203
|
- sq. feet
|
- baths - beds |
show details | |

|
#43
Hedge Lane Ter Apt 201
Shawnee, KS 66226
|
- sq. feet
|
- baths - beds |
show details | |

|
#44
W 49th Ter
Shawnee, KS 66216
|
- sq. feet
|
- baths - beds |
show details | |

|
#45
Hedge Lane Ter Apt 101
Shawnee, KS 66226
|
- sq. feet
|
- baths - beds |
show details | |

|
#46
Hedge Lane Ter Apt 102
Shawnee, KS 66226
|
- sq. feet
|
- baths - beds |
show details | |

|
#47
Hedge Lane Ter Apt 102
Shawnee, KS 66226
|
- sq. feet
|
- baths - beds |
show details | |

|
#48
W 60th St Apt D
Shawnee, KS 66203
|
- sq. feet
|
- baths - beds |
show details | |

|
#49
W 65th Ter Apt 203
Shawnee, KS 66203
|
- sq. feet
|
- baths - beds |
show details | |

|
Check over 1 million property listings on Foreclosure.com!
|
browse all offers | |||


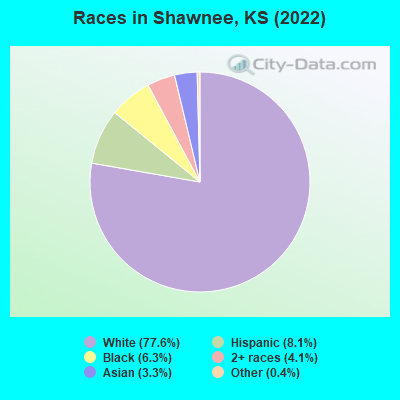
- 53,23277.6%White alone
- 5,5918.1%Hispanic
- 4,3006.3%Black alone
- 2,8164.1%Two or more races
- 2,2773.3%Asian alone
- 2410.4%Other race alone
- 140.02%American Indian alone
- 100.01%Native Hawaiian and Other
Pacific Islander alone
Races in Shawnee detailed stats: ancestries, foreign born residents, place of birth
According to our research of Kansas and other state lists, there were 81 registered sex offenders living in Shawnee, Kansas as of May 23, 2024.
The ratio of all residents to sex offenders in Shawnee is 812 to 1.
The ratio of registered sex offenders to all residents in this city is much lower than the state average.
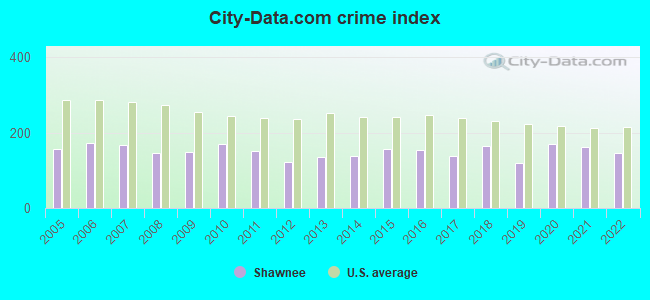
The City-Data.com crime index weighs serious crimes and violent crimes more heavily. Higher means more crime, U.S. average is 246.1. It adjusts for the number of visitors and daily workers commuting into cities.
- means the value is smaller than the state average.- means the value is about the same as the state average.
- means the value is bigger than the state average.
Crime rate in Shawnee detailed stats: murders, rapes, robberies, assaults, burglaries, thefts, arson
Full-time law enforcement employees in 2021, including police officers: 112 (90 officers - 74 male; 16 female).
| Officers per 1,000 residents here: | 1.35 |
| Kansas average: | 2.70 |
 Recent articles from our blog. Our writers, many of them Ph.D. graduates or candidates, create easy-to-read articles on a wide variety of topics.

 | Why do people hate Topeka? (41 replies) |
| What to expect as a single, POC guy? (42 replies) |
| The Honorable Governor Part Two (17 replies) |
| Kansas gubernatorial election, 2018 (26 candidates so far) (89 replies) |
| Vermont, Oklahoma and Now Topeka, Kan., Want You (14 replies) |
| Kansas Job Losses (390 replies) |
Latest news from Shawnee, KS collected exclusively by city-data.com from local newspapers, TV, and radio stations
Ancestries: German (19.4%), English (11.0%), American (6.8%), Irish (5.7%), European (5.5%), Ethiopian (1.8%).
Current Local Time: CST time zone
Incorporated in 1922
Elevation: 1000 feet
Land area: 41.7 square miles.
Population density: 1,658 people per square mile (low).
5,132 residents are foreign born (2.5% Asia, 2.3% Latin America, 1.7% Africa, 0.9% Europe).
| This city: | 7.5% |
| Kansas: | 7.1% |
Median real estate property taxes paid for housing units with mortgages in 2022: $3,685 (1.0%)
Median real estate property taxes paid for housing units with no mortgage in 2022: $3,774 (1.1%)
Nearest city with pop. 50,000+: Overland Park, KS  (6.8 miles , pop. 149,080).
Nearest city with pop. 200,000+: Kansas City, MO (12.1 miles , pop. 441,545).
Nearest city with pop. 1,000,000+: Chicago, IL (421.1 miles , pop. 2,896,016).
Nearest cities:
), ), Latitude: 39.01 N, Longitude: 94.77 W
Daytime population change due to commuting: -13,738 (-19.8%)
Workers who live and work in this city: 11,225 (29.3%)
Property values in Shawnee, KS

Shawnee tourist attractions:
Shawnee, Kansas accommodation & food services, waste management - Economy and Business Data
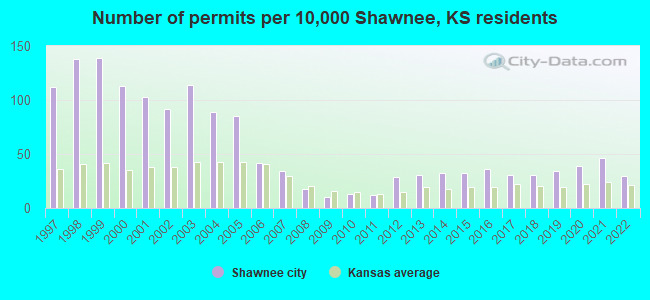
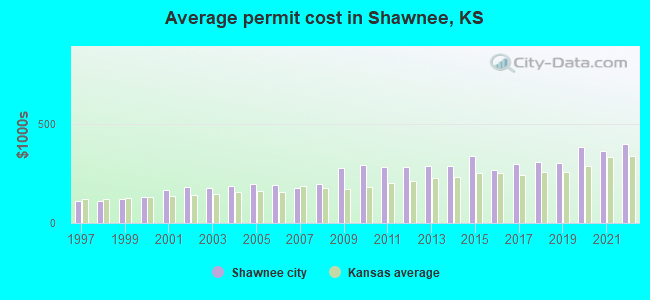
Single-family new house construction building permits:
- 2022: 145 buildings, average cost: $398,500
- 2021: 219 buildings, average cost: $366,200
- 2020: 187 buildings, average cost: $383,500
- 2019: 165 buildings, average cost: $304,500
- 2018: 147 buildings, average cost: $310,400
- 2017: 151 buildings, average cost: $299,900
- 2016: 172 buildings, average cost: $268,100
- 2015: 155 buildings, average cost: $340,500
- 2014: 154 buildings, average cost: $288,100
- 2013: 151 buildings, average cost: $286,800
- 2012: 138 buildings, average cost: $283,800
- 2011: 58 buildings, average cost: $283,200
- 2010: 64 buildings, average cost: $293,100
- 2009: 50 buildings, average cost: $279,000
- 2008: 84 buildings, average cost: $198,200
- 2007: 163 buildings, average cost: $179,000
- 2006: 201 buildings, average cost: $194,100
- 2005: 410 buildings, average cost: $196,100
- 2004: 426 buildings, average cost: $188,600
- 2003: 545 buildings, average cost: $176,300
- 2002: 441 buildings, average cost: $180,600
- 2001: 495 buildings, average cost: $164,800
- 2000: 541 buildings, average cost: $132,300
- 1999: 669 buildings, average cost: $120,500
- 1998: 663 buildings, average cost: $110,400
- 1997: 537 buildings, average cost: $112,100
| Here: | 1.8% |
| Kansas: | 2.0% |
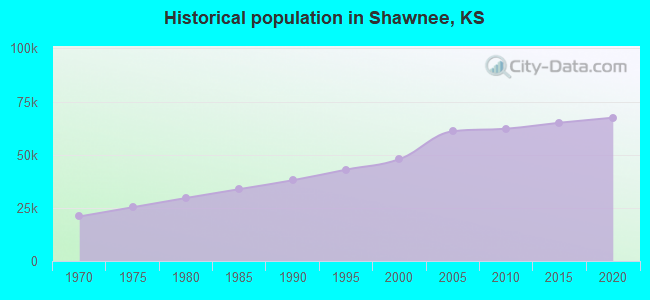
Population change in the 1990s: +9,874 (+25.9%).
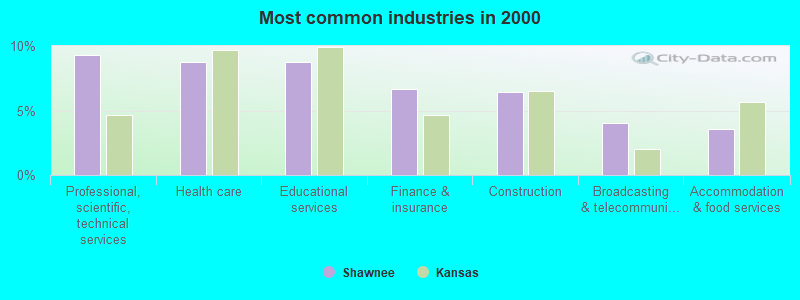
- Professional, scientific, technical services (9.3%)
- Health care (8.8%)
- Educational services (8.7%)
- Finance & insurance (6.7%)
- Construction (6.4%)
- Broadcasting & telecommunications (4.1%)
- Accommodation & food services (3.5%)
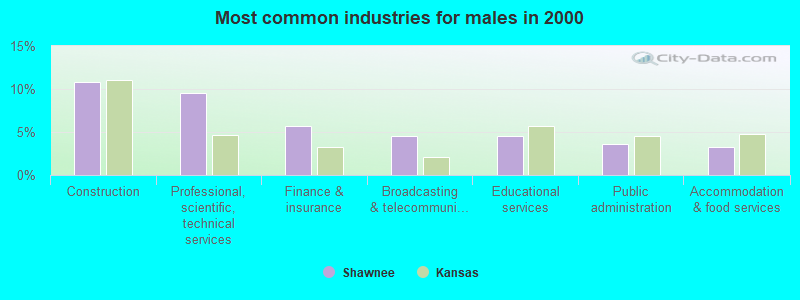
- Construction (10.8%)
- Professional, scientific, technical services (9.6%)
- Finance & insurance (5.7%)
- Broadcasting & telecommunications (4.6%)
- Educational services (4.6%)
- Public administration (3.6%)
- Accommodation & food services (3.2%)
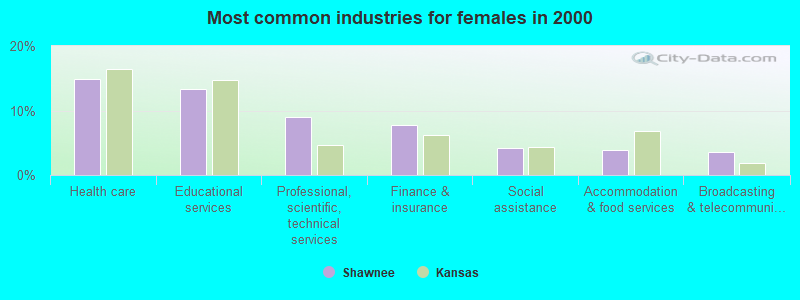
- Health care (15.0%)
- Educational services (13.4%)
- Professional, scientific, technical services (9.0%)
- Finance & insurance (7.8%)
- Social assistance (4.2%)
- Accommodation & food services (3.9%)
- Broadcasting & telecommunications (3.5%)
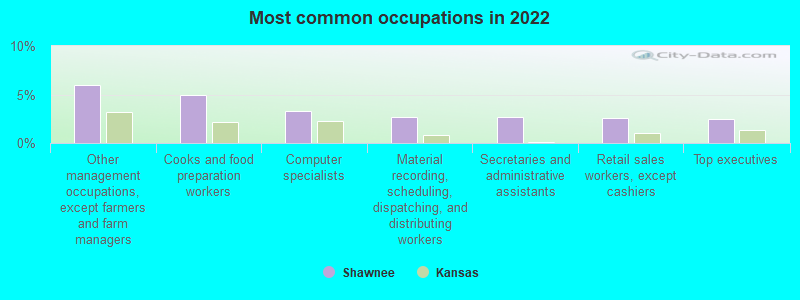
- Other management occupations, except farmers and farm managers (6.0%)
- Cooks and food preparation workers (4.9%)
- Computer specialists (3.3%)
- Material recording, scheduling, dispatching, and distributing workers (2.7%)
- Secretaries and administrative assistants (2.7%)
- Retail sales workers, except cashiers (2.6%)
- Top executives (2.5%)
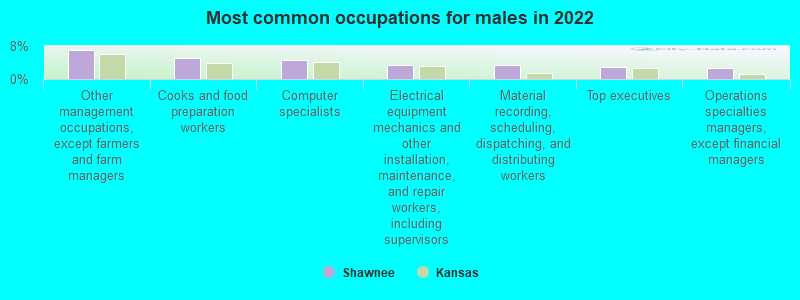
- Other management occupations, except farmers and farm managers (7.0%)
- Cooks and food preparation workers (5.1%)
- Computer specialists (4.5%)
- Electrical equipment mechanics and other installation, maintenance, and repair workers, including supervisors (3.5%)
- Material recording, scheduling, dispatching, and distributing workers (3.4%)
- Top executives (3.0%)
- Operations specialties managers, except financial managers (2.6%)
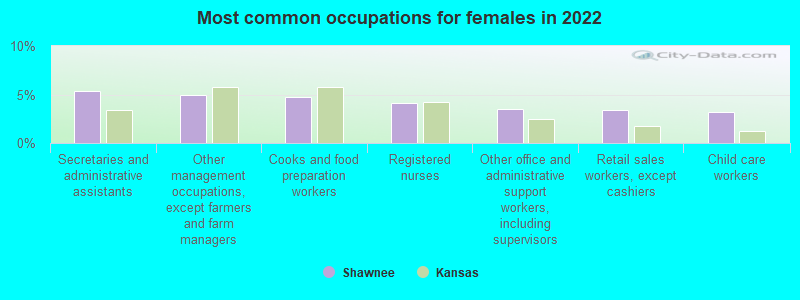
- Secretaries and administrative assistants (5.4%)
- Other management occupations, except farmers and farm managers (4.9%)
- Cooks and food preparation workers (4.8%)
- Registered nurses (4.2%)
- Other office and administrative support workers, including supervisors (3.5%)
- Retail sales workers, except cashiers (3.4%)
- Child care workers (3.2%)
Average climate in Shawnee, Kansas
Based on data reported by over 4,000 weather stations


|
|


(lower is better)
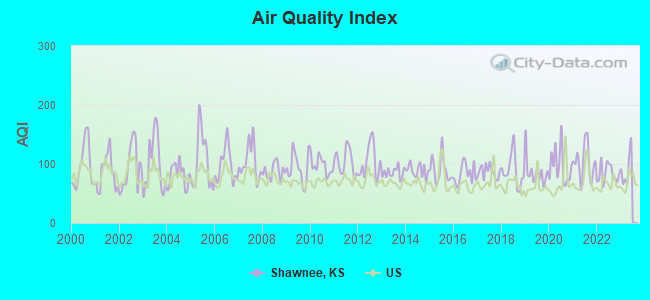
Air Quality Index (AQI) level in 2022 was 83.6. This is about average.
| City: | 83.6 |
| U.S.: | 72.6 |
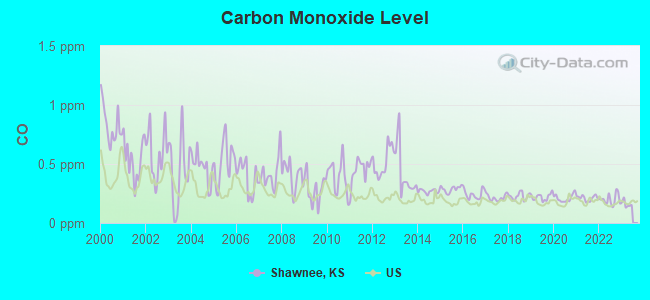
Carbon Monoxide (CO) [ppm] level in 2022 was 0.200. This is better than average. Closest monitor was 5.4 miles away from the city center.
| City: | 0.200 |
| U.S.: | 0.251 |
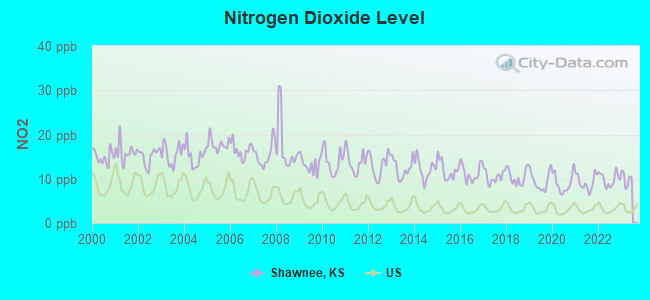
Nitrogen Dioxide (NO2) [ppb] level in 2022 was 9.85. This is significantly worse than average. Closest monitor was 5.7 miles away from the city center.
| City: | 9.85 |
| U.S.: | 5.11 |
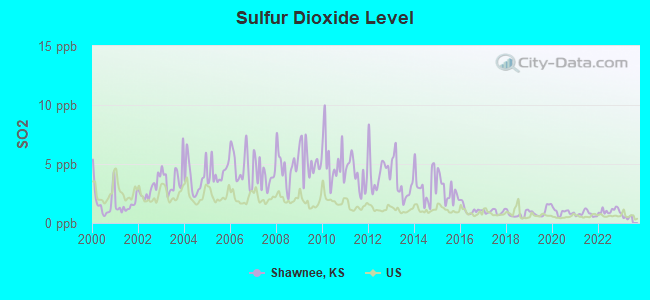
Sulfur Dioxide (SO2) [ppb] level in 2022 was 1.04. This is significantly better than average. Closest monitor was 5.7 miles away from the city center.
| City: | 1.04 |
| U.S.: | 1.51 |
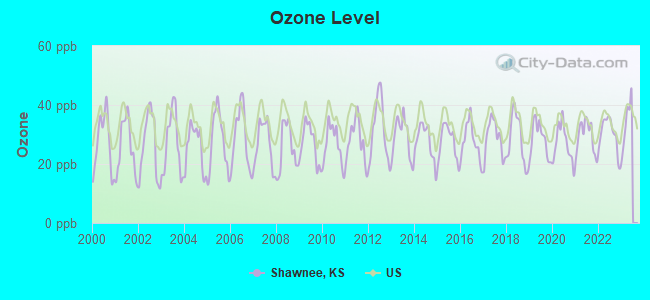
Ozone [ppb] level in 2022 was 30.1. This is about average. Closest monitor was 9.6 miles away from the city center.
| City: | 30.1 |
| U.S.: | 33.3 |
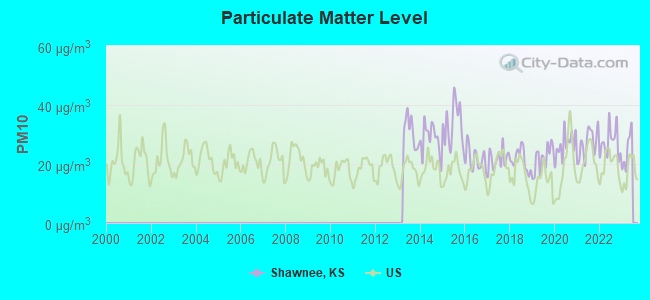
Particulate Matter (PM10) [µg/m3] level in 2022 was 27.2. This is significantly worse than average. Closest monitor was 5.0 miles away from the city center.
| City: | 27.2 |
| U.S.: | 19.2 |
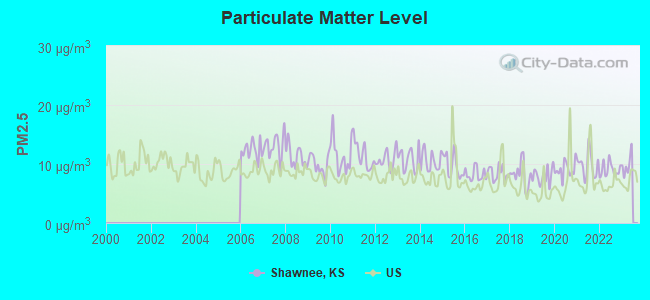
Particulate Matter (PM2.5) [µg/m3] level in 2022 was 9.02. This is about average. Closest monitor was 4.5 miles away from the city center.
| City: | 9.02 |
| U.S.: | 8.11 |
Tornado activity:
Shawnee-area historical tornado activity is near Kansas state average. It is 106% greater than the overall U.S. average.
On 5/20/1957, a category F5 (max. wind speeds 261-318 mph) tornado 19.8 miles away from the Shawnee city center killed 44 people and injured 207 people and caused between $500,000 and $5,000,000 in damages.
On 5/22/1952, a category F4 (max. wind speeds 207-260 mph) tornado 4.7 miles away from the city center injured 3 people and caused between $50,000 and $500,000 in damages.
Earthquake activity:
Shawnee-area historical earthquake activity is significantly above Kansas state average. It is 517% greater than the overall U.S. average.On 9/3/2016 at 12:02:44, a magnitude 5.8 (5.8 MW, Depth: 3.5 mi, Class: Moderate, Intensity: VI - VII) earthquake occurred 214.6 miles away from the city center
On 11/6/2011 at 03:53:10, a magnitude 5.7 (5.7 MW, Depth: 3.2 mi) earthquake occurred 264.7 miles away from Shawnee center
On 11/12/2014 at 21:40:00, a magnitude 4.9 (4.9 MW, Depth: 2.5 mi, Class: Light, Intensity: IV - V) earthquake occurred 196.5 miles away from the city center
On 11/7/2016 at 01:44:24, a magnitude 5.0 (5.0 MW, Depth: 2.8 mi) earthquake occurred 237.0 miles away from Shawnee center
On 2/13/2016 at 17:07:06, a magnitude 5.1 (5.1 MW, Depth: 5.2 mi) earthquake occurred 277.4 miles away from Shawnee center
On 1/19/2020 at 19:08:42, a magnitude 4.5 (4.5 MW, Depth: 3.1 mi) earthquake occurred 186.5 miles away from the city center
Magnitude types: moment magnitude (MW)
Natural disasters:
The number of natural disasters in Johnson County (10) is smaller than the US average (15).Major Disasters (Presidential) Declared: 6
Emergencies Declared: 2
Causes of natural disasters: Floods: 6, Storms: 6, Tornadoes: 2, Hurricane: 1, Ice Storm: 1, Wind: 1, Winter Storm: 1, Other: 1 (Note: some incidents may be assigned to more than one category).

Hospitals and medical centers in Shawnee:
Amtrak stations near Shawnee:
- 12 miles: KANSAS CITY (2200 MAIN ST.) . Services: ticket office, fully wheelchair accessible, enclosed waiting area, public restrooms, public payphones, snack bar, free short-term parking, paid long-term parking, call for car rental service, taxi stand, public transit connection.
- 19 miles: INDEPENDENCE (600 S. GRAND AVE.) . Services: free short-term parking, call for taxi service.
Colleges/Universities in Shawnee:
- Central Baptist Theological Seminary (Full-time enrollment: 147; Location: 6601 Monticello Road; Private, not-for-profit; Website: www.cbts.edu; Offers Doctor's degree)
- Academy of Aesthetic Arts (Full-time enrollment: 31; Location: 10316 Shawnee Mission Parkway; Private, for-profit; Website: www.academyofaestheticarts.com)
Colleges/universities with over 2000 students nearest to Shawnee:
- Johnson County Community College (about 7 miles; Overland Park, KS; Full-time enrollment: 11,976)
- Wright Career College (about 8 miles; Overland Park, KS; FT enrollment: 3,107)
- Kansas City Kansas Community College (about 8 miles; Kansas City, KS; FT enrollment: 4,718)
- MidAmerica Nazarene University (about 10 miles; Olathe, KS; FT enrollment: 2,158)
- Metropolitan Community College-Kansas City (about 11 miles; Kansas City, MO; FT enrollment: 12,834)
- University of Missouri-Kansas City (about 11 miles; Kansas City, MO; FT enrollment: 10,544)
- Rockhurst University (about 11 miles; Kansas City, MO; FT enrollment: 2,013)
Public high school in Shawnee:
- MILL VALLEY HIGH SCHOOL (Students: 932, Location: 5900 MONTICELLO ROAD, Grades: 9-12)
Private high school in Shawnee:
Public elementary/middle schools in Shawnee:
- MONTICELLO TRAILS MIDDLE SCHOOL (Students: 590, Location: 6100 MONTICELLO RD, Grades: 6-8)
- CLEAR CREEK ELEM (Students: 560, Location: 5815 MONTICELLO RD, Grades: KG-5)
- PRAIRIE RIDGE ELEMENTARY SCHOOL (Students: 549, Location: 22405 CLEAR CREEK PARKWAY, Grades: KG-5)
- MIZE ELEMENTARY SCHOOL (Students: 536, Location: 7301 MIZE ROAD, Grades: KG-5)
- RIVERVIEW ELEMENTARY (Students: 531, Location: 21550 WEST 47TH STREET, Grades: KG-5)
- HORIZON ELEMENTARY (Location: 7210 CHOUTEAU, Grades: KG-5)
- BELMONT ELEMENTARY SCHOOL (Location: 5805 BELMONT DR, Grades: PK-5)
Private elementary/middle schools in Shawnee:
- ST JOSEPH CATHOLIC SCHOOL (Students: 543, Location: 11505 JOHNSON DR, Grades: KG-8)
- GOOD SHEPHERD SCHOOL (Students: 369, Location: 12800 W 75TH ST, Grades: KG-8)
- SACRED HEART SCHOOL (Students: 358, Location: 21801 JOHNSON DR, Grades: 1-8)
- HOPE LUTHERAN SCHOOL (Students: 180, Location: 6308 QUIVIRA RD, Grades: KG-8)
- GRACE CHRISTIAN ACADEMY (Students: 22, Location: 7230 QUIVIRA RD, Grades: KG-6)
User-submitted facts and corrections:
- High Schools - Shawnee Mission Northwest, 12701 W 67th St
Points of interest:
Notable locations in Shawnee: Millwood Business Park (A), Holliday Business Park (B), Woodland Acres Industrial Park (C), Camp Towanyak (D), Chapel Creek Golf and Country Club (E), Shawnee Golf and Country Club (F), Vickridge Park (G), Johnson County Mill Creek Regional Water Treatment Facility (H), The Shops at Shawnee (I), Shawnee Parkway Plaza (J), Monrovia Shops (K), Shawnee Business Center (L), Shoppers Park (M), Westglen Center (N), Shawnee Marketplace (O), Woodland Acres Industrial Park (P), K - 7 Industrial Park (Q), Jayhawk Commercial Center (R), Fenton Professional Plaza (S), Continental Business Park (T). Display/hide their locations on the map
Shopping Centers: Stonebridge Shopping Center (1), Monticello Village Shopping Center (2), Millcreek Center Shopping Center (3), Shawnee Crossings Shopping Center (4), Shawnee Station West Shopping Center (5), Nigros 63rd West Shopping Center (6), Alter Ego Center Shopping Center (7), Quivira 63 Shopping Center (8), Woodsonia West Shopping Center (9). Display/hide their locations on the map
Churches in Shawnee include: Saint Lukes Episcopal Church (A), Shawnee Presbyterian Church (B), Monticello United Methodist Church (C), Cross Points Church (D), Holliday Church (E), Monticello Bible Church (F), Trinity Church (G), Trinity Lutheran Church - West Campus (H), Trinity Full Gospel Church (I). Display/hide their locations on the map
Cemeteries: Pleasant View Cemetery (1), Shawnee Indian Cemetery (2), Shawnee Cemetery (3), Monticello Cemetery (4), Shawnee Mission Memory Gardens (5), Union Cemetery (6), Campbell Cemetery (7). Display/hide their locations on the map
Lakes and reservoirs: Shawnee Mission Park Pond (A), Black Swan Lake (B), Elmers Lake (C). Display/hide their locations on the map
Creeks: Mill Creek (A), Clear Creek (B). Display/hide their locations on the map
Parks in Shawnee include: Bluejacket Fountain and Sculpture Plaza (1), Starwood Park (2), Swarner Park (3), Tomahawk Recreation Complex (4), Tomahawk Hills Golf Course (5), Thomas Anthony Soetaert Aquatic Center (6), Blue Jacket Park (7), Shawnee Swimming Pool East (8), Garret Park (9). Display/hide their locations on the map
Tourist attractions: Johnson County Museums - Johnson County Museum of History- 1950'S All Electric Model H (6305 Lackman Road) (1), Libraries Public - Johnson County Libraries- Branch Libraries- Shawnee Lib (Cultural Attractions- Events- & Facilities; 13811 Johnson Drive) (2), Old Shawnee Town (Cultural Attractions- Events- & Facilities; 57th & Cody) (3), Power Play Family Entertainment Center (Amusement & Theme Parks; 13110 West 62nd Terrace) (4), Wonderscope Children's Museum (5705 Flint Street) (5), Fun Services (Arcades & Amusements; 7803 Meadow View Drive) (6), Ultimate Cruise & Vacation (Tours & Charters; 12706 Shawnee Mission Parkway) (7). Display/hide their approximate locations on the map
Hotels: Courtyard by Marriot (17250 Midland Drive) (1), Hampton Inn Kansas City/Shawnee Mission (16555 Midland Drive) (2), Hampton Inn & Suites Kansas City/Merriam (7400 West Frontage Road) (3). Display/hide their approximate locations on the map
Birthplace of: Henri Childs - Player of and football, Jeff Andra - Baseball player, Mike Rivera (American football) - Football player, Shawn Womack - Politician.
| This city: | 2.6 people |
| Kansas: | 2.5 people |
| This city: | 71.4% |
| Whole state: | 66.0% |
| This city: | 5.2% |
| Whole state: | 5.8% |
Likely homosexual households (counted as self-reported same-sex unmarried-partner households)
- Lesbian couples: 0.4% of all households
- Gay men: 0.3% of all households
People in group quarters in Shawnee in 2010:
- 384 people in nursing facilities/skilled-nursing facilities
- 12 people in residential treatment centers for adults
- 7 people in other noninstitutional facilities
- 3 people in group homes intended for adults
People in group quarters in Shawnee in 2000:
- 198 people in nursing homes
- 33 people in homes or halfway houses for drug/alcohol abuse
- 11 people in other group homes
- 5 people in homes for the mentally retarded
Banks with most branches in Shawnee (2011 data):
- BMO Harris Bank National Association: Long Branch, Monticello Branch, Westglen Branch. Info updated 2011/07/14: Bank assets: $97,264.0 mil, Deposits: $75,624.6 mil, headquarters in Chicago, IL, positive income, 717 total offices, Holding Company: Bank Of Montreal
- U.S. Bank National Association: Shawnee Branch, West 66th Price Chopper, West 63rd Street Price Chopper Branc. Info updated 2012/01/30: Bank assets: $330,470.8 mil, Deposits: $236,091.5 mil, headquarters in Cincinnati, OH, positive income, 3121 total offices, Holding Company: U.S. Bancorp
- Capitol Federal Savings Bank: Shawnee Target Branch, Shawnee Branch, Shawnee Crossings Branch. Info updated 2011/07/21: Bank assets: $9,167.4 mil, Deposits: $4,742.9 mil, headquarters in Topeka, KS, positive income, Mortgage Lending Specialization, 46 total offices
- Bank Midwest, National Association: Pflumm Branch # 36, K-7 Midland Drive Branch # 33, Shawnee Living Retirement Center. Info updated 2012/03/19: Bank assets: $6,237.6 mil, Deposits: $5,064.6 mil, headquarters in Kansas City, MO, positive income, 138 total offices, Holding Company: Nbh Holdings Corp.
- Commerce Bank: Nieman Branch, Sm Pkwy & Pflumm Branch, Shawnee Mission Parkway/Monticello B. Info updated 2011/07/07: Bank assets: $20,493.6 mil, Deposits: $16,805.3 mil, headquarters in Kansas City, MO, positive income, 206 total offices, Holding Company: Commerce Bancshares, Inc.
- Brotherhood Bank & Trust: Long Branch at 12500 West 63rd Street, branch established on 1976/06/17; 75th Street And Quivira Road Branch at 11810 W 75th St, branch established on 1973/11/15. Info updated 2007/11/26: Bank assets: $517.0 mil, Deposits: $359.2 mil, headquarters in Kansas City, KS, positive income, Commercial Lending Specialization, 8 total offices, Holding Company: International Brotherhood Of Boilermakers, Iron Ship Builders, Blacksmiths, Forgers And Helpers
- CoreFirst Bank & Trust: 75th & Switzer Branch at 7430 Switzer St, branch established on 2007/12/05. Info updated 2007/10/03: Bank assets: $1,154.4 mil, Deposits: $811.4 mil, headquarters in Topeka, KS, positive income, Commercial Lending Specialization, 35 total offices, Holding Company: Commerce Bank And Trust Holding Company Employee Stock Ownership Plan
- The Mission Bank: Shawnee Station Branch at 15110 West Shawnee Mission Parkway, branch established on 1998/07/01. Info updated 2008/02/19: Bank assets: $555.4 mil, Deposits: $380.7 mil, headquarters in Mission, KS, positive income, Commercial Lending Specialization, 7 total offices, Holding Company: Valley View Bancshares, Inc.
- Bank of the West: Shawnee Branch at 13550 West 63rd Street, branch established on 1995/10/03. Info updated 2009/11/16: Bank assets: $62,408.3 mil, Deposits: $43,995.2 mil, headquarters in San Francisco, CA, positive income, 647 total offices, Holding Company: Bnp Paribas
- 10 other banks with 10 local branches
For population 15 years and over in Shawnee:
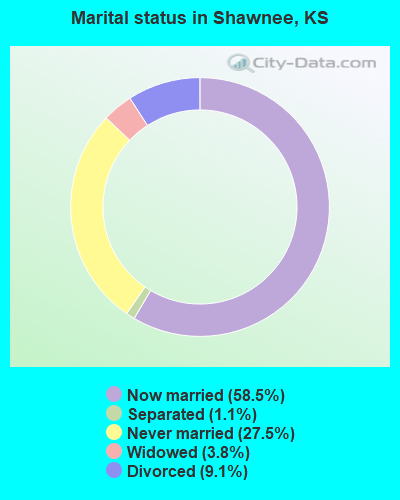
- Never married: 27.5%
- Now married: 58.5%
- Separated: 1.1%
- Widowed: 3.8%
- Divorced: 9.1%
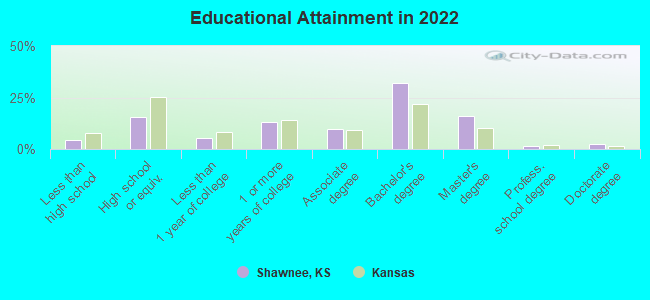
For population 25 years and over in Shawnee:
- High school or higher: 95.8%
- Bachelor's degree or higher: 52.0%
- Graduate or professional degree: 20.1%
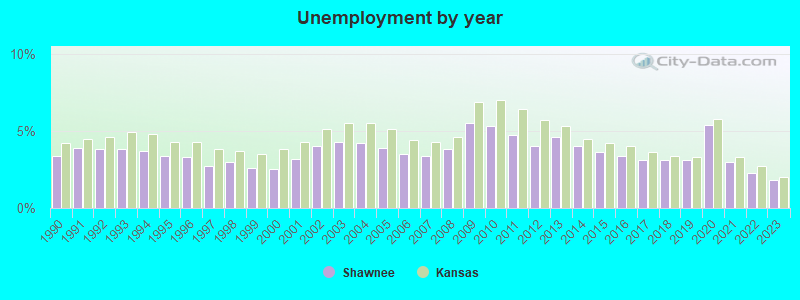
- Unemployed: 1.9%
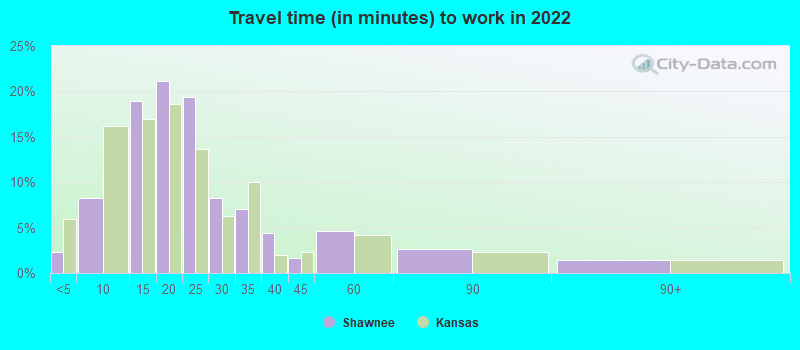
- Mean travel time to work (commute): 18.0 minutes
| Here: | 10.0 |
| Kansas average: | 11.5 |
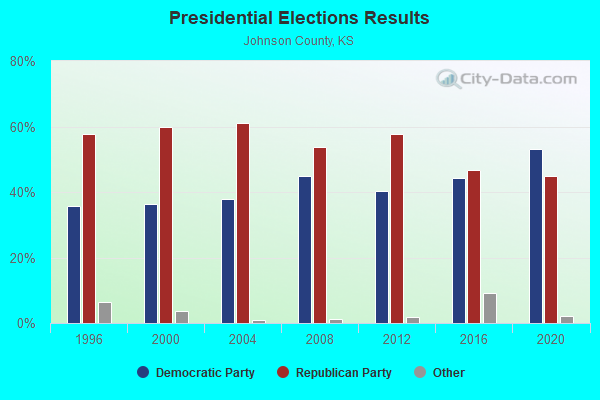
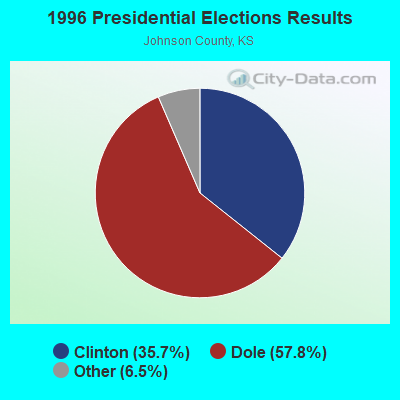
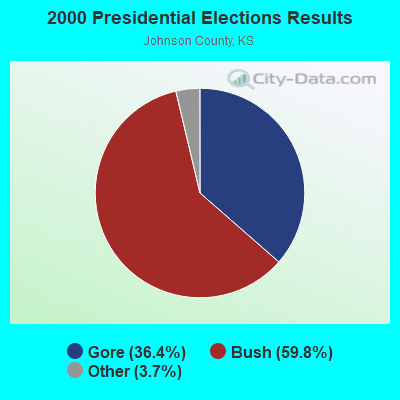
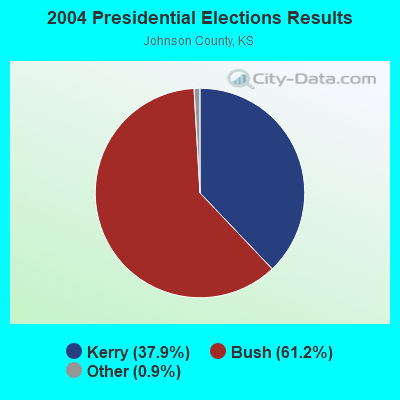
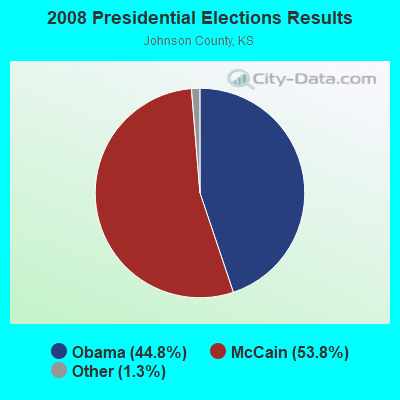

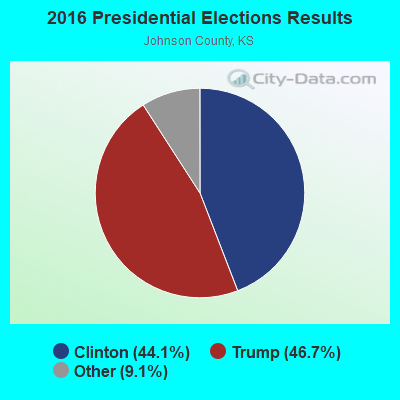
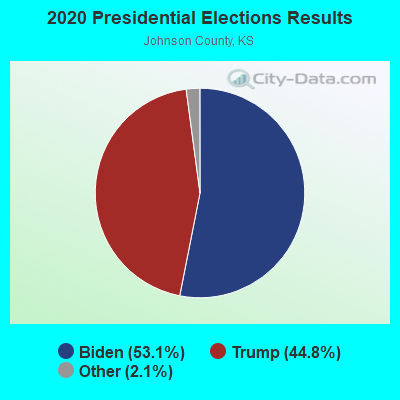
Graphs represent county-level data. Detailed 2008 Election Results
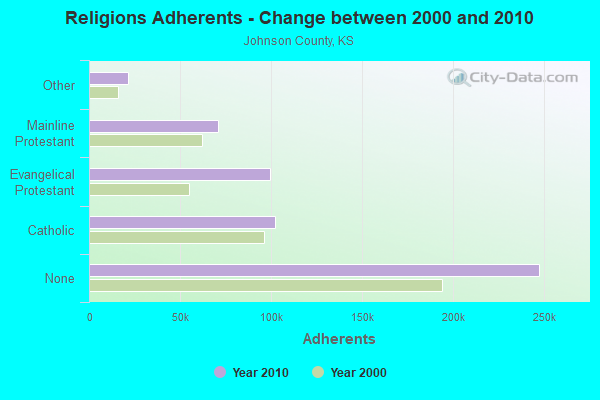
Religion statistics for Shawnee, KS (based on Johnson County data)
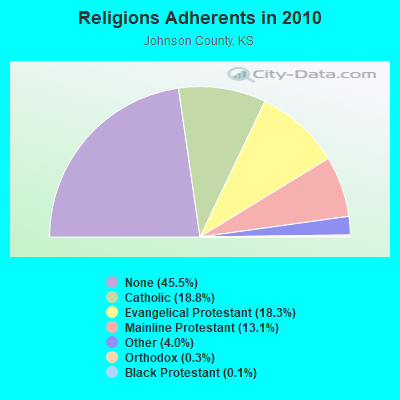
| Religion | Adherents | Congregations |
|---|---|---|
| Catholic | 102,131 | 18 |
| Evangelical Protestant | 99,699 | 190 |
| Mainline Protestant | 71,068 | 87 |
| Other | 21,644 | 46 |
| Orthodox | 1,505 | 5 |
| Black Protestant | 642 | 4 |
| None | 247,490 | - |
Food Environment Statistics:
| This county: | 1.37 / 10,000 pop. |
| Kansas: | 1.96 / 10,000 pop. |
| This county: | 0.19 / 10,000 pop. |
| State: | 0.20 / 10,000 pop. |
| Johnson County: | 0.25 / 10,000 pop. |
| Kansas: | 0.51 / 10,000 pop. |
| This county: | 2.29 / 10,000 pop. |
| Kansas: | 3.84 / 10,000 pop. |
| This county: | 7.39 / 10,000 pop. |
| State: | 7.33 / 10,000 pop. |
| This county: | 6.0% |
| State: | 8.1% |
| Johnson County: | 23.0% |
| Kansas: | 27.9% |
| This county: | 12.6% |
| Kansas: | 13.4% |
Health and Nutrition:
| Here: | 49.7% |
| Kansas: | 49.2% |
| This city: | 47.5% |
| Kansas: | 46.3% |
| Shawnee: | 28.5 |
| Kansas: | 28.6 |
| Shawnee: | 22.0% |
| State: | 21.2% |
| Shawnee: | 9.6% |
| State: | 10.5% |
| Here: | 6.8 |
| Kansas: | 6.8 |
| Shawnee: | 33.7% |
| Kansas: | 33.5% |
| This city: | 57.2% |
| State: | 56.0% |
| Shawnee: | 80.0% |
| State: | 78.6% |
More about Health and Nutrition of Shawnee, KS Residents
| Local government employment and payroll (March 2022) | |||||
| Function | Full-time employees | Monthly full-time payroll | Average yearly full-time wage | Part-time employees | Monthly part-time payroll |
|---|---|---|---|---|---|
| Police Protection - Officers | 93 | $599,589 | $77,366 | 3 | $4,257 |
| Firefighters | 67 | $448,766 | $80,376 | 0 | $0 |
| Streets and Highways | 38 | $238,415 | $75,289 | 5 | $6,705 |
| Financial Administration | 28 | $137,703 | $59,016 | 3 | $14,181 |
| Parks and Recreation | 23 | $173,793 | $90,675 | 13 | $9,619 |
| Housing and Community Development (Local) | 21 | $137,226 | $78,415 | 1 | $493 |
| Solid Waste Management | 16 | $123,155 | $92,366 | 0 | $0 |
| Police - Other | 14 | $113,605 | $97,376 | 0 | $0 |
| Judicial and Legal | 9 | $62,518 | $83,357 | 0 | $0 |
| Other Government Administration | 7 | $55,024 | $94,327 | 11 | $14,450 |
| Fire - Other | 7 | $57,794 | $99,075 | 0 | $0 |
| Totals for Government | 323 | $2,147,587 | $79,787 | 36 | $49,706 |
Shawnee government finances - Expenditure in 2021 (per resident):
- Construction - Regular Highways: $4,521,000 ($65.33)
General - Other: $2,877,000 ($41.58)
Parks and Recreation: $1,498,000 ($21.65)
- Current Operations - Police Protection: $15,397,000 ($222.51)
Regular Highways: $11,078,000 ($160.09)
Local Fire Protection: $8,250,000 ($119.22)
Parks and Recreation: $4,945,000 ($71.46)
Central Staff Services: $4,482,000 ($64.77)
General - Other: $3,893,000 ($56.26)
Financial Administration: $2,948,000 ($42.60)
Sewerage: $1,885,000 ($27.24)
Protective Inspection and Regulation - Other: $1,533,000 ($22.15)
Judicial and Legal Services: $1,328,000 ($19.19)
Housing and Community Development: $341,000 ($4.93)
Miscellaneous Commercial Activities - Other: $17,000 ($0.25)
- General - Interest on Debt: $2,629,000 ($37.99)
- Other Capital Outlay - General - Other: $2,585,000 ($37.36)
Police Protection: $2,134,000 ($30.84)
Regular Highways: $1,229,000 ($17.76)
Financial Administration: $54,000 ($0.78)
Parks and Recreation: $13,000 ($0.19)
Central Staff Services: $3,000 ($0.04)
Shawnee government finances - Revenue in 2021 (per resident):
- Charges - Sewerage: $1,774,000 ($25.64)
Other: $1,179,000 ($17.04)
Parks and Recreation: $680,000 ($9.83)
Miscellaneous Commercial Activities: $40,000 ($0.58)
- Federal Intergovernmental - Housing and Community Development: $142,000 ($2.05)
- Local Intergovernmental - General Local Government Support: $10,738,000 ($155.18)
- Miscellaneous - Interest Earnings: $3,213,000 ($46.43)
Special Assessments: $2,100,000 ($30.35)
Fines and Forfeits: $1,401,000 ($20.25)
General Revenue - Other: $524,000 ($7.57)
Sale of Property: $58,000 ($0.84)
- State Intergovernmental - Highways: $8,329,000 ($120.36)
General Local Government Support: $671,000 ($9.70)
Other: $2,000 ($0.03)
- Tax - Property: $25,136,000 ($363.25)
General Sales and Gross Receipts: $17,341,000 ($250.60)
Public Utilities Sales: $5,919,000 ($85.54)
Other License: $4,368,000 ($63.12)
Other Selective Sales: $545,000 ($7.88)
Occupation and Business License - Other: $445,000 ($6.43)
Shawnee government finances - Debt in 2021 (per resident):
- Long Term Debt - Beginning Outstanding - Public Debt for Private Purpose: $28,200,000 ($407.53)
Retired Nonguaranteed - Public Debt for Private Purpose: $18,500,000 ($267.35)
Beginning Outstanding - Unspecified Public Purpose: $17,675,000 ($255.43)
Outstanding Nonguaranteed - Industrial Revenue: $9,700,000 ($140.18)
Retired Unspecified Public Purpose: $8,965,000 ($129.56)
Outstanding Unspecified Public Purpose: $8,710,000 ($125.87)
Shawnee government finances - Cash and Securities in 2021 (per resident):
- Other Funds - Cash and Securities: $31,765,000 ($459.05)
- Sinking Funds - Cash and Securities: $90,639,000 ($1309.85)
7.16% of this county's 2021 resident taxpayers lived in other counties in 2020 ($81,232 average adjusted gross income)
| Here: | 7.16% |
| Kansas average: | 6.64% |
0.01% of residents moved from foreign countries ($131 average AGI)
Johnson County: 0.01% Kansas average: 0.04%
Top counties from which taxpayers relocated into this county between 2020 and 2021:
| from Jackson County, MO | |
| from Wyandotte County, KS | |
| from Douglas County, KS |
6.77% of this county's 2020 resident taxpayers moved to other counties in 2021 ($90,064 average adjusted gross income)
| Here: | 6.77% |
| Kansas average: | 6.88% |
0.01% of residents moved to foreign countries ($58 average AGI)
Johnson County: 0.01% Kansas average: 0.03%
Top counties to which taxpayers relocated from this county between 2020 and 2021:
| to Jackson County, MO | |
| to Wyandotte County, KS | |
| to Douglas County, KS |
| Businesses in Shawnee, KS | ||||
| Name | Count | Name | Count | |
|---|---|---|---|---|
| 24 Hour Fitness | 1 | Kohl's | 1 | |
| 7-Eleven | 1 | Little Caesars Pizza | 1 | |
| ALDI | 1 | Lowe's | 1 | |
| AT&T | 1 | Marriott | 1 | |
| Ace Hardware | 1 | Maurices | 1 | |
| Advance Auto Parts | 2 | McDonald's | 4 | |
| Arby's | 2 | Nike | 4 | |
| Bed Bath & Beyond | 1 | Office Depot | 1 | |
| Blockbuster | 1 | OfficeMax | 1 | |
| CVS | 3 | Old Navy | 1 | |
| Church's Chicken | 1 | Payless | 1 | |
| Cricket Wireless | 1 | Pier 1 Imports | 1 | |
| Curves | 1 | Pizza Hut | 1 | |
| Dairy Queen | 1 | RadioShack | 1 | |
| Domino's Pizza | 1 | Ruby Tuesday | 1 | |
| DressBarn | 1 | Ryan's Grill | 1 | |
| Dressbarn | 1 | SONIC Drive-In | 2 | |
| Famous Footwear | 1 | Sprint Nextel | 1 | |
| FedEx | 1 | Starbucks | 2 | |
| Firestone Complete Auto Care | 1 | Subway | 7 | |
| Ford | 1 | T-Mobile | 3 | |
| GNC | 1 | Taco Bell | 1 | |
| H&R Block | 3 | Target | 1 | |
| Hilton | 1 | U-Haul | 2 | |
| Hobby Lobby | 1 | UPS | 7 | |
| Home Depot | 1 | Verizon Wireless | 1 | |
| HomeTown Buffet | 1 | Waffle House | 1 | |
| IHOP | 1 | Walgreens | 3 | |
| Jones New York | 1 | Walmart | 2 | |
| KFC | 2 | Wendy's | 2 | |
Strongest AM radio stations in Shawnee:
- KCSP (610 AM; 5 kW; KANSAS CITY, MO; Owner: ENTERCOM KANSAS CITY LICENSE, LLC)
- WHB (810 AM; 50 kW; KANSAS CITY, MO; Owner: UNION BROADCASTING, INC.)
- KXTR (1660 AM; 10 kW; KANSAS CITY, KS; Owner: ENTERCOM KANSAS CITY LICENSE, LLC)
- KMBZ (980 AM; 5 kW; KANSAS CITY, MO; Owner: ENTERCOM KANSAS CITY LICENSE, LLC)
- KCNW (1380 AM; 2 kW; FAIRWAY, KS; Owner: KANSAS CITY RADIO, INC.)
- KKHK (1250 AM; 25 kW; KANSAS CITY, KS)
- KCCV (760 AM; daytime; 6 kW; OVERLAND PARK, KS; Owner: BOTT BROADCASTING COMPANY)
- KCZZ (1480 AM; 1 kW; MISSION, KS; Owner: HMEB COMMUNICATIONS, L.L.C.)
- KCTE (1510 AM; daytime; 10 kW; INDEPENDENCE, MO; Owner: UNION BROADCASTING, INC.)
- KPHN (1190 AM; 5 kW; KANSAS CITY, MO; Owner: ABC, INC.)
- KCMO (710 AM; 10 kW; KANSAS CITY, MO; Owner: SUSQUEHANNA KANSAS CITY PARTNERSHIP)
- KCKN (1340 AM; 1 kW; KANSAS CITY, KS; Owner: CARTER BROADCAST GROUP, INC.)
- KKLO (1410 AM; 5 kW; LEAVENWORTH, KS; Owner: CHARA COMMUNICATIONS, INC.)
Strongest FM radio stations in Shawnee:
- KFKF-FM (94.1 FM; KANSAS CITY, KS; Owner: INFINITY RADIO SUBSIDIARY OPERATIONS INC.)
- KZPL (97.3 FM; LEE'S SUMMIT, MO; Owner: UNION FIRST BROADCASTING, LLC)
- KCMO-FM (94.9 FM; KANSAS CITY, MO; Owner: SUSQUEHANNA KANSAS CITY PARTNERSHIP)
- KCCV-FM (92.3 FM; OLATHE, KS; Owner: BOTT BROADCASTING COMPANY)
- KQRC-FM (98.9 FM; LEAVENWORTH, KS; Owner: ENTERCOM KANSAS CITY LICENSE, LLC)
- KRBZ (96.5 FM; KANSAS CITY, MO; Owner: ENTERCOM KANSAS CITY LICENSE, LLC)
- KYYS (99.7 FM; KANSAS CITY, MO; Owner: ENTERCOM KANSAS CITY LICENSE, LLC)
- KMXV (93.3 FM; KANSAS CITY, MO; Owner: INFINITY RADIO OPERATIONS INC.)
- KPRS (103.3 FM; KANSAS CITY, MO; Owner: CARTER BROADCAST GROUP, INC.)
- WDAF-FM (106.5 FM; LIBERTY, MO; Owner: ENTERCOM KANSAS CITY LICENSE, LLC)
- KUDL (98.1 FM; KANSAS CITY, KS; Owner: ENTERCOM KANSAS CITY LICENSE, LLC)
- KSRC (102.1 FM; KANSAS CITY, MO; Owner: INFINITY RADIO OPERATIONS INC.)
- KBEQ-FM (104.3 FM; KANSAS CITY, MO; Owner: INFINITY RADIO SUBSIDIARY OPERATIONS INC.)
- KCUR-FM (89.3 FM; KANSAS CITY, MO; Owner: CURATORS OF UNIVERSITY OF MISSOURI)
- KLJC (88.5 FM; KANSAS CITY, MO; Owner: CALVARY BIBLE COLLEGE)
- KCFX (101.1 FM; HARRISONVILLE, MO; Owner: SUSQUEHANNA KANSAS CITY PARTNERSHIP)
- KKFI (90.1 FM; KANSAS CITY, MO; Owner: MID-COAST RADIO PROJECT, INC.)
- KANU (91.5 FM; LAWRENCE, KS; Owner: UNIVERSITY OF KANSAS)
- KMJK (107.3 FM; LEXINGTON, MO; Owner: ALLUR-KANSAS CITY, INC.)
- KCHZ (95.7 FM; OTTAWA, KS; Owner: SYNCOM RADIO CORPORATION)
TV broadcast stations around Shawnee:
- KCTV (Channel 5; KANSAS CITY, MO; Owner: MEREDITH CORPORATION)
- KSHB-TV (Channel 41; KANSAS CITY, MO; Owner: SCRIPPS HOWARD BROADCASTING COMPANY)
- WDAF-TV (Channel 4; KANSAS CITY, MO; Owner: WDAF LICENSE, INC.)
- KMBC-TV (Channel 9; KANSAS CITY, MO; Owner: KMBC HEARST-ARGYLE TELEVISION, INC.)
- KMCI (Channel 38; LAWRENCE, KS; Owner: SCRIPPS HOWARD BROADCASTING COMPANY)
- KPXE (Channel 50; KANSAS CITY, MO; Owner: PAXSON KANSAS CITY LICENSE, INC.)
- KCWE (Channel 29; KANSAS CITY, MO; Owner: KCWE-TV, INC.)
- KCPT (Channel 19; KANSAS CITY, MO; Owner: PUBLIC TELEVISION 19, INC.)
- KSMO-TV (Channel 62; KANSAS CITY, MO; Owner: KSMO LICENSEE, INC.)
- K35CT (Channel 35; KANSAS CITY, MO; Owner: WORD OF GOD FELLOWSHIP, INC.)
- K48FS (Channel 48; KANSAS CITY, MO; Owner: WORD OF GOD FELLOWSHIP, INC.)
- K26CR (Channel 26; KANSAS CITY, MO; Owner: VENTANA TELEVISION, INC.)
- K27FR (Channel 27; OVERLAND PARK, KS; Owner: UNIVERSITY OF KANSAS)
- KTAJ (Channel 16; ST. JOSEPH, MO; Owner: TRINITY BROADCASTING NETWORK)
- KUJH-LP (Channel 14; LAWRENCE, KS; Owner: UNIVERSITY OF KANSAS)
- National Bridge Inventory (NBI) Statistics
- 91Number of bridges
- 1,207ft / 368mTotal length
- $2,480,000Total costs
- 966,708Total average daily traffic
- 73,284Total average daily truck traffic
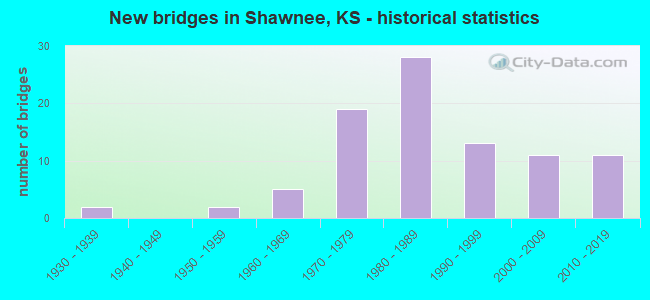
- New bridges - historical statistics
- 21930-1939
- 21950-1959
- 51960-1969
- 191970-1979
- 281980-1989
- 131990-1999
- 112000-2009
- 112010-2019
FCC Registered Antenna Towers: 34 (See the full list of FCC Registered Antenna Towers)
FCC Registered Private Land Mobile Towers: 2 (See the full list of FCC Registered Private Land Mobile Towers in Shawnee, KS)
FCC Registered Broadcast Land Mobile Towers: 26 (See the full list of FCC Registered Broadcast Land Mobile Towers)
FCC Registered Microwave Towers: 14 (See the full list of FCC Registered Microwave Towers in this town)
FCC Registered Maritime Coast & Aviation Ground Towers: 2 (See the full list of FCC Registered Maritime Coast & Aviation Ground Towers)
FCC Registered Amateur Radio Licenses: 336 (See the full list of FCC Registered Amateur Radio Licenses in Shawnee)
FAA Registered Aircraft Manufacturers and Dealers: 2 (See the full list of FAA Registered Manufacturers and Dealers in Shawnee)
FAA Registered Aircraft: 35 (See the full list of FAA Registered Aircraft)
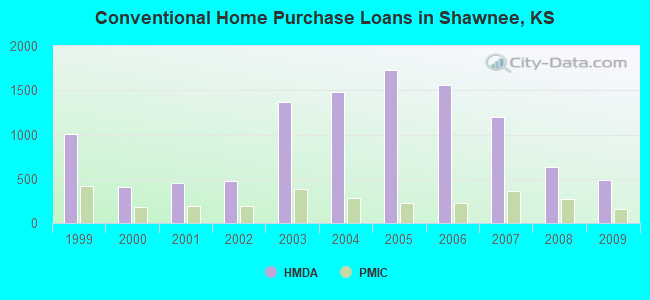
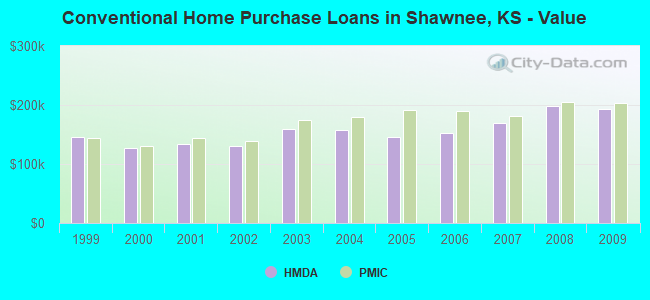
| Home Mortgage Disclosure Act Aggregated Statistics For Year 2009 (Based on 8 full and 5 partial tracts) | ||||||||||||||
| A) FHA, FSA/RHS & VA Home Purchase Loans | B) Conventional Home Purchase Loans | C) Refinancings | D) Home Improvement Loans | E) Loans on Dwellings For 5+ Families | F) Non-occupant Loans on < 5 Family Dwellings (A B C & D) | G) Loans On Manufactured Home Dwelling (A B C & D) | ||||||||
|---|---|---|---|---|---|---|---|---|---|---|---|---|---|---|
| Number | Average Value | Number | Average Value | Number | Average Value | Number | Average Value | Number | Average Value | Number | Average Value | Number | Average Value | |
| LOANS ORIGINATED | 369 | $170,248 | 484 | $193,920 | 2,232 | $183,793 | 76 | $69,241 | 1 | $3,511,850 | 72 | $177,838 | 1 | $160,080 |
| APPLICATIONS APPROVED, NOT ACCEPTED | 20 | $167,732 | 20 | $188,758 | 151 | $190,666 | 11 | $13,596 | 0 | $0 | 4 | $69,165 | 1 | $158,920 |
| APPLICATIONS DENIED | 21 | $135,532 | 29 | $200,076 | 429 | $199,667 | 53 | $34,850 | 0 | $0 | 14 | $122,762 | 0 | $0 |
| APPLICATIONS WITHDRAWN | 36 | $169,487 | 55 | $193,698 | 409 | $186,866 | 12 | $91,138 | 0 | $0 | 9 | $113,893 | 0 | $0 |
| FILES CLOSED FOR INCOMPLETENESS | 4 | $138,455 | 2 | $202,965 | 82 | $184,207 | 5 | $88,144 | 0 | $0 | 2 | $175,755 | 0 | $0 |
Detailed mortgage data for all 13 tracts in Shawnee, KS
| Private Mortgage Insurance Companies Aggregated Statistics For Year 2009 (Based on 8 full and 5 partial tracts) | ||||||
| A) Conventional Home Purchase Loans | B) Refinancings | C) Non-occupant Loans on < 5 Family Dwellings (A & B) | ||||
|---|---|---|---|---|---|---|
| Number | Average Value | Number | Average Value | Number | Average Value | |
| LOANS ORIGINATED | 160 | $204,126 | 153 | $210,976 | 2 | $201,950 |
| APPLICATIONS APPROVED, NOT ACCEPTED | 30 | $205,490 | 37 | $222,587 | 2 | $162,335 |
| APPLICATIONS DENIED | 13 | $246,024 | 31 | $242,169 | 0 | $0 |
| APPLICATIONS WITHDRAWN | 4 | $230,102 | 10 | $198,386 | 0 | $0 |
| FILES CLOSED FOR INCOMPLETENESS | 3 | $225,420 | 2 | $245,070 | 2 | $231,000 |
2002 - 2018 National Fire Incident Reporting System (NFIRS) incidents
- Fire incident types reported to NFIRS in Shawnee, KS
- 1,13148.9%Structure Fires
- 83636.1%Outside Fires
- 29412.7%Mobile Property/Vehicle Fires
- 542.3%Other
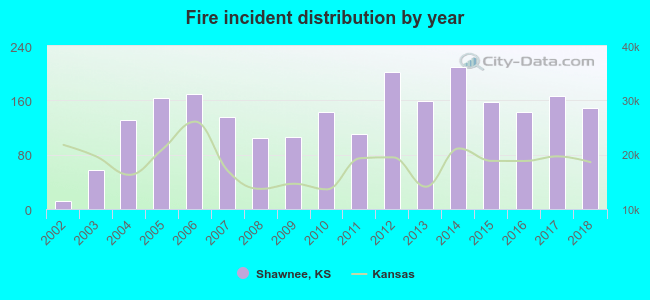 According to the data from the years 2002 - 2018 the average number of fires per year is 136. The highest number of reported fire incidents - 209 took place in 2014, and the least - 12 in 2002. The data has a growing trend.
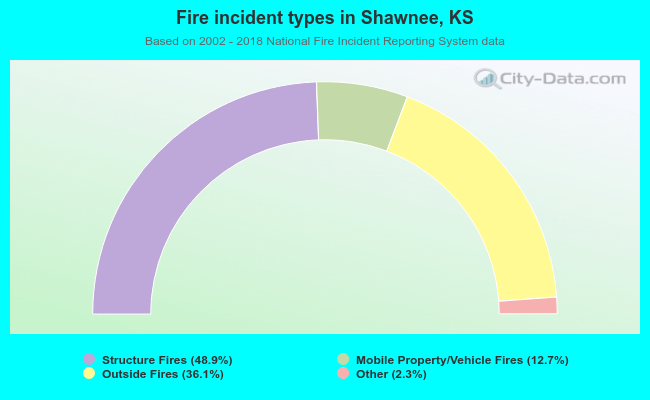 When looking into fire subcategories, the most incidents belonged to: Structure Fires (48.9%), and Outside Fires (36.1%).
Fire-safe hotels and motels in Shawnee, Kansas:
- Courtyard By Marriott, 17250 Midland Dr, Shawnee, Kansas 66217 , Phone: (913) 631-8800, Fax: (913) 631-8801
- Shawnee Inn, 16555 Midland Dr, Shawnee, Kansas 66217 , Phone: (913) 248-1900, Fax: (913) 248-8567
- Holiday Inn Express Shawnee, 17346 Midland Dr, Shawnee, Kansas 66217 , Phone: (877) 834-3613
- Comfort Inn and Suites, 16510 Midland Dr, Shawnee, Kansas 66217 , Phone: (913) 962-5555, Fax: (913) 962-5557
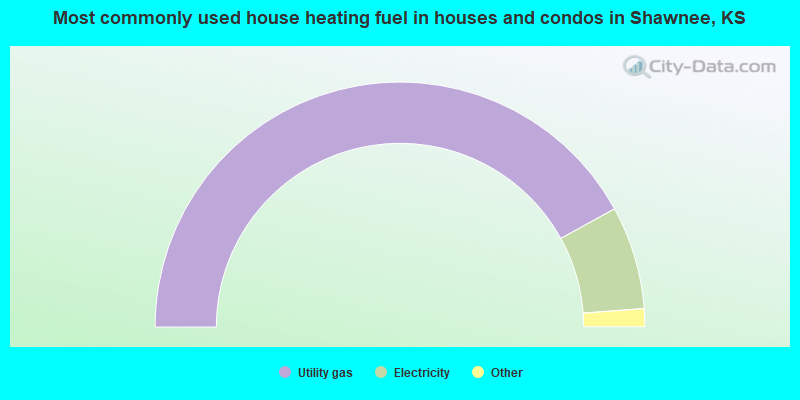
- 84.0%Utility gas
- 13.6%Electricity
- 1.7%Bottled, tank, or LP gas
- 0.5%Wood
- 0.2%Other fuel
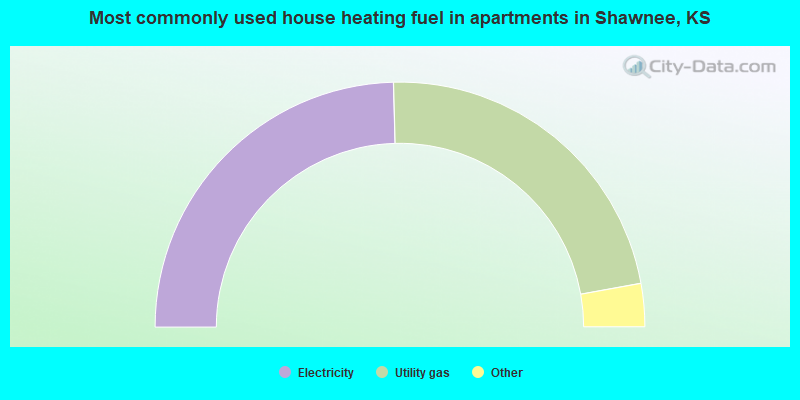
- 49.2%Electricity
- 45.2%Utility gas
- 3.0%Bottled, tank, or LP gas
- 1.6%Coal or coke
- 1.0%No fuel used
Shawnee compared to Kansas state average:
- Median house value above state average.
- Unemployed percentage significantly below state average.
- Black race population percentage above state average.
- Foreign-born population percentage above state average.
- Length of stay since moving in below state average.
- House age below state average.
- Percentage of population with a bachelor's degree or higher above state average.
Shawnee on our top lists:
- #18 on the list of "Top 101 cities with the largest city-data.com crime index decrease from 2011 to 2012 (population 50,000+)"
- #35 on the list of "Top 101 cities with the least people below 50% of the poverty level (population 50,000+)"
- #44 on the list of "Top 101 cities with the lowest number of robberies per 100,000 residents (population 50,000+)"
- #45 on the list of "Top 101 cities with the lowest number of burglaries per 100,000 residents (population 50,000+)"
- #57 on the list of "Top 101 cities with largest percentage of males in occupations: community and social service occupations (population 50,000+)"
- #57 on the list of "Top 101 cities with the lowest city-data.com crime index (population 50,000+)"
- #59 on the list of "Top 101 cities with largest percentage of females in occupations: computer and mathematical occupations (population 50,000+)"
- #60 on the list of "Top 101 cities with largest percentage of males in occupations: business and financial operations occupations (population 50,000+)"
- #63 on the list of "Top 100 cities with biggest houses (pop. 50,000+)"
- #64 on the list of "Top 101 cities that people commute from (largest negative percentage daily daytime population change due to commuting) (population 50,000+)"
- #66 on the list of "Top 101 cities with the smallest differences between morning and afternoon humidity (population 50,000+)"
- #66 on the list of "Top 101 cities with the smallest humidity differences during a year (population 50,000+)"
- #70 on the list of "Top 101 cities with the smallest city-data.com crime index per police officer (population 50,000+)"
- #71 on the list of "Top 101 cities with the lowest number of thefts per 100,000 residents (population 50,000+)"
- #74 on the list of "Top 101 cities with largest percentage of males in industries: wholesale trade (population 50,000+)"
- #76 on the list of "Top 101 cities with the largest percentage of elementary and middle school students in private schools (5,000+ students)"
- #84 on the list of "Top 101 cities with the highest percentage of English-only speaking households, population 50,000+"
- #85 on the list of "Top 101 cities with the most people born in other U.S. states (population 50,000+)"
- #86 on the list of "Top 101 cities with the most local government spending on highway construction per resident (population 10,000+)"
- #87 on the list of "Top 101 cities with the largest temperature differences during a year (population 50,000+)"
- #9 on the list of "Top 101 counties with the best general health status score of residents (1-5), 3 years of data"
- #11 on the list of "Top 101 counties with the highest percentage of residents that visited a dentist within the past year"
- #31 on the list of "Top 101 counties with the largest number of people without health insurance coverage in 2000 (pop. 50,000+)"
- #33 on the list of "Top 101 counties with the largest number of children under 18 without health insurance coverage in 2000 (pop. 50,000+)"
- #36 on the list of "Top 101 counties with the highest percentage of residents that exercised in the past month"

|
|
Total of 497 patent applications in 2008-2024.