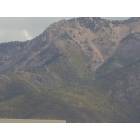
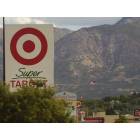
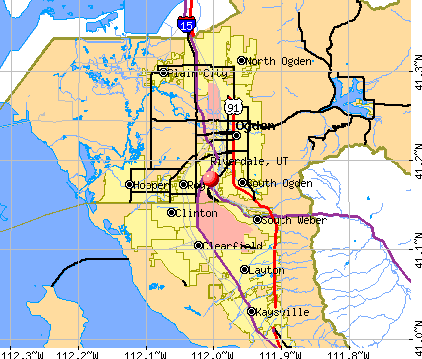
Riverdale, Utah
Submit your own pictures of this city and show them to the world
- OSM Map
- General Map
- Google Map
- MSN Map
Population change since 2000: +21.3%
 |
| Males: 4,601 | |
| Females: 4,684 |
| Median resident age: | 31.5 years |
| Utah median age: | 32.1 years |
Zip codes: 84405.
| Riverdale: | $75,126 |
| UT: | $89,168 |
Estimated per capita income in 2022: $32,632 (it was $18,627 in 2000)
Riverdale city income, earnings, and wages data
Estimated median house or condo value in 2022: $398,454 (it was $125,900 in 2000)
| Riverdale: | $398,454 |
| UT: | $499,500 |
Mean prices in 2022: all housing units: $489,906; detached houses: $518,555; townhouses or other attached units: $367,378; in 2-unit structures: $372,281; in 3-to-4-unit structures: $252,139; in 5-or-more-unit structures: $197,854; mobile homes: $72,035
Median gross rent in 2022: $1,280.
(7.1% for White Non-Hispanic residents, 10.3% for Hispanic or Latino residents, 8.2% for other race residents)
Detailed information about poverty and poor residents in Riverdale, UT

Compare current foreclosures near Riverdale, UT:
| Photo | Address | Area | Beds / Baths | Price | Details |
|---|---|---|---|---|---|

|
#1
S 2900 W
Ogden, UT 84401
|
1,186 sq. feet
|
2 baths 3 beds |
show details | |

|
#2
N 360 W
Clearfield, UT 84015
|
1,099 sq. feet
|
1 baths 4 beds |
show details | |

|
#3
W 4925 S
Roy, UT 84067
|
3,668 sq. feet
|
1 baths 5 beds |
show details | |

|
#4
W 300 N
Clearfield, UT 84015
|
1,105 sq. feet
|
1 baths 3 beds |
show details | |

|
#5
Foothill Dr
Ogden, UT 84403
|
3,219 sq. feet
|
3 baths 4 beds |
show details | |

|
#6
Lakeview Dr
Ogden, UT 84414
|
1,595 sq. feet
|
3 baths 6 beds |
show details | |

|
#7
W 4900 S
Roy, UT 84067
|
1,100 sq. feet
|
2 baths 4 beds |
show details | |

|
#8
S 4000 W
Roy, UT 84067
|
1,154 sq. feet
|
2 baths 4 beds |
show details | |

|
#9
Polk Ave
Ogden, UT 84403
|
1,860 sq. feet
|
1 baths 4 beds |
show details | |

|
#10
Chatelain Rd
Ogden, UT 84403
|
- sq. feet
|
2 baths 5 beds |
show details |
| Photo | Address | Area | Beds / Baths | Price | Details |
|---|---|---|---|---|---|

|
#11
W 3450 N
Ogden, UT 84404
|
- sq. feet
|
2 baths 3 beds |
show details | |

|
#12
E Highway 193, Trlr 151
Layton, UT 84040
|
- sq. feet
|
- baths - beds |
show details | |

|
#13
S 1280 W
Clearfield, UT 84015
|
1,083 sq. feet
|
- baths - beds |
show details | |

|
#14
N 725 W
Layton, UT 84041
|
- sq. feet
|
- baths - beds |
show details | |

|
#15
E Southwell St Apt 1
Ogden, UT 84404
|
- sq. feet
|
- baths - beds |
show details | |

|
#16
S 1000 E Apt 2701
Clearfield, UT 84015
|
- sq. feet
|
- baths - beds |
show details | |

|
#17
S 1000 E Apt 3102
Clearfield, UT 84015
|
- sq. feet
|
- baths - beds |
show details | |

|
#18
W 50 S
Clearfield, UT 84015
|
- sq. feet
|
- baths - beds |
show details | |

|
#19
E Highway 193, Trlr 195
Layton, UT 84040
|
- sq. feet
|
- baths - beds |
show details | |

|
#20
E Highway 193, Trlr 152
Layton, UT 84040
|
- sq. feet
|
- baths - beds |
show details |
| Photo | Address | Area | Beds / Baths | Price | Details |
|---|---|---|---|---|---|

|
#21
W 100 S
Clearfield, UT 84015
|
- sq. feet
|
- baths - beds |
show details | |

|
#22
Cook St
Ogden, UT 84404
|
- sq. feet
|
- baths - beds |
show details | |

|
#23
S 1000 E Apt 57
Clearfield, UT 84015
|
- sq. feet
|
- baths - beds |
show details | |

|
#24
Fowler Ave
Ogden, UT 84404
|
- sq. feet
|
- baths - beds |
show details | |

|
#25
S 1000 E Apt 803
Clearfield, UT 84015
|
- sq. feet
|
- baths - beds |
show details | |

|
#26
S 5675 W
Hooper, UT 84315
|
- sq. feet
|
- baths - beds |
show details | |

|
#27
W 5300 S
Hooper, UT 84315
|
- sq. feet
|
- baths - beds |
show details | |

|
#28
N 1050 W
Layton, UT 84041
|
959 sq. feet
|
- baths - beds |
show details | |

|
#29
S 1000 E Apt 1105
Clearfield, UT 84015
|
- sq. feet
|
- baths - beds |
show details | |

|
#30
N Harrisville Rd, Trlr 56
Ogden, UT 84404
|
- sq. feet
|
- baths - beds |
show details |
| Photo | Address | Area | Beds / Baths | Price | Details |
|---|---|---|---|---|---|

|
#31
E 3125 N
Layton, UT 84040
|
- sq. feet
|
- baths - beds |
show details | |

|
#32
E Highway 193, Trlr 166
Layton, UT 84040
|
- sq. feet
|
- baths - beds |
show details | |

|
#33
W 2350 N
Clearfield, UT 84015
|
966 sq. feet
|
- baths - beds |
show details | |

|
#34
N 490 W
Layton, UT 84041
|
- sq. feet
|
- baths - beds |
show details | |

|
#35
S 1500 E Apt 1009b
Clearfield, UT 84015
|
- sq. feet
|
- baths - beds |
show details | |

|
#36
S 2000 E Apt L196
Clearfield, UT 84015
|
- sq. feet
|
- baths - beds |
show details | |

|
#37
Barrington Way
Layton, UT 84041
|
- sq. feet
|
- baths - beds |
show details | |

|
#38
N Hill Field Rd, Trlr 159
Layton, UT 84041
|
- sq. feet
|
- baths - beds |
show details | |

|
#39
N Hill Field Rd, Trlr 98
Layton, UT 84041
|
- sq. feet
|
- baths - beds |
show details | |

|
#40
N Hill Field Rd, Trlr 158
Layton, UT 84041
|
- sq. feet
|
- baths - beds |
show details |
| Photo | Address | Area | Beds / Baths | Price | Details |
|---|---|---|---|---|---|

|
#41
E 1150 S
Clearfield, UT 84015
|
1,200 sq. feet
|
- baths - beds |
show details | |

|
#42
E 3350 N
Layton, UT 84040
|
1,489 sq. feet
|
- baths - beds |
show details | |

|
#43
S 1500 E Apt U2109
Clearfield, UT 84015
|
- sq. feet
|
- baths - beds |
show details | |

|
#44
Sunset Dr
Layton, UT 84041
|
- sq. feet
|
- baths - beds |
show details | |

|
#45
S 1500 E Apt 2073n
Clearfield, UT 84015
|
- sq. feet
|
- baths - beds |
show details | |

|
#46
S 1800 E, Apt D408
Clearfield, UT 84015
|
- sq. feet
|
- baths - beds |
show details | |

|
#47
Indian Camp Rd
Ogden, UT 84404
|
- sq. feet
|
- baths - beds |
show details | |

|
#48
S 2000 E Apt B315
Clearfield, UT 84015
|
- sq. feet
|
- baths - beds |
show details | |

|
#49
Freemont Way
Layton, UT 84041
|
- sq. feet
|
- baths - beds |
show details | |

|
Check over 1 million property listings on Foreclosure.com!
|
browse all offers | |||


- 6,72270.4%White alone
- 2,29124.0%Hispanic
- 3303.5%Two or more races
- 1181.2%Other race alone
- 951.0%Asian alone
- 230.2%Black alone
- 90.09%American Indian alone
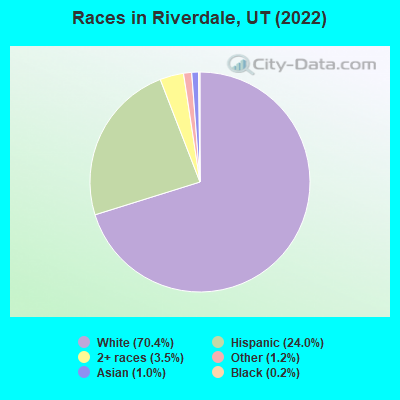
Races in Riverdale detailed stats: ancestries, foreign born residents, place of birth
According to our research of Utah and other state lists, there were 13 registered sex offenders living in Riverdale, Utah as of May 23, 2024.
The ratio of all residents to sex offenders in Riverdale is 681 to 1.
The ratio of registered sex offenders to all residents in this city is lower than the state average.
Type |
2009 |
2010 |
2011 |
2012 |
2013 |
2014 |
2015 |
2016 |
2017 |
2018 |
2019 |
2020 |
2021 |
2022 |
|---|---|---|---|---|---|---|---|---|---|---|---|---|---|---|
| Murders (per 100,000) | 0 (0.0) | 0 (0.0) | 0 (0.0) | 0 (0.0) | 0 (0.0) | 0 (0.0) | 1 (11.6) | 1 (11.5) | 0 (0.0) | 0 (0.0) | 0 (0.0) | 2 (22.5) | 0 (0.0) | 0 (0.0) |
| Rapes (per 100,000) | 4 (49.2) | 0 (0.0) | 4 (46.6) | 4 (46.2) | 1 (11.6) | 9 (104.8) | 6 (69.5) | 9 (103.5) | 2 (22.9) | 2 (22.7) | 6 (68.0) | 6 (67.6) | 3 (33.2) | 7 (74.4) |
| Robberies (per 100,000) | 8 (98.3) | 4 (47.5) | 2 (23.3) | 3 (34.7) | 2 (23.3) | 4 (46.6) | 5 (58.0) | 0 (0.0) | 8 (91.5) | 5 (56.9) | 8 (90.7) | 1 (11.3) | 5 (55.3) | 2 (21.3) |
| Assaults (per 100,000) | 12 (147.5) | 5 (59.3) | 13 (151.4) | 7 (80.9) | 8 (93.1) | 6 (69.9) | 4 (46.4) | 7 (80.5) | 15 (171.5) | 16 (181.9) | 12 (136.0) | 15 (169.0) | 9 (99.6) | 21 (223.2) |
| Burglaries (per 100,000) | 27 (331.9) | 43 (510.3) | 58 (675.3) | 51 (589.1) | 34 (395.6) | 22 (256.2) | 55 (637.5) | 40 (459.8) | 27 (308.7) | 38 (432.1) | 39 (442.1) | 12 (135.2) | 25 (276.6) | 29 (308.2) |
| Thefts (per 100,000) | 517 (6,355) | 589 (6,990) | 478 (5,565) | 390 (4,505) | 480 (5,585) | 434 (5,054) | 492 (5,703) | 546 (6,277) | 544 (6,221) | 477 (5,424) | 491 (5,566) | 350 (3,943) | 371 (4,105) | 398 (4,230) |
| Auto thefts (per 100,000) | 17 (209.0) | 14 (166.2) | 22 (256.1) | 18 (207.9) | 24 (279.2) | 14 (163.0) | 16 (185.5) | 21 (241.4) | 28 (320.2) | 16 (181.9) | 29 (328.8) | 26 (292.9) | 20 (221.3) | 16 (170.1) |
| Arson (per 100,000) | 2 (24.6) | 3 (35.6) | 0 (0.0) | 0 (0.0) | 2 (23.3) | 1 (11.6) | 1 (11.6) | 1 (11.5) | 2 (22.9) | 0 (0.0) | 0 (0.0) | 1 (11.3) | 1 (11.1) | 1 (10.6) |
| City-Data.com crime index | 392.5 | 354.7 | 364.9 | 301.6 | 308.3 | 344.9 | 393.1 | 424.4 | 376.1 | 333.4 | 388.7 | 326.9 | 264.3 | 314.9 |
The City-Data.com crime index weighs serious crimes and violent crimes more heavily. Higher means more crime, U.S. average is 246.1. It adjusts for the number of visitors and daily workers commuting into cities.
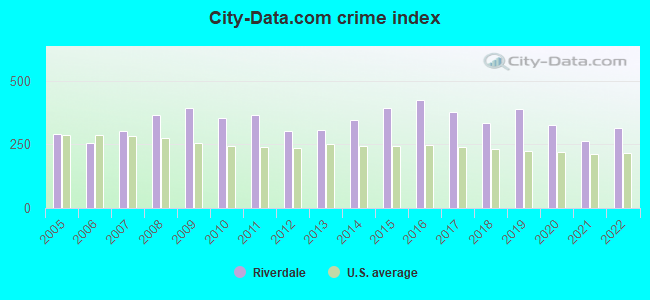
Crime rate in Riverdale detailed stats: murders, rapes, robberies, assaults, burglaries, thefts, arson
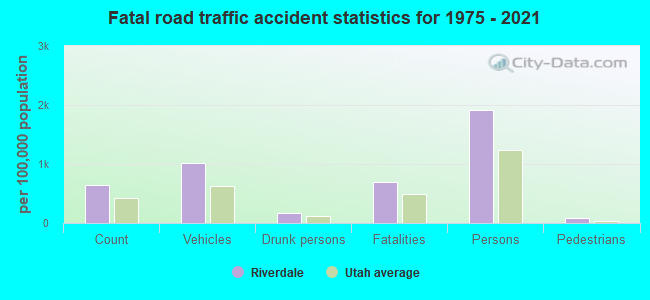
Full-time law enforcement employees in 2021, including police officers: 19 (17 officers - 16 male; 1 female).
| Officers per 1,000 residents here: | 1.88 |
| Utah average: | 1.67 |
 Recent articles from our blog. Our writers, many of them Ph.D. graduates or candidates, create easy-to-read articles on a wide variety of topics.

 | Best Place to Live in SLC/Ogden/Provo Metro (22 replies) |
| Any African American Hair Stylists? (57 replies) |
| Murray, Riverdale, Syracuse, and Ogen information please (7 replies) |
| Riverdale and Layton (8 replies) |
| Childcare and/or nannies in Layton or Ogden (6 replies) |
| Moving from Buffalo NY to Salt Lake City (6 replies) |
Latest news from Riverdale, UT collected exclusively by city-data.com from local newspapers, TV, and radio stations
Ancestries: English (14.6%), European (13.1%), American (10.8%), German (3.5%), Dutch (2.5%), Irish (2.2%).
Current Local Time: MST time zone
Incorporated on 03/04/1946
Elevation: 4355 feet
Land area: 4.44 square miles.
Population density: 2,093 people per square mile (low).
601 residents are foreign born (5.4% Latin America).
| This city: | 6.3% |
| Utah: | 8.4% |
Median real estate property taxes paid for housing units with mortgages in 2022: $1,995 (0.5%)
Median real estate property taxes paid for housing units with no mortgage in 2022: $1,970 (0.5%)
Nearest city with pop. 50,000+: Ogden, UT  (4.1 miles , pop. 77,226).
Nearest city with pop. 200,000+: Northeast Jefferson, CO (376.1 miles , pop. 450,166).
Nearest city with pop. 1,000,000+: Phoenix, AZ (529.2 miles , pop. 1,321,045).
Nearest cities:
), ), ), ), )Latitude: 41.18 N, Longitude: 112.00 W
Daytime population change due to commuting: +1,724 (+18.1%)
Workers who live and work in this city: 1,171 (25.0%)
Area code commonly used in this area: 801

Riverdale, Utah accommodation & food services, waste management - Economy and Business Data
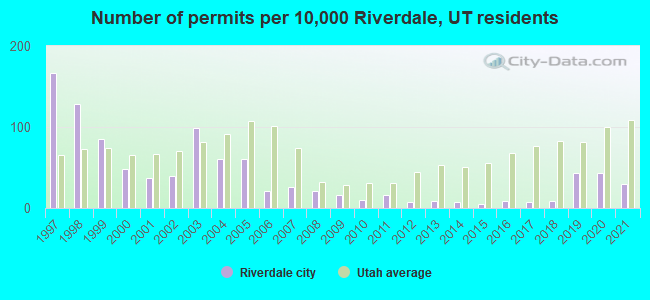
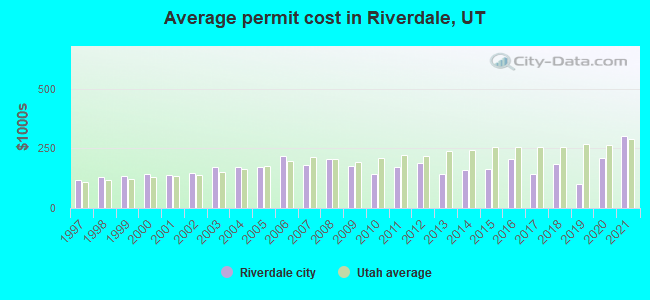
Single-family new house construction building permits:
- 2021: 23 buildings, average cost: $302,700
- 2020: 33 buildings, average cost: $210,200
- 2019: 33 buildings, average cost: $99,200
- 2018: 7 buildings, average cost: $184,700
- 2017: 6 buildings, average cost: $142,100
- 2016: 7 buildings, average cost: $203,900
- 2015: 4 buildings, average cost: $165,300
- 2014: 6 buildings, average cost: $161,200
- 2013: 7 buildings, average cost: $143,000
- 2012: 6 buildings, average cost: $188,000
- 2011: 12 buildings, average cost: $171,200
- 2010: 8 buildings, average cost: $141,800
- 2009: 12 buildings, average cost: $177,100
- 2008: 16 buildings, average cost: $203,900
- 2007: 20 buildings, average cost: $179,700
- 2006: 16 buildings, average cost: $216,800
- 2005: 47 buildings, average cost: $173,100
- 2004: 46 buildings, average cost: $173,100
- 2003: 76 buildings, average cost: $170,200
- 2002: 30 buildings, average cost: $147,500
- 2001: 28 buildings, average cost: $139,600
- 2000: 37 buildings, average cost: $141,600
- 1999: 65 buildings, average cost: $133,000
- 1998: 99 buildings, average cost: $128,900
- 1997: 128 buildings, average cost: $117,000
| Here: | 2.7% |
| Utah: | 2.5% |
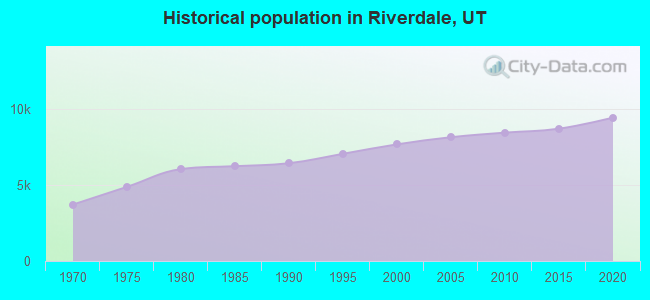
Population change in the 1990s: +1,229 (+19.1%).
- Public administration (15.0%)
- Construction (7.1%)
- Transportation equipment (6.5%)
- Accommodation & food services (6.4%)
- Health care (6.2%)
- Educational services (5.3%)
- Administrative & support & waste management services (3.9%)

- Construction (11.7%)
- Public administration (11.0%)
- Transportation equipment (6.4%)
- Repair & maintenance (5.5%)
- Accommodation & food services (5.1%)
- Miscellaneous manufacturing (4.5%)
- Administrative & support & waste management services (4.1%)
- Public administration (19.8%)
- Health care (10.3%)
- Educational services (9.3%)
- Accommodation & food services (8.0%)
- Transportation equipment (6.5%)
- Food & beverage stores (3.7%)
- Administrative & support & waste management services (3.5%)
- Other management occupations, except farmers and farm managers (5.5%)
- Other production occupations, including supervisors (5.4%)
- Other office and administrative support workers, including supervisors (5.3%)
- Material recording, scheduling, dispatching, and distributing workers (3.7%)
- Information and record clerks, except customer service representatives (3.3%)
- Driver/sales workers and truck drivers (3.2%)
- Assemblers and fabricators (3.1%)
- Other management occupations, except farmers and farm managers (7.6%)
- Driver/sales workers and truck drivers (5.9%)
- Other production occupations, including supervisors (5.1%)
- Metal workers and plastic workers (4.2%)
- Other sales and related occupations, including supervisors (4.2%)
- Electrical equipment mechanics and other installation, maintenance, and repair workers, including supervisors (4.1%)
- Material recording, scheduling, dispatching, and distributing workers (4.1%)
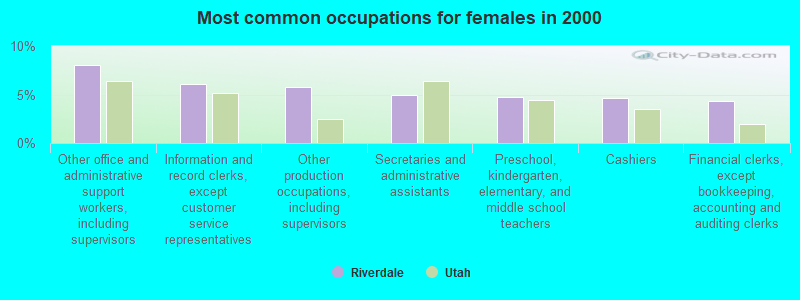
- Other office and administrative support workers, including supervisors (8.0%)
- Information and record clerks, except customer service representatives (6.1%)
- Other production occupations, including supervisors (5.8%)
- Secretaries and administrative assistants (5.0%)
- Preschool, kindergarten, elementary, and middle school teachers (4.7%)
- Cashiers (4.7%)
- Financial clerks, except bookkeeping, accounting and auditing clerks (4.3%)
Average climate in Riverdale, Utah
Based on data reported by over 4,000 weather stations


(lower is better)
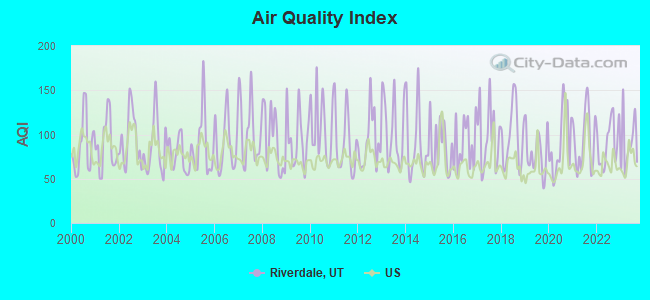
Air Quality Index (AQI) level in 2023 was 89.8. This is worse than average.
| City: | 89.8 |
| U.S.: | 72.6 |
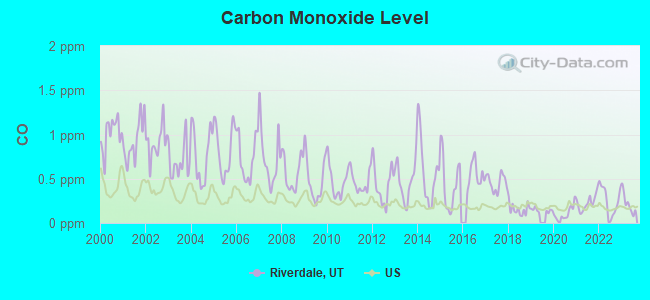
Carbon Monoxide (CO) [ppm] level in 2023 was 0.219. This is about average. Closest monitor was 1.1 miles away from the city center.
| City: | 0.219 |
| U.S.: | 0.251 |
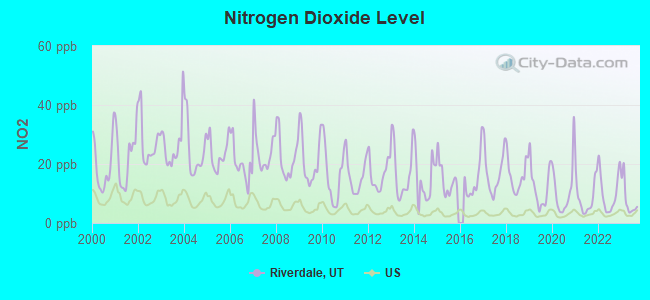
Nitrogen Dioxide (NO2) [ppb] level in 2023 was 7.86. This is significantly worse than average. Closest monitor was 2.4 miles away from the city center.
| City: | 7.86 |
| U.S.: | 5.11 |
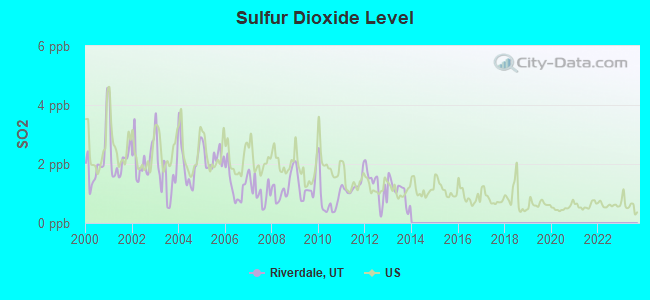
Sulfur Dioxide (SO2) [ppb] level in 2013 was 1.07. This is significantly better than average. Closest monitor was 3.2 miles away from the city center.
| City: | 1.07 |
| U.S.: | 1.51 |
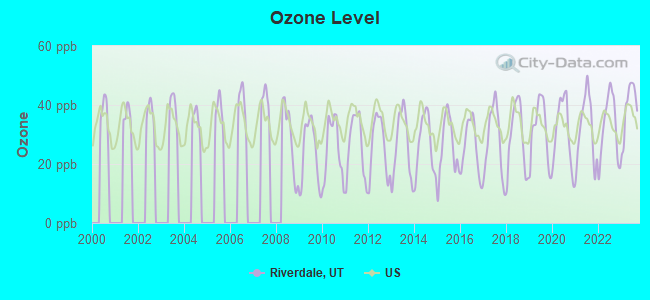
Ozone [ppb] level in 2023 was 39.3. This is about average. Closest monitor was 1.1 miles away from the city center.
| City: | 39.3 |
| U.S.: | 33.3 |
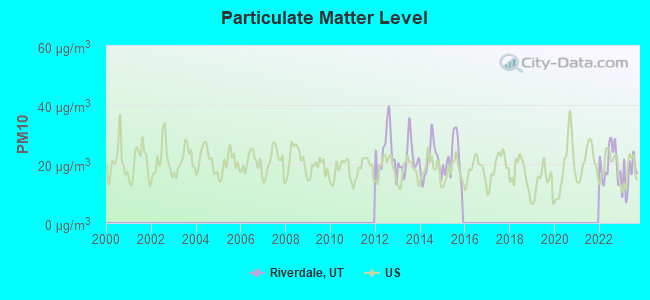
Particulate Matter (PM10) [µg/m3] level in 2023 was 16.2. This is about average. Closest monitor was 1.1 miles away from the city center.
| City: | 16.2 |
| U.S.: | 19.2 |
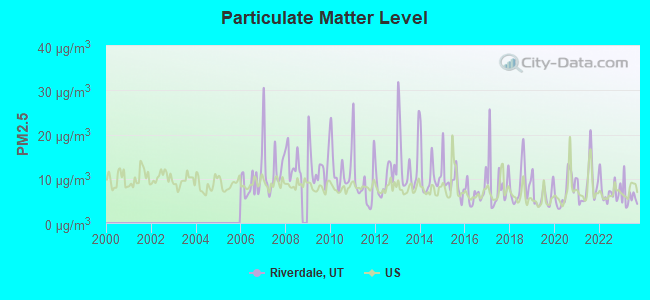
Particulate Matter (PM2.5) [µg/m3] level in 2023 was 5.98. This is better than average. Closest monitor was 1.1 miles away from the city center.
| City: | 5.98 |
| U.S.: | 8.11 |
Earthquake activity:
Riverdale-area historical earthquake activity is significantly above Utah state average. It is 2118% greater than the overall U.S. average.On 8/18/1959 at 06:37:13, a magnitude 7.7 (7.7 UK, Class: Major, Intensity: VIII - XII) earthquake occurred 244.1 miles away from Riverdale center, causing $26,000,000 total damage
On 10/28/1983 at 14:06:06, a magnitude 7.3 (6.2 MB, 7.3 MS, 7.0 MW) earthquake occurred 220.3 miles away from Riverdale center, causing 2 deaths (2 shaking deaths) and 3 injuries, causing $15,000,000 total damage
On 10/3/1915 at 06:52:48, a magnitude 7.6 (7.6 UK) earthquake occurred 291.3 miles away from the city center
On 3/28/1975 at 02:31:05, a magnitude 6.2 (6.1 MB, 6.0 MS, 6.2 ML, Class: Strong, Intensity: VII - IX) earthquake occurred 62.6 miles away from the city center
On 3/18/2020 at 13:09:31, a magnitude 5.7 (5.7 MW, Depth: 7.4 mi, Class: Moderate, Intensity: VI - VII) earthquake occurred 29.8 miles away from the city center
On 12/21/1932 at 06:10:09, a magnitude 7.2 (7.2 UK) earthquake occurred 371.8 miles away from the city center
Magnitude types: body-wave magnitude (MB), local magnitude (ML), surface-wave magnitude (MS), moment magnitude (MW)
Natural disasters:
The number of natural disasters in Weber County (8) is smaller than the US average (15).Major Disasters (Presidential) Declared: 4
Emergencies Declared: 2
Causes of natural disasters: Floods: 4, Landslides: 2, Storms: 2, Drought: 1, Fire: 1, Heavy Rain: 1, Hurricane: 1, Mudslide: 1, Snow: 1, Other: 1 (Note: some incidents may be assigned to more than one category).

Hospitals and medical centers near Riverdale:
- IVY LANE PEDIATRICS, INC (Home Health Center, about 2 miles away; ROY, UT)
- INTERMOUNTAIN HOMECARE OGDEN (Home Health Center, about 2 miles away; OGDEN, UT)
- MT OGDEN HEALTH AND REHABILITATION CENTER (Nursing Home, about 2 miles away; WASHINGTON TERRACE, UT)
- WASHINGTON TERRACE CARE AND REHABILITATION CENTER (Nursing Home, about 2 miles away; OGDEN, UT)
- VISTA HOSPICE CARE, INC DBA VISTACARE (Hospital, about 2 miles away; OGDEN, UT)
- BONNEVILLE DIALYSIS CENTER (Dialysis Facility, about 3 miles away; OGDEN, UT)
- OGDEN REGIONAL MEDICAL CENTER Acute Care Hospitals (about 3 miles away; OGDEN, UT)
Colleges/universities with over 2000 students nearest to Riverdale:
- Weber State University (about 4 miles; Ogden, UT; Full-time enrollment: 17,655)
- Latter-day Saints Business College (about 29 miles; Salt Lake City, UT; FT enrollment: 2,059)
- University of Utah (about 30 miles; Salt Lake City, UT; FT enrollment: 28,454)
- Westminster College (about 32 miles; Salt Lake City, UT; FT enrollment: 2,870)
- Western Governors University (about 35 miles; Salt Lake City, UT; FT enrollment: 31,481)
- Salt Lake Community College (about 36 miles; Salt Lake City, UT; FT enrollment: 20,797)
- Stevens-Henager College-Murray (about 37 miles; Murray, UT; FT enrollment: 6,395)
Public high school in Riverdale:
Points of interest:
Notable locations in Riverdale: Riverdale Center (A), Riverdale Power Plant (B), Riverdale Industrial Park (C), Hill Aerospace Museum (D), The Family Center at Riverdale (E), Riverdale Fire Services (F). Display/hide their locations on the map
Shopping Center: Riverdale Shopping Center (1). Display/hide its location on the map
Churches in Riverdale include: Victory Christian Fellowship (A), The Church of Jesus Christ of Latter Day Saints (B). Display/hide their locations on the map
Park in Riverdale: Riverdale Park (1). Display/hide its location on the map
Court: Riverdale City - Court (4600 South Weber River Drive).
Drinking water stations with addresses in Riverdale that have no violations reported:
- SOUTH OGDEN CITY WATER SYSTEM (Population served: 15,500, Primary Water Source Type: Purch surface water)
| This city: | 2.8 people |
| Utah: | 3.1 people |
| This city: | 71.2% |
| Whole state: | 75.2% |
| This city: | 6.6% |
| Whole state: | 4.6% |
Likely homosexual households (counted as self-reported same-sex unmarried-partner households)
- Lesbian couples: 0.3% of all households
- Gay men: 0.5% of all households
Banks with branches in Riverdale (2011 data):
- JPMorgan Chase Bank, National Association: Riverdale Branch at 1140 West Riverdale Road, Suite D, branch established on 1920/01/01. Info updated 2011/11/10: Bank assets: $1,811,678.0 mil, Deposits: $1,190,738.0 mil, headquarters in Columbus, OH, positive income, International Specialization, 5577 total offices, Holding Company: Jpmorgan Chase & Co.
- Wells Fargo Bank, National Association: Riverdale Branch at 890 West Riverdale Road, branch established on 1995/05/22. Info updated 2011/04/05: Bank assets: $1,161,490.0 mil, Deposits: $905,653.0 mil, headquarters in Sioux Falls, SD, positive income, 6395 total offices, Holding Company: Wells Fargo & Company
For population 15 years and over in Riverdale:
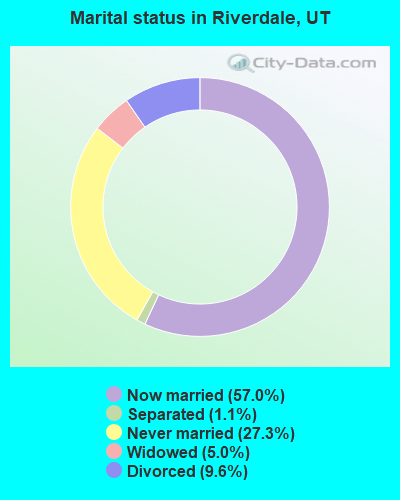
- Never married: 27.3%
- Now married: 57.0%
- Separated: 1.1%
- Widowed: 5.0%
- Divorced: 9.6%
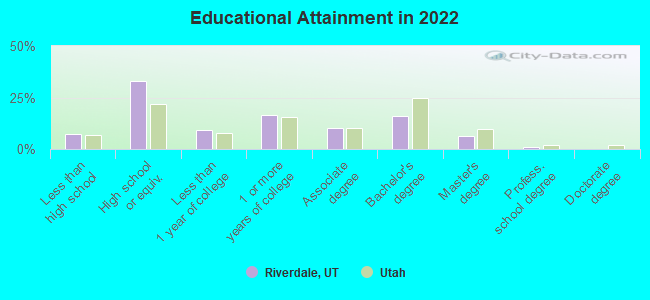
For population 25 years and over in Riverdale:
- High school or higher: 91.1%
- Bachelor's degree or higher: 21.6%
- Graduate or professional degree: 5.8%
- Unemployed: 5.0%
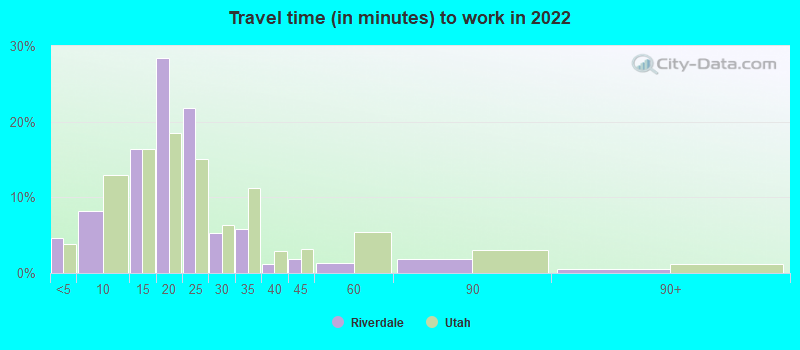
- Mean travel time to work (commute): 14.4 minutes
| Here: | 8.9 |
| Utah average: | 10.9 |
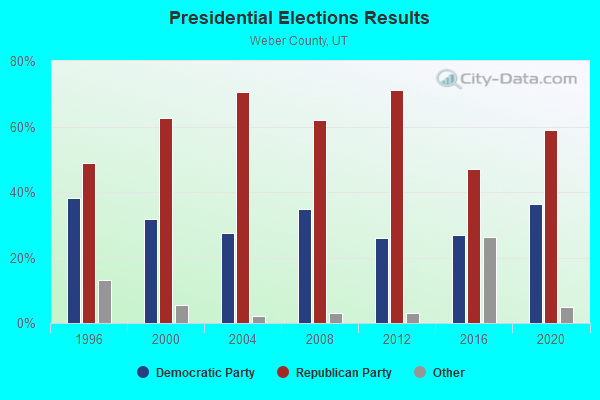
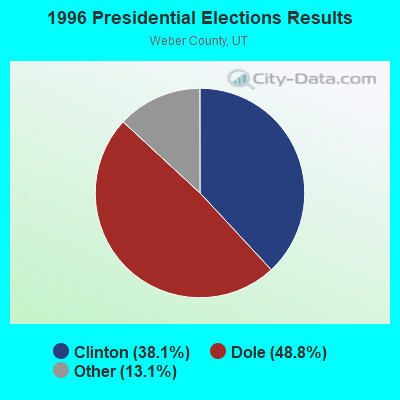
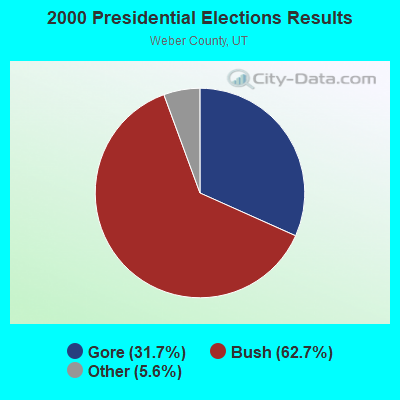
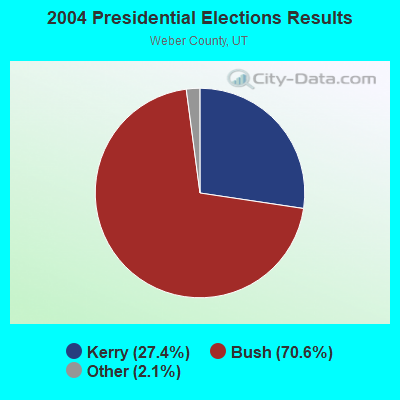
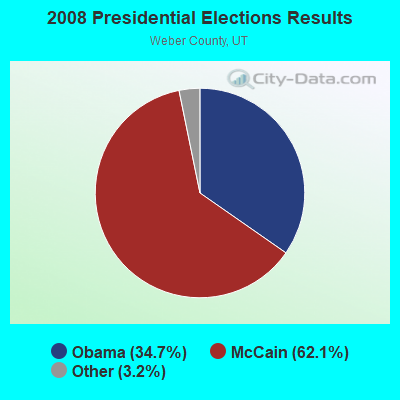
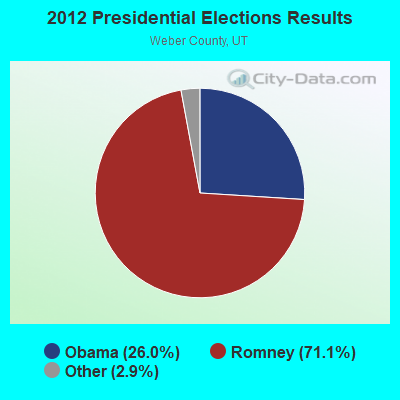
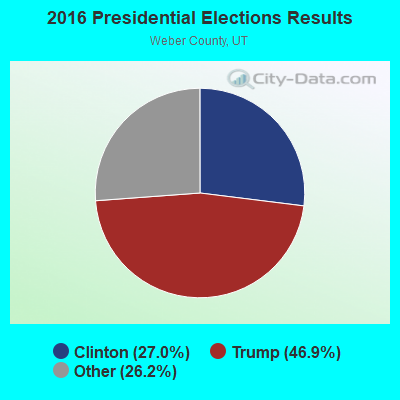

Graphs represent county-level data. Detailed 2008 Election Results
Religion statistics for Riverdale, UT (based on Weber County data)
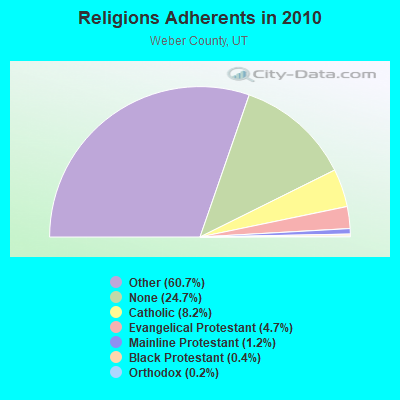
| Religion | Adherents | Congregations |
|---|---|---|
| Other | 140,427 | 324 |
| Catholic | 18,933 | 6 |
| Evangelical Protestant | 10,761 | 52 |
| Mainline Protestant | 2,761 | 11 |
| Black Protestant | 887 | 4 |
| Orthodox | 350 | 1 |
| None | 57,117 | - |
Food Environment Statistics:
| This county: | 1.35 / 10,000 pop. |
| Utah: | 1.37 / 10,000 pop. |
| Weber County: | 0.23 / 10,000 pop. |
| Utah: | 0.18 / 10,000 pop. |
| This county: | 0.72 / 10,000 pop. |
| Utah: | 0.41 / 10,000 pop. |
| Here: | 2.62 / 10,000 pop. |
| Utah: | 2.82 / 10,000 pop. |
| Here: | 4.79 / 10,000 pop. |
| State: | 5.09 / 10,000 pop. |
| Weber County: | 7.1% |
| Utah: | 6.3% |
| This county: | 25.7% |
| Utah: | 23.6% |
Health and Nutrition:
| This city: | 48.9% |
| State: | 48.9% |
| Riverdale: | 46.3% |
| State: | 47.0% |
| This city: | 28.4 |
| Utah: | 28.4 |
| Here: | 21.4% |
| State: | 21.0% |
| Riverdale: | 10.2% |
| State: | 10.3% |
| Riverdale: | 6.8 |
| State: | 6.8 |
| Here: | 32.0% |
| Utah: | 31.9% |
| Riverdale: | 57.1% |
| State: | 57.4% |
| Here: | 79.6% |
| Utah: | 80.1% |
More about Health and Nutrition of Riverdale, UT Residents
| Local government employment and payroll (March 2022) | |||||
| Function | Full-time employees | Monthly full-time payroll | Average yearly full-time wage | Part-time employees | Monthly part-time payroll |
|---|---|---|---|---|---|
| Police Protection - Officers | 19 | $130,204 | $82,234 | 0 | $0 |
| Firefighters | 12 | $68,350 | $68,350 | 9 | $8,516 |
| Parks and Recreation | 7 | $37,104 | $63,607 | 19 | $16,904 |
| Financial Administration | 3 | $23,940 | $95,760 | 3 | $5,678 |
| Other Government Administration | 3 | $31,944 | $127,776 | 13 | $29,313 |
| Police - Other | 2 | $8,968 | $53,808 | 3 | $4,650 |
| Water Supply | 2 | $7,762 | $46,572 | 0 | $0 |
| Judicial and Legal | 2 | $22,515 | $135,090 | 4 | $9,826 |
| Streets and Highways | 2 | $16,666 | $99,996 | 0 | $0 |
| Sewerage | 1 | $5,214 | $62,568 | 0 | $0 |
| Solid Waste Management | 1 | $6,026 | $72,312 | 0 | $0 |
| Other and Unallocable | 1 | $5,560 | $66,720 | 3 | $2,496 |
| Housing and Community Development (Local) | 1 | $7,652 | $91,824 | 0 | $0 |
| Fire - Other | 0 | $0 | 1 | $3,814 | |
| Totals for Government | 56 | $371,905 | $79,694 | 55 | $81,197 |
Riverdale government finances - Expenditure in 2017 (per resident):
- Construction - General - Other: $1,797,000 ($193.54)
Water Utilities: $280,000 ($30.16)
Natural Resources - Other: $21,000 ($2.26)
Sewerage: $15,000 ($1.62)
Regular Highways: $15,000 ($1.62)
Parks and Recreation: $13,000 ($1.40)
- Current Operations - Police Protection: $2,751,000 ($296.28)
Housing and Community Development: $1,581,000 ($170.27)
Local Fire Protection: $1,432,000 ($154.23)
Sewerage: $858,000 ($92.41)
Parks and Recreation: $854,000 ($91.98)
Water Utilities: $693,000 ($74.64)
Financial Administration: $660,000 ($71.08)
Regular Highways: $598,000 ($64.40)
Judicial and Legal Services: $544,000 ($58.59)
Central Staff Services: $409,000 ($44.05)
Solid Waste Management: $309,000 ($33.28)
Natural Resources - Other: $112,000 ($12.06)
- General - Interest on Debt: $14,000 ($1.51)
- Total Salaries and Wages: $4,455,000 ($479.81)
Riverdale government finances - Revenue in 2017 (per resident):
- Charges - Sewerage: $1,146,000 ($123.42)
Other: $482,000 ($51.91)
Solid Waste Management: $345,000 ($37.16)
Housing and Community Development: $135,000 ($14.54)
- Local Intergovernmental - General Local Government Support: $410,000 ($44.16)
- Miscellaneous - Fines and Forfeits: $500,000 ($53.85)
General Revenue - Other: $386,000 ($41.57)
Interest Earnings: $208,000 ($22.40)
Sale of Property: $198,000 ($21.32)
Rents: $136,000 ($14.65)
Donations From Private Sources: $1,000 ($0.11)
- Revenue - Water Utilities: $1,268,000 ($136.56)
- State Intergovernmental - Other: $1,969,000 ($212.06)
General Local Government Support: $52,000 ($5.60)
- Tax - General Sales and Gross Receipts: $6,089,000 ($655.79)
Property: $2,544,000 ($273.99)
Other License: $216,000 ($23.26)
Occupation and Business License - Other: $138,000 ($14.86)
Other Selective Sales: $14,000 ($1.51)
Riverdale government finances - Debt in 2017 (per resident):
- Long Term Debt - Beginning Outstanding - Unspecified Public Purpose: $555,000 ($59.77)
Outstanding Unspecified Public Purpose: $455,000 ($49.00)
Retired Unspecified Public Purpose: $100,000 ($10.77)
Riverdale government finances - Cash and Securities in 2017 (per resident):
- Other Funds - Cash and Securities: $3,419,000 ($368.23)
8.58% of this county's 2021 resident taxpayers lived in other counties in 2020 ($63,347 average adjusted gross income)
| Here: | 8.58% |
| Utah average: | 7.95% |
0.06% of residents moved from foreign countries ($419 average AGI)
Weber County: 0.06% Utah average: 0.02%
Top counties from which taxpayers relocated into this county between 2020 and 2021:
| from Davis County, UT | |
| from Salt Lake County, UT | |
| from Box Elder County, UT |
7.73% of this county's 2020 resident taxpayers moved to other counties in 2021 ($55,300 average adjusted gross income)
| Here: | 7.73% |
| Utah average: | 7.39% |
0.04% of residents moved to foreign countries ($368 average AGI)
Weber County: 0.04% Utah average: 0.02%
Top counties to which taxpayers relocated from this county between 2020 and 2021:
| to Davis County, UT | |
| to Salt Lake County, UT | |
| to Box Elder County, UT |
| Businesses in Riverdale, UT | ||||
| Name | Count | Name | Count | |
|---|---|---|---|---|
| AT&T | 2 | Nissan | 1 | |
| Arby's | 1 | OfficeMax | 1 | |
| Burger King | 1 | Olive Garden | 1 | |
| Carl\s Jr. | 1 | Panda Express | 1 | |
| Chick-Fil-A | 1 | Papa John's Pizza | 1 | |
| Cricket Wireless | 1 | PetSmart | 1 | |
| Discount Tire | 1 | Pier 1 Imports | 1 | |
| DressBarn | 1 | Rue21 | 1 | |
| Dressbarn | 1 | Sam's Club | 1 | |
| Famous Footwear | 1 | Sephora | 1 | |
| FedEx | 2 | Sprint Nextel | 1 | |
| Home Depot | 1 | Starbucks | 1 | |
| IHOP | 1 | Subway | 1 | |
| JCPenney | 1 | T-Mobile | 1 | |
| Jones New York | 1 | T.G.I. Driday's | 1 | |
| Justice | 1 | Target | 1 | |
| La-Z-Boy | 1 | Toyota | 1 | |
| Lane Bryant | 1 | UPS | 1 | |
| Lane Furniture | 2 | Vans | 1 | |
| Lowe's | 1 | Verizon Wireless | 2 | |
| MasterBrand Cabinets | 1 | Walmart | 1 | |
| Maurices | 1 | Wendy's | 1 | |
| McDonald's | 2 | |||
Strongest AM radio stations in Riverdale:
- KALL (700 AM; 50 kW; NORTH SALT LAKE CITY, UT; Owner: CITICASTERS LICENSES, L.P.)
- KANN (1120 AM; 10 kW; ROY, UT; Owner: FAITH COMMUNICATIONS CORPORATION)
- KLO (1430 AM; 10 kW; OGDEN, UT; Owner: KLO BROADCASTING CO.)
- KSVN (730 AM; 1 kW; OGDEN, UT; Owner: AZTECA BROADCASTING CORPORATION)
- KIQN (1010 AM; 50 kW; TOOELE, UT)
- KXOL (1660 AM; 10 kW; BRIGHAM CITY, UT; Owner: SIMMONS-SLC, LS, LLC)
- KSL (1160 AM; 50 kW; SALT LAKE CITY, UT; Owner: BONNEVILLE HOLDING COMPANY)
- KYFO (1490 AM; 1 kW; OGDEN, UT; Owner: BIBLE BROADCAST NETWORK)
- KSOS (800 AM; 10 kW; BRIGHAM CITY, UT; Owner: SIMMONS-SLC, LS, LLC)
- KZNS (1280 AM; 10 kW; SALT LAKE CITY, UT; Owner: SIMMONS-SLC, LS, LLC)
- KTKK (630 AM; 10 kW; SANDY, UT; Owner: UNITED BROADCASTING COMPANY)
- KNRS (570 AM; 5 kW; SALT LAKE CITY, UT; Owner: CITICASTERS LICENSES, L.P.)
- KBEE (860 AM; 10 kW; SALT LAKE CITY, UT; Owner: CITADEL BROADCASTING COMPANY)
Strongest FM radio stations in Riverdale:
- KYFO-FM (95.5 FM; OGDEN, UT; Owner: BIBLE BROADCASTING NETWORK, INC.)
- KCPX (105.7 FM; CENTERVILLE, UT; Owner: MERCURY BROADCASTING COMPANY, INC.)
- KUDD (107.9 FM; ROY, UT; Owner: MILLCREEK BROADCASTING, L.L.C.)
- KSOP-FM (104.3 FM; SALT LAKE CITY, UT; Owner: KSOP, INC.)
- KWKD-FM3 (102.3 FM; OGDEN, UT; Owner: MILLCREEK BROADCASTING, LLC)
- K272DP (102.3 FM; TOOELE, UT; Owner: FAMILY STATIONS, INC.)
- KUDD-FM2 (107.9 FM; OGDEN, UT; Owner: MILLCREEK BROADCASTING, LLC)
- KBZN (97.9 FM; OGDEN, UT; Owner: CAPITOL BROADCASTING, INC.)
- KRCL (90.9 FM; SALT LAKE CITY, UT; Owner: LISTENERS COMMUNITY RADIO OF UTAH)
- KBER (101.1 FM; OGDEN, UT; Owner: CITADEL BROADCASTING COMPANY)
- KISN-FM (97.1 FM; SALT LAKE CITY, UT; Owner: CLEAR CHANNEL BROADCASTING LICENSES, INC.)
- KKAT (101.9 FM; OGDEN, UT; Owner: CITICASTERS LICENSES, L.P.)
- KSFI (100.3 FM; SALT LAKE CITY, UT; Owner: SIMMONS-SLC, LS, LLC)
- KUBL-FM (93.3 FM; SALT LAKE CITY, UT; Owner: CITADEL BROADCASTING COMPANY)
- KOSY-FM (106.5 FM; SPANISH FORK, UT; Owner: MERCURY BROADCASTING COMPANY, INC.)
- KRSP-FM (103.5 FM; SALT LAKE CITY, UT; Owner: SIMMONS-SLC, LS, LLC)
- KBZN-FM1 (97.9 FM; PARK CITY, UT; Owner: CAPITOL BROADCASTING INC.)
- K201AE (88.1 FM; COALVILLE, ETC., UT; Owner: COMMUNITY WIRELESS OF PARK CITY, INC)
- KZHT-FM1 (94.9 FM; PARK CITY, UT; Owner: CITICASTERS LICENSES, L.P.)
- KUUU (92.1 FM; TOOELE, UT; Owner: MILLCREEK BROADCASTING, L.L.C.)
TV broadcast stations around Riverdale:
- KULX-CA (Channel 51; OGDEN, UT; Owner: AIRWAVES, INC.)
- KSVN-CA (Channel 49; OGDEN, UT; Owner: AZTECA BROADCASTING CORPORATION)
- K56GR (Channel 56; OGDEN, UT; Owner: TRINITY BROADCASTING NETWORK)
- K59BV (Channel 59; LAVA HOT SPRINGS, ID; Owner: STATE BOARD OF EDUCATION (IEPBS))
- KUTV (Channel 2; SALT LAKE CITY, UT; Owner: KUTV HOLDINGS, INC.)
- KPNZ (Channel 24; OGDEN, UT; Owner: UTAH COMMUNICATIONS, LLC)
- K58FT (Channel 58; HUNTSVILLE, UT; Owner: ALPHA & OMEGA COMMUNICATIONS, L.L.C.)
- K59GS (Channel 59; SALT LAKE CITY, UT; Owner: ALPHA & OMEGA COMMUNICATIONS, LLC)
- National Bridge Inventory (NBI) Statistics
- 25Number of bridges
- 325ft / 98.5mTotal length
- 764,726Total average daily traffic
- 133,303Total average daily truck traffic
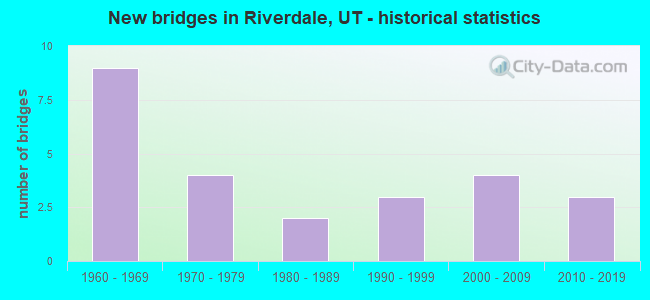
- New bridges - historical statistics
- 91960-1969
- 41970-1979
- 21980-1989
- 31990-1999
- 42000-2009
- 32010-2019
FCC Registered Antenna Towers:
25 (See the full list of FCC Registered Antenna Towers in Riverdale)FCC Registered Broadcast Land Mobile Towers:
3- Lat: 41.164833 Lon: -112.006194, Call Sign: WQCU964,
Assigned Frequencies: 462.212 MHz, 462.437 MHz, 467.212 MHz, 467.437 MHz, Grant Date: 05/13/2015, Expiration Date: 06/01/2025, Certifier: Brett Schneiter, Registrant: Federal License Management, 1784 E. 3rd Street Suite 269, Williamsport, PA 17701-3862, Phone: (570) 505-3894, Fax: (570) 651-9032, Email:
- 4185 S Riverdale Rd (Lat: 41.187222 Lon: -111.985222), Call Sign: WQHC889,
Assigned Frequencies: 467.225 MHz, 466.962 MHz, 451.487 MHz, 451.587 MHz, 451.737 MHz, Grant Date: 06/09/2017, Expiration Date: 06/29/2027, Certifier: Luann Perryman, Registrant: Bearcom Operating LLC, ., Dallas, TX 75355-9001, Phone: (800) 458-9887, Fax: (214) 355-4954, Email:
- 999 West Riverdale Road (Lat: 41.177500 Lon: -112.001944), Call Sign: WQHE540,
Assigned Frequencies: 467.762 MHz, 467.837 MHz, 467.850 MHz, 467.875 MHz, 467.900 MHz, Grant Date: 06/27/2017, Expiration Date: 07/12/2027, Certifier: Jim Fisher, Registrant: Advanced Wireless Communications, 20809 Kensington Blvd, Lakeville, MN 55044, Phone: (952) 469-5400, Fax: (952) 469-0170, Email:
FCC Registered Microwave Towers:
5- MATRIXX, 5440s 1700w (Lat: 41.165833 Lon: -112.015278), Type: Gtower, Structure height: 25.6 m, Call Sign: WQMN452,
Assigned Frequencies: 10775.0 MHz, 10855.0 MHz, 10855.0 MHz, Grant Date: 08/25/2020, Expiration Date: 09/30/2030, Certifier: Gregory M Romano, Registrant: Verizon Wireless, 5055 North Point Pkwy, Np2ne Network Engineering, Alpharetta, GA 30022, Phone: (770) 797-1070, Email:
- UT-RIV001, 5440s 1700w (Lat: 41.165833 Lon: -112.015278), Type: Ltower, Structure height: 25.6 m, Call Sign: WQOI889,
Assigned Frequencies: 18115.0 MHz, 18115.0 MHz, 18115.0 MHz, 18115.0 MHz, 18115.0 MHz, 18115.0 MHz, 18115.0 MHz, 11135.0 MHz, 11135.0 MHz, 11135.0 MHz... (+8 more), Grant Date: 11/30/2021, Expiration Date: 10/12/2031, Certifier: Brian J Lloyd, Registrant: Micronet Communications, Inc., 812 Lexington Dr, Plano, TX 75075, Phone: (972) 422-7200, Email:
- SL01134E, 4048 South Riverdale (Sl01134e) (Lat: 41.189611 Lon: -111.979028), Type: Mtower, Structure height: 30.8 m, Call Sign: WQTF530, Grant Date: 01/23/2014, Expiration Date: 01/23/2024, Cancellation Date: 12/26/2023, Certifier: David Werblow, Registrant: T-Mobile Usa, Inc., 12920 Se 38th Street, Bellevue, WA 98006, Phone: (425) 383-8401, Email:
- SL01530B, 5440 S 1700 W (Lat: 41.165278 Lon: -112.014444), Type: Mtower, Structure height: 18.2 m, Overall height: 20.4 m, Call Sign: WQTF531, Grant Date: 01/23/2014, Expiration Date: 01/23/2024, Cancellation Date: 12/26/2023, Certifier: David Werblow, Registrant: T-Mobile Usa, Inc., 12920 Se 38th Street, Bellevue, WA 98006, Phone: (425) 383-8401, Email:
- SAL RIVERDAL, 985 W Riverdale Rd (Lat: 41.177111 Lon: -112.002139), Type: Building, Structure height: 6.1 m, Call Sign: WQVC963,
Assigned Frequencies: 21870.0 MHz, Grant Date: 01/06/2015, Expiration Date: 01/06/2025, Cancellation Date: 10/27/2021, Certifier: Gregory M Romano, Registrant: Verizon, 1300 I St Nw - Suite 500 East, Washington, DC 20005, Phone: (202) 515-2453, Email:
FCC Registered Amateur Radio Licenses:
42 (See the full list of FCC Registered Amateur Radio Licenses in Riverdale)FAA Registered Aircraft:
6- Aircraft: MOONEY AIRCRAFT CORP. M20K (Category: Land, Seats: 4, Weight: Up to 12,499 Pounds), Engine: CONT MOTOR TSIO-360 SER (225 HP) (Reciprocating)
N-Number: 1171G, N1171G, N-1171G, Serial Number: 25-0706, Year manufactured: 1982, Airworthiness Date: 09/14/1982, Certificate Issue Date: 05/15/2019
Registrant (Individual): Oscar V Thornock, 4468 S 1150 W, Riverdale, UT 84405 - Aircraft: BEECH H35 (Category: Land, Seats: 4, Weight: Up to 12,499 Pounds, Speed: 131 mph), Engine: CONT MOTOR I0-470 SERIES (260 HP) (Reciprocating)
N-Number: 5467D, N5467D, N-5467D, Serial Number: D-4973, Year manufactured: 1957, Airworthiness Date: 10/20/1967, Certificate Issue Date: 07/16/2001
Registrant (Individual): Warren L Fitzgerald, 683 Coachman Way, Riverdale, UT 84405 - Aircraft: CESSNA 172N (Category: Land, Seats: 4, Weight: Up to 12,499 Pounds, Speed: 105 mph), Engine: LYCOMING 0-320 SERIES (180 HP) (Reciprocating)
N-Number: 734VE, N734VE, N-734VE, Serial Number: 17269142, Year manufactured: 1977, Airworthiness Date: 06/15/1977, Certificate Issue Date: 03/09/2019
Registrant (LLC): Hiro's Aircraft Leasing LLC, 627 W 3700 S, Riverdale, UT 84405 - Aircraft: CESSNA 172B (Category: Land, Seats: 4, Weight: Up to 12,499 Pounds, Speed: 105 mph), Engine: CONT MOTOR 0-300 SER (145 HP) (Reciprocating)
N-Number: 8047X, N8047X, N-8047X, Serial Number: 17248547, Year manufactured: 1961, Airworthiness Date: 05/13/1961, Certificate Issue Date: 03/16/2004
Registrant (Individual): Warren L Fitzgerald, 683 Coachman Way, Riverdale, UT 84405 - Aircraft: LONGHURST SHELDON LONGHURST 2000 (Category: Land, Seats: 2, Weight: Up to 12,499 Pounds), Engine: SUBARU ALL MDLS A/B (400 HP) (Reciprocating)
N-Number: 6078F, N6078F, N-6078F, Serial Number: H2-00-11-476, Year manufactured: 2001, Airworthiness Date: 05/31/2002, Certificate Issue Date: 12/27/2000
Registrant (Individual): Sheldon Longhurst, 4042 Pacific Ave Ste 2, Riverdale, UT 84405 - Aircraft: BEECH B23 (Category: Land, Seats: 4, Weight: Up to 12,499 Pounds, Speed: 116 mph), Engine: LYCOMING O&VO-360 SER (180 HP) (Reciprocating)
N-Number: 7635R, N7635R, N-7635R, Serial Number: M-1256, Year manufactured: 1969, Certificate Issue Date: 07/01/1976
Registrant (Individual): John P Cypers, 4875 S 1750 W, Riverdale, UT 84403
Deregistered: Cancel Date: 02/04/2017
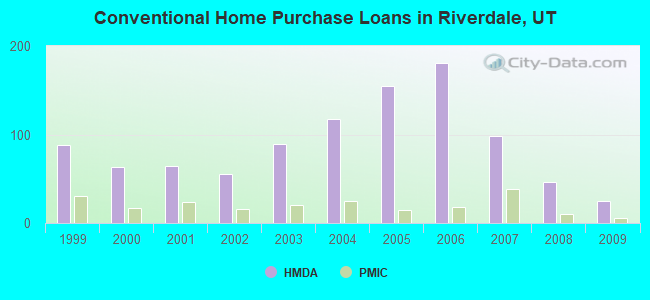
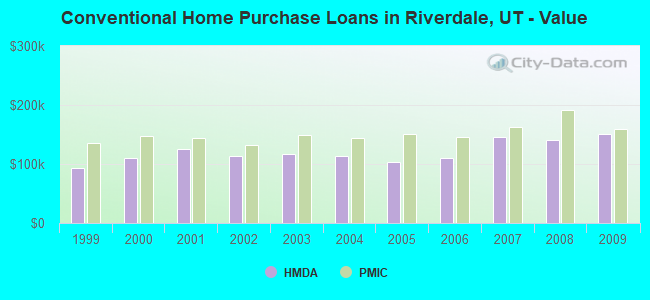
| Home Mortgage Disclosure Act Aggregated Statistics For Year 2009 (Based on 1 partial tract) | ||||||||||||
| A) FHA, FSA/RHS & VA Home Purchase Loans | B) Conventional Home Purchase Loans | C) Refinancings | D) Home Improvement Loans | F) Non-occupant Loans on < 5 Family Dwellings (A B C & D) | G) Loans On Manufactured Home Dwelling (A B C & D) | |||||||
|---|---|---|---|---|---|---|---|---|---|---|---|---|
| Number | Average Value | Number | Average Value | Number | Average Value | Number | Average Value | Number | Average Value | Number | Average Value | |
| LOANS ORIGINATED | 32 | $176,896 | 25 | $150,268 | 253 | $153,745 | 6 | $44,547 | 9 | $127,181 | 3 | $39,340 |
| APPLICATIONS APPROVED, NOT ACCEPTED | 2 | $162,715 | 2 | $224,760 | 21 | $154,923 | 2 | $8,680 | 0 | $0 | 0 | $0 |
| APPLICATIONS DENIED | 5 | $199,768 | 3 | $157,073 | 56 | $165,223 | 2 | $9,110 | 3 | $112,813 | 0 | $0 |
| APPLICATIONS WITHDRAWN | 3 | $133,640 | 2 | $81,140 | 41 | $168,628 | 3 | $13,307 | 1 | $173,560 | 1 | $39,920 |
| FILES CLOSED FOR INCOMPLETENESS | 1 | $247,320 | 0 | $0 | 6 | $159,097 | 0 | $0 | 0 | $0 | 0 | $0 |
Detailed HMDA statistics for the following Tracts: 2105.01
| Private Mortgage Insurance Companies Aggregated Statistics For Year 2009 (Based on 1 partial tract) | ||||||
| A) Conventional Home Purchase Loans | B) Refinancings | C) Non-occupant Loans on < 5 Family Dwellings (A & B) | ||||
|---|---|---|---|---|---|---|
| Number | Average Value | Number | Average Value | Number | Average Value | |
| LOANS ORIGINATED | 6 | $159,965 | 11 | $186,419 | 0 | $0 |
| APPLICATIONS APPROVED, NOT ACCEPTED | 3 | $157,940 | 2 | $160,545 | 0 | $0 |
| APPLICATIONS DENIED | 0 | $0 | 3 | $204,223 | 1 | $138,850 |
| APPLICATIONS WITHDRAWN | 0 | $0 | 4 | $220,855 | 0 | $0 |
| FILES CLOSED FOR INCOMPLETENESS | 0 | $0 | 0 | $0 | 0 | $0 |
Detailed PMIC statistics for the following Tracts: 2105.01
2002 - 2018 National Fire Incident Reporting System (NFIRS) incidents
- Fire incident types reported to NFIRS in Riverdale, UT
- 20238.6%Outside Fires
- 15128.9%Structure Fires
- 11722.4%Other
- 5310.1%Mobile Property/Vehicle Fires
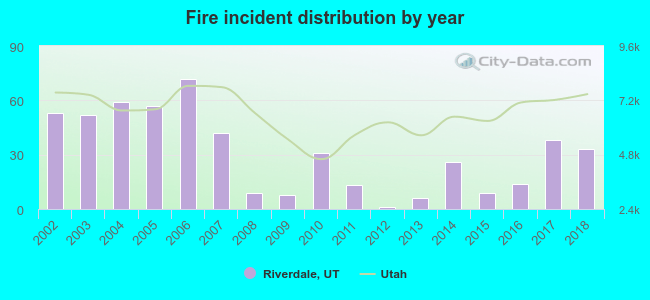 Based on the data from the years 2002 - 2018 the average number of fire incidents per year is 31. The highest number of reported fires - 72 took place in 2006, and the least - 1 in 2012. The data has a declining trend.
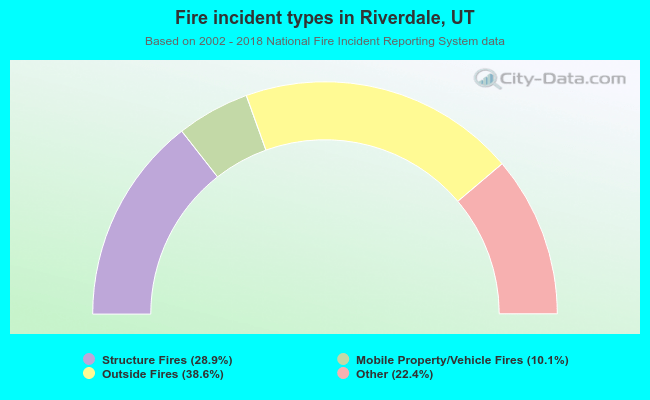 When looking into fire subcategories, the most reports belonged to: Outside Fires (38.6%), and Structure Fires (28.9%).
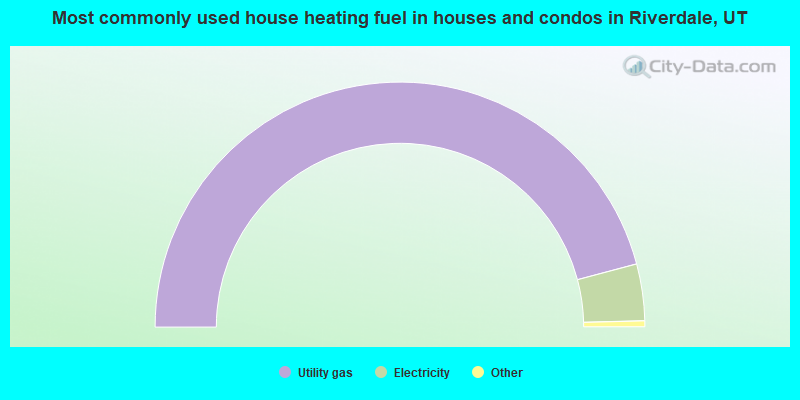
- 91.8%Utility gas
- 7.5%Electricity
- 0.6%Bottled, tank, or LP gas
- 0.2%Solar energy
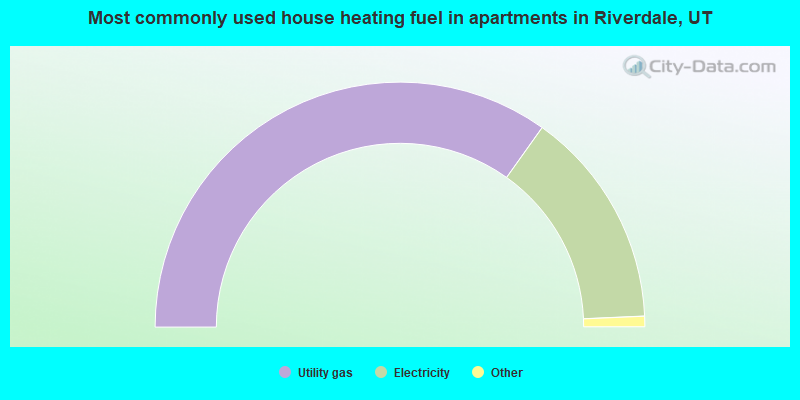
- 69.8%Utility gas
- 28.9%Electricity
- 0.9%Bottled, tank, or LP gas
- 0.3%No fuel used
Riverdale compared to Utah state average:
- Unemployed percentage below state average.
- Black race population percentage significantly below state average.
- Hispanic race population percentage above state average.
- Length of stay since moving in significantly above state average.

|
|
Total of 17 patent applications in 2008-2024.