Perris Valley, California
Submit your own pictures of this place and show them to the world
- OSM Map
- General Map
- Google Map
- MSN Map

| Males: 92,994 | |
| Females: 97,594 |
| Median resident age: | 34.1 years |
| California median age: | 33.3 years |
Zip code: 92570
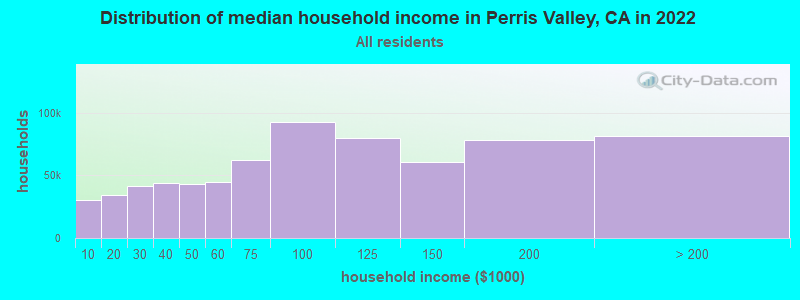
| Perris Valley: | $78,145 |
| CA: | $91,551 |
Estimated per capita income in 2022: $29,708 (it was $15,654 in 2000)
Perris Valley CCD income, earnings, and wages data
Estimated median house or condo value in 2022: $449,668 (it was $109,300 in 2000)
| Perris Valley: | $449,668 |
| CA: | $715,900 |
Mean prices in 2022: all housing units: $586,167; detached houses: $631,165; townhouses or other attached units: $625,082; in 2-unit structures: $464,831; in 3-to-4-unit structures: $482,529; in 5-or-more-unit structures: $526,423; mobile homes: $178,284; occupied boats, rvs, vans, etc.: $86,227
Detailed information about poverty and poor residents in Perris Valley, CA
Compare current foreclosures near Perris Valley, CA:
| Photo | Address | Area | Beds / Baths | Price | Details |
|---|---|---|---|---|---|

|
#1
Camino Cristal
Menifee, CA 92584
|
2,337 sq. feet
|
2 baths 5 beds |
$440,900
|
show details |

|
#2
Vellanto Way
Moreno Valley, CA 92553
|
1,316 sq. feet
|
2 baths 3 beds |
$480,000
|
show details |

|
#3
Quail Creek Lane
Wildomar, CA 92595
|
1,891 sq. feet
|
2 baths 3 beds |
$675,000
|
show details |

|
#4
Ryan Ave
Lake Elsinore, CA 92530
|
- sq. feet
|
2 baths 2 beds |
$509,900
|
show details |

|
#5
Periwinkle Way
Lake Elsinore, CA 92532
|
2,858 sq. feet
|
3 baths 5 beds |
show details | |

|
#6
Cleveland Ave
Riverside, CA 92503
|
2,302 sq. feet
|
2 baths 4 beds |
show details | |

|
#7
Juniper Flats Rd
Nuevo, CA 92567
|
2,555 sq. feet
|
2 baths 3 beds |
show details | |

|
#8
Chervil Way
Lake Elsinore, CA 92532
|
2,533 sq. feet
|
3 baths 4 beds |
show details | |

|
#9
Brookside Ln
Beaumont, CA 92223
|
2,494 sq. feet
|
2 baths 4 beds |
show details | |

|
#10
Rosy Sky Cir
Riverside, CA 92503
|
2,093 sq. feet
|
2 baths 4 beds |
show details |
| Photo | Address | Area | Beds / Baths | Price | Details |
|---|---|---|---|---|---|

|
#11
Westlake Dr
Menifee, CA 92584
|
1,746 sq. feet
|
2 baths 3 beds |
show details | |

|
#12
Lomas St
Hemet, CA 92544
|
2,176 sq. feet
|
4 baths 4 beds |
show details | |

|
#13
Bradley Rd
Sun City, CA 92586
|
1,066 sq. feet
|
2 baths 2 beds |
show details | |

|
#14
Bonica St
Lake Elsinore, CA 92532
|
2,867 sq. feet
|
3 baths 4 beds |
show details | |

|
#15
Duncan Dr
Moreno Valley, CA 92555
|
3,570 sq. feet
|
3 baths 6 beds |
show details | |

|
#16
Avenida Bonita
Murrieta, CA 92562
|
3,359 sq. feet
|
4 baths 4 beds |
show details | |

|
#17
Carnation Way
Lake Elsinore, CA 92532
|
- sq. feet
|
2 baths 3 beds |
show details | |

|
#18
Brentwood Way
Hemet, CA 92545
|
2,040 sq. feet
|
3 baths 3 beds |
show details | |

|
#19
Bell Cir
Winchester, CA 92596
|
2,565 sq. feet
|
3 baths 3 beds |
show details | |

|
#20
Grove Dr
Riverside, CA 92503
|
3,269 sq. feet
|
4 baths 4 beds |
show details |
| Photo | Address | Area | Beds / Baths | Price | Details |
|---|---|---|---|---|---|

|
#21
Canyon Estates Dr
Lake Elsinore, CA 92532
|
2,358 sq. feet
|
2 baths 6 beds |
show details | |

|
#22
Windsong Ln
San Jacinto, CA 92582
|
1,662 sq. feet
|
2 baths 4 beds |
show details | |

|
#23
Brutus Way
Beaumont, CA 92223
|
3,396 sq. feet
|
2 baths 4 beds |
show details | |

|
#24
Villa Valtelena
Lake Elsinore, CA 92532
|
2,589 sq. feet
|
3 baths 4 beds |
show details | |

|
#25
Plymouth Way
Temecula, CA 92591
|
2,203 sq. feet
|
2 baths 3 beds |
show details | |

|
#26
Oak Cliff Dr
Temecula, CA 92591
|
1,262 sq. feet
|
2 baths 3 beds |
show details | |

|
#27
Davis St
Moreno Valley, CA 92557
|
1,126 sq. feet
|
2 baths 3 beds |
show details | |

|
#28
Calle Arrebol
Murrieta, CA 92563
|
1,810 sq. feet
|
2 baths 2 beds |
show details | |

|
#29
Sweet Magnolia Way
Murrieta, CA 92563
|
3,732 sq. feet
|
4 baths 4 beds |
show details | |

|
#30
Long St
Hemet, CA 92543
|
1,464 sq. feet
|
2 baths 2 beds |
show details |
| Photo | Address | Area | Beds / Baths | Price | Details |
|---|---|---|---|---|---|

|
#31
Eleanor Ln
Moreno Valley, CA 92551
|
1,123 sq. feet
|
2 baths 3 beds |
show details | |

|
#32
Camino De Oro
San Jacinto, CA 92583
|
1,332 sq. feet
|
2 baths 2 beds |
show details | |

|
#33
Almont Way
Sun City, CA 92585
|
2,865 sq. feet
|
3 baths 6 beds |
show details | |

|
#34
Whieldon Dr
Perris, CA 92571
|
2,177 sq. feet
|
2 baths 4 beds |
show details | |

|
#35
Bonnie Lea Dr
Lake Elsinore, CA 92530
|
702 sq. feet
|
1 baths 1 beds |
show details | |

|
#36
Fortuna St
Perris, CA 92571
|
- sq. feet
|
2 baths 3 beds |
show details | |

|
#37
Coral Ave
Hemet, CA 92543
|
1,034 sq. feet
|
2 baths 2 beds |
show details | |

|
#38
Via Verde
Lake Elsinore, CA 92530
|
1,274 sq. feet
|
2 baths 3 beds |
show details | |

|
#39
La Costa Alta Dr
Moreno Valley, CA 92555
|
4,817 sq. feet
|
4 baths 6 beds |
show details | |

|
#40
Hibiscus
Lake Elsinore, CA 92530
|
3,014 sq. feet
|
5 baths 5 beds |
show details |
| Photo | Address | Area | Beds / Baths | Price | Details |
|---|---|---|---|---|---|

|
#41
Mcguire Rd
Perris, CA 92570
|
6,347 sq. feet
|
4 baths 5 beds |
show details | |

|
#42
E Acacia Ave
Hemet, CA 92543
|
988 sq. feet
|
1 baths 4 beds |
show details | |

|
#43
Broadleaf Ln
Moreno Valley, CA 92553
|
2,074 sq. feet
|
3 baths 4 beds |
show details | |

|
#44
Titus Ct
San Jacinto, CA 92583
|
1,814 sq. feet
|
3 baths 4 beds |
show details | |

|
#45
Almond Dr
Perris, CA 92571
|
1,516 sq. feet
|
2 baths 3 beds |
show details | |

|
#46
Mount Vernon St
Riverside, CA 92504
|
1,505 sq. feet
|
2 baths 4 beds |
show details | |

|
#47
Tierra Shores Ln
Menifee, CA 92584
|
1,979 sq. feet
|
2 baths 3 beds |
show details | |

|
#48
W Westmont Ave
Hemet, CA 92543
|
1,218 sq. feet
|
2 baths 2 beds |
show details | |

|
#49
Lake Vista Rd
Moreno Valley, CA 92557
|
2,284 sq. feet
|
3 baths 4 beds |
show details | |

|
Check over 1 million property listings on Foreclosure.com!
|
browse all offers | |||

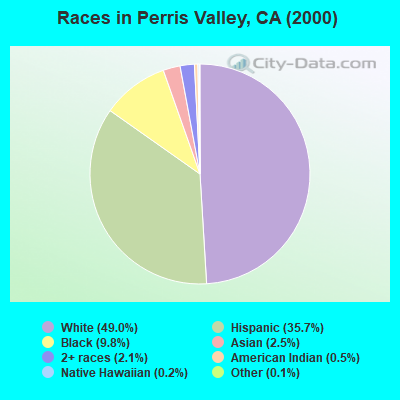
- 70,81449.0%White alone
- 51,61935.7%Hispanic
- 14,2209.8%Black alone
- 3,5632.5%Asian alone
- 3,0852.1%Two or more races
- 7210.5%American Indian alone
- 3090.2%Native Hawaiian and Other
Pacific Islander alone - 2020.1%Other race alone
 Recent articles from our blog. Our writers, many of them Ph.D. graduates or candidates, create easy-to-read articles on a wide variety of topics.
Current Local Time: PST time zone
Land area: 276.5 square miles.
Population density: 689 people per square mile (low).
| Perris Valley CCD: | 1.1% ($1,151) |
| California: | 0.8% ($1,564) |
Nearest city with pop. 200,000+: Riverside, CA  (16.6 miles , pop. 255,166).
Nearest city with pop. 1,000,000+: San Diego, CA (68.7 miles , pop. 1,223,400).
Nearest cities:
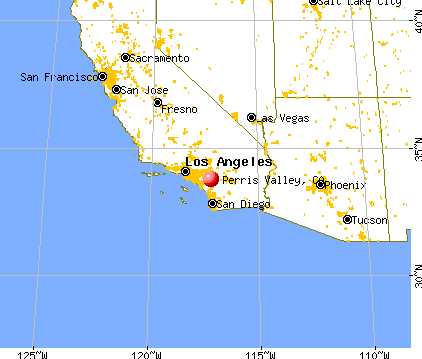
), ), Latitude: 33.77 N, Longitude: 117.20 W
Area code commonly used in this area: 909

| Here: | 5.2% |
| California: | 5.1% |
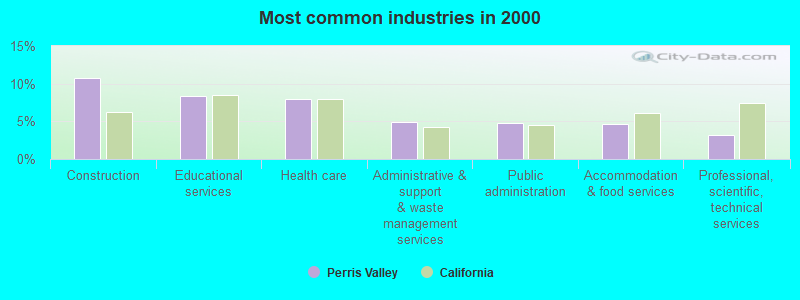
- Construction (10.8%)
- Educational services (8.3%)
- Health care (8.0%)
- Administrative & support & waste management services (4.9%)
- Public administration (4.8%)
- Accommodation & food services (4.7%)
- Professional, scientific, technical services (3.1%)
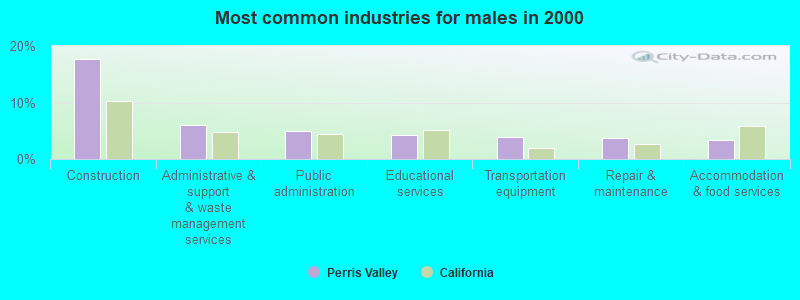
- Construction (17.8%)
- Administrative & support & waste management services (6.0%)
- Public administration (5.0%)
- Educational services (4.3%)
- Transportation equipment (3.9%)
- Repair & maintenance (3.7%)
- Accommodation & food services (3.4%)
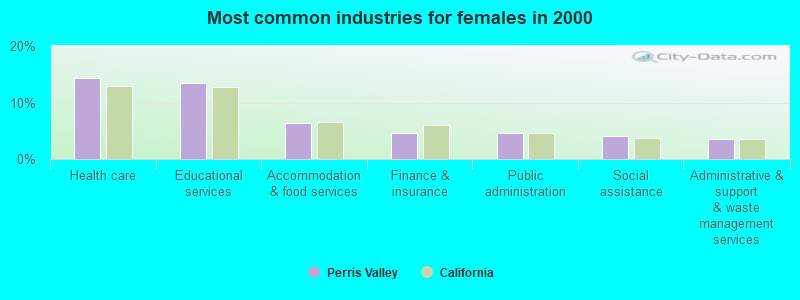
- Health care (14.4%)
- Educational services (13.5%)
- Accommodation & food services (6.4%)
- Finance & insurance (4.5%)
- Public administration (4.5%)
- Social assistance (4.1%)
- Administrative & support & waste management services (3.5%)
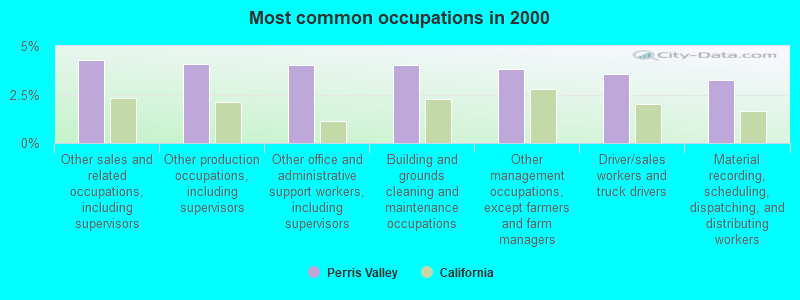
- Other sales and related occupations, including supervisors (4.3%)
- Other production occupations, including supervisors (4.1%)
- Other office and administrative support workers, including supervisors (4.0%)
- Building and grounds cleaning and maintenance occupations (4.0%)
- Other management occupations, except farmers and farm managers (3.8%)
- Driver/sales workers and truck drivers (3.5%)
- Material recording, scheduling, dispatching, and distributing workers (3.2%)
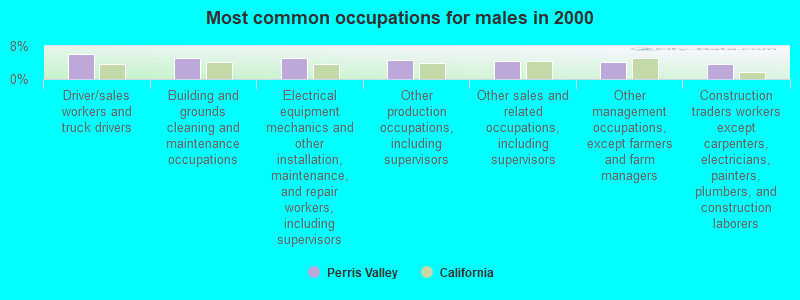
- Driver/sales workers and truck drivers (6.1%)
- Building and grounds cleaning and maintenance occupations (5.1%)
- Electrical equipment mechanics and other installation, maintenance, and repair workers, including supervisors (5.0%)
- Other production occupations, including supervisors (4.6%)
- Other sales and related occupations, including supervisors (4.3%)
- Other management occupations, except farmers and farm managers (4.1%)
- Construction traders workers except carpenters, electricians, painters, plumbers, and construction laborers (3.7%)
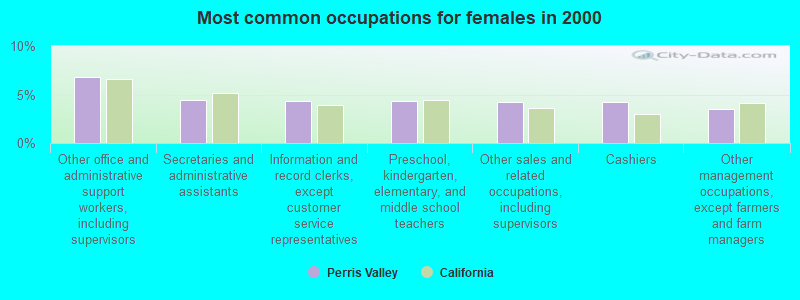
- Other office and administrative support workers, including supervisors (6.8%)
- Secretaries and administrative assistants (4.4%)
- Information and record clerks, except customer service representatives (4.3%)
- Preschool, kindergarten, elementary, and middle school teachers (4.3%)
- Other sales and related occupations, including supervisors (4.3%)
- Cashiers (4.2%)
- Other management occupations, except farmers and farm managers (3.5%)
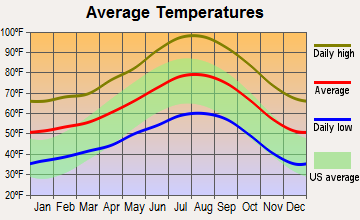
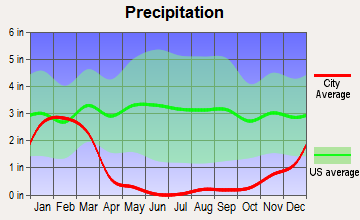
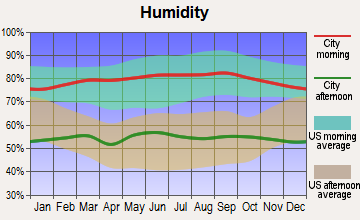
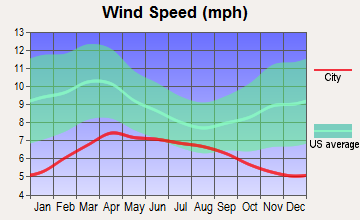
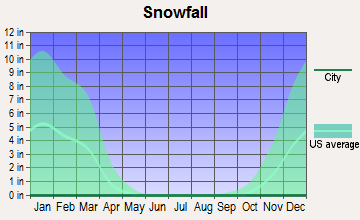
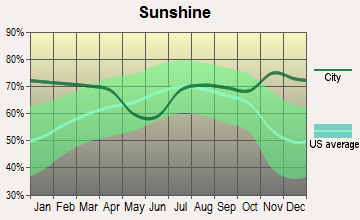
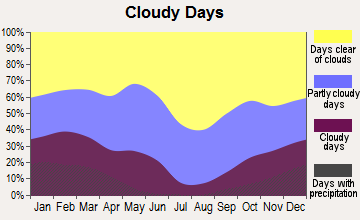
Average climate in Perris Valley, California
Based on data reported by over 4,000 weather stations
(lower is better)
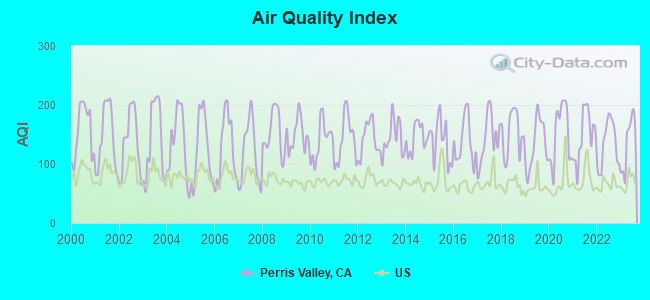
Air Quality Index (AQI) level in 2023 was 136. This is significantly worse than average.
| City: | 136 |
| U.S.: | 73 |
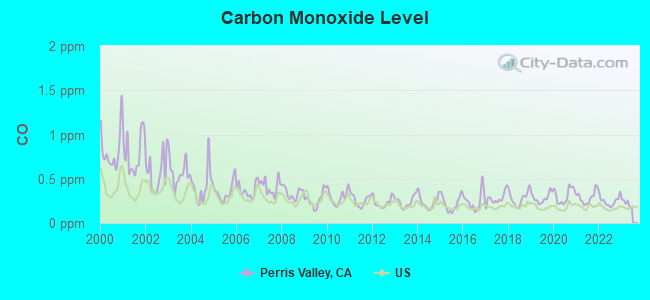
Carbon Monoxide (CO) [ppm] level in 2022 was 0.248. This is about average. Closest monitor was 2.0 miles away from the city center.
| City: | 0.248 |
| U.S.: | 0.251 |
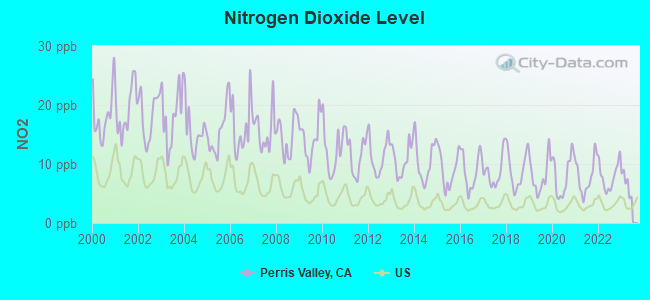
Nitrogen Dioxide (NO2) [ppb] level in 2022 was 7.90. This is significantly worse than average. Closest monitor was 2.0 miles away from the city center.
| City: | 7.90 |
| U.S.: | 5.11 |
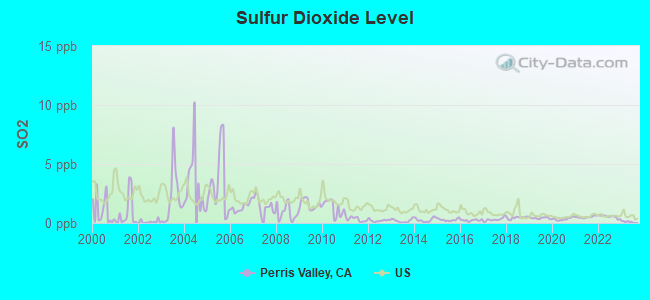
Sulfur Dioxide (SO2) [ppb] level in 2022 was 0.541. This is significantly better than average. Closest monitor was 16.7 miles away from the city center.
| City: | 0.541 |
| U.S.: | 1.515 |
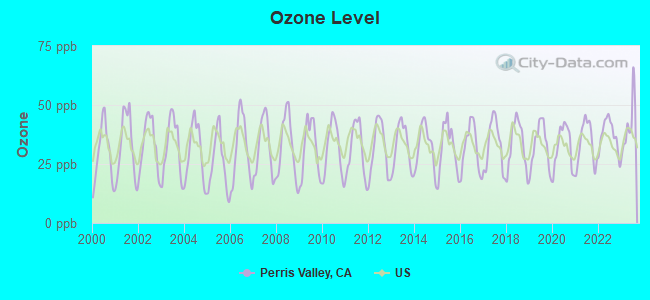
Ozone [ppb] level in 2023 was 41.4. This is worse than average. Closest monitor was 2.0 miles away from the city center.
| City: | 41.4 |
| U.S.: | 33.3 |
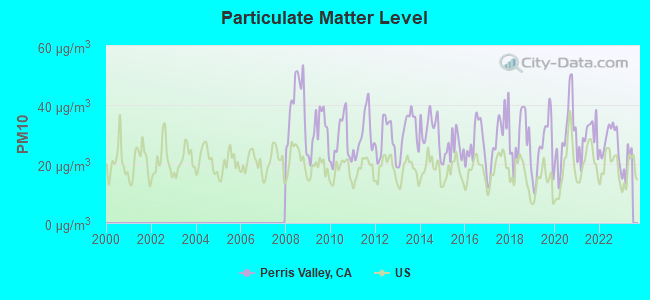
Particulate Matter (PM10) [µg/m3] level in 2022 was 27.9. This is significantly worse than average. Closest monitor was 2.0 miles away from the city center.
| City: | 27.9 |
| U.S.: | 19.2 |
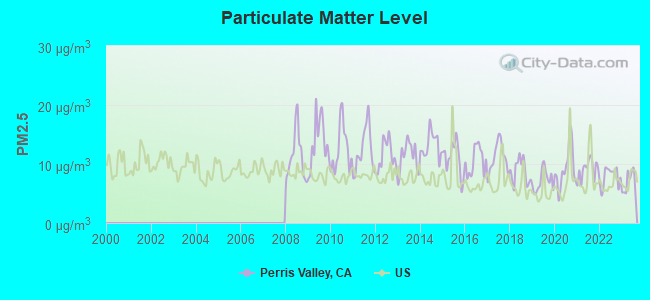
Particulate Matter (PM2.5) [µg/m3] level in 2023 was 6.88. This is about average. Closest monitor was 16.7 miles away from the city center.
| City: | 6.88 |
| U.S.: | 8.11 |
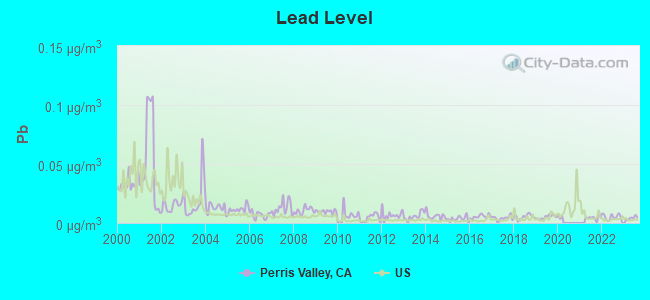
Lead (Pb) [µg/m3] level in 2023 was 0.00426. This is significantly better than average. Closest monitor was 2.0 miles away from the city center.
| City: | 0.00426 |
| U.S.: | 0.00931 |
Earthquake activity:
Perris Valley-area historical earthquake activity is significantly above California state average. It is 7076% greater than the overall U.S. average.On 6/28/1992 at 11:57:34, a magnitude 7.6 (6.2 MB, 7.6 MS, 7.3 MW, Depth: 0.7 mi, Class: Major, Intensity: VIII - XII) earthquake occurred 47.7 miles away from the city center, causing 3 deaths (1 shaking deaths, 2 other deaths) and 400 injuries, causing $100,000,000 total damage and $40,000,000 insured losses
On 7/21/1952 at 11:52:14, a magnitude 7.7 (7.7 UK) earthquake occurred 133.3 miles away from the city center, causing $50,000,000 total damage
On 10/16/1999 at 09:46:44, a magnitude 7.4 (6.3 MB, 7.4 MS, 7.2 MW, 7.3 ML) earthquake occurred 67.5 miles away from the city center
On 5/19/1940 at 04:36:40, a magnitude 7.2 (7.2 UK) earthquake occurred 94.7 miles away from Perris Valley center, causing $33,000,000 total damage
On 4/21/1918 at 22:32:30, a magnitude 6.8 (6.8 UK, Class: Strong, Intensity: VII - IX) earthquake occurred 14.1 miles away from Perris Valley center
On 6/28/1992 at 15:05:30, a magnitude 6.9 (6.3 MB, 6.7 MS, 6.5 MW, 6.9 ME, Depth: 3.1 mi) earthquake occurred 41.9 miles away from Perris Valley center
Magnitude types: body-wave magnitude (MB), energy magnitude (ME), local magnitude (ML), surface-wave magnitude (MS), moment magnitude (MW)
Natural disasters:
The number of natural disasters in Riverside County (46) is a lot greater than the US average (15).Major Disasters (Presidential) Declared: 27
Emergencies Declared: 1
Causes of natural disasters: Fires: 22, Floods: 20, Storms: 8, Winter Storms: 8, Landslides: 6, Mudslides: 5, Heavy Rains: 2, Earthquake: 1, Flash Flood: 1, Freeze: 1, Hurricane: 1, Tornado: 1, Tropical Storm: 1, Other: 1 (Note: some incidents may be assigned to more than one category).
Hospitals and medical centers near Perris Valley:
- CENTINELA GRAND INC (Nursing Home, about 4 miles away; PERRIS, CA)
- LIFE CARE CENTER OF MENIFEE (Nursing Home, about 4 miles away; SUN CITY, CA)
- HOSPICE OF THE VALLEYS (Hospital, about 4 miles away; SUN CITY, CA)
- GENTIVA HEALTH SERVICES (PARENT) (Home Health Center, about 7 miles away; MENIFEE, CA)
- HOPE HOSPICE AND HEALTHCARE, INC (Hospital, about 7 miles away; SUN CITY, CA)
- SHEILA MARIE HOUSE (Hospital, about 8 miles away; MORENO VALLEY, CA)
- KAISER FOUNDATION HOSPITAL-MORENO VALLEY Acute Care Hospitals (about 9 miles away; MORENO VALLEY, CA)
Colleges/universities with over 2000 students nearest to Perris Valley:
- Moreno Valley College (about 8 miles; Moreno Valley, CA; Full-time enrollment: 4,650)
- Mt San Jacinto Community College District (about 14 miles; San Jacinto, CA; FT enrollment: 8,426)
- University of California-Riverside (about 16 miles; Riverside, CA; FT enrollment: 20,647)
- California Baptist University (about 17 miles; Riverside, CA; FT enrollment: 6,085)
- Riverside City College (about 18 miles; Riverside, CA; FT enrollment: 10,661)
- Crafton Hills College (about 20 miles; Yucaipa, CA; FT enrollment: 3,222)
- La Sierra University (about 20 miles; Riverside, CA; FT enrollment: 2,205)
Points of interest:
Notable locations in Perris Valley: Wagonwheel Ranch (A), Rancho Loma De Oro (B), Morris Washington Ranch (C), Hammack Ranch (D), Mayer Farms (E), Menifee-Antelope Community Hall (F), Ethanac Siding (G), Rancho de las Piedras (H), Highland Palm Golf Course (I), Sun City Golf Club North Course (J), Sun City Golf Course (K), Menifee Lakes Country Club (L), Canyon Lake Country Club (M), Audie Murphy Ranch (N), Perris Valley Hot Air Ballooning and Parachute Center (O), Naked City Campground (P), McCanna Ranch (Q), May Ranch (R), MacLean Ranch (S), Figadota Farm (T). Display/hide their locations on the map
Shopping Centers: Sun City Shopping Center (1), Newport Plaza Shopping Center (2), Menifee Town Center Shopping Center (3), Spectrum Shopping Center (4), Perris Town Center Shopping Center (5), Woodboro Avenue Shopping Center (6). Display/hide their locations on the map
Churches in Perris Valley include: Bethel Church (A), Agape Christian Center (B), Highland Baptist Church (C), Lord of Life Lutheran Church (D), Good Hope Missionary Baptist Church (E), Higher Ground Baptist Church (F), Lighthouse Community Church (G), Bible Way Missionary Church (H), Nuevo Community Church (I). Display/hide their locations on the map
Cemetery: Perris Valley Cemetery (1). Display/hide its location on the map
Reservoirs: Diamond Valley Lake (A), Canyon Lake (B), Perris Reservoir (C), Railroad Reservoir (D), Ski Land Lake (E). Display/hide their locations on the map
Parks in Perris Valley include: Banta Beatty Park (1), Maze Stone Historical Marker (2), Morrison Park (3), Pedrorena Park (4), Upland Game Hunting Area (5), Victoriano Park (6), Hartford Spring County Park (7), Motte Rimrock Reserve (8), Lake Perris State Recreation Area (9). Display/hide their locations on the map
Beaches: Bernasconi Beach (A), Moreno Beach (B), Perris Beach (C). Display/hide their locations on the map
| This place: | 3.4 people |
| California: | 2.9 people |
| This place: | 78.8% |
| Whole state: | 68.7% |
| This place: | 6.8% |
| Whole state: | 7.2% |
Likely homosexual households (counted as self-reported same-sex unmarried-partner households)
- Lesbian couples: 0.4% of all households
- Gay men: 0.3% of all households
| This place: | 15.2% |
| Whole state: | 14.2% |
| This place: | 6.2% |
| Whole state: | 6.3% |
People in group quarters in Perris Valley in 2010:
- 278 people in group homes intended for adults
- 177 people in nursing facilities/skilled-nursing facilities
- 132 people in other noninstitutional facilities
- 72 people in workers' group living quarters and job corps centers
- 63 people in residential treatment centers for adults
- 40 people in group homes for juveniles (non-correctional)
- 3 people in correctional residential facilities
- 3 people in residential treatment centers for juveniles (non-correctional)
People in group quarters in Perris Valley in 2000:
- 367 people in nursing homes
- 317 people in other group homes
- 108 people in homes or halfway houses for drug/alcohol abuse
- 63 people in other noninstitutional group quarters
- 26 people in homes for the mentally retarded
- 18 people in college dormitories (includes college quarters off campus)
- 11 people in short-term care, detention or diagnostic centers for delinquent children
- 6 people in religious group quarters
- 3 people in other workers' dormitories
For population 15 years and over in Perris Valley:
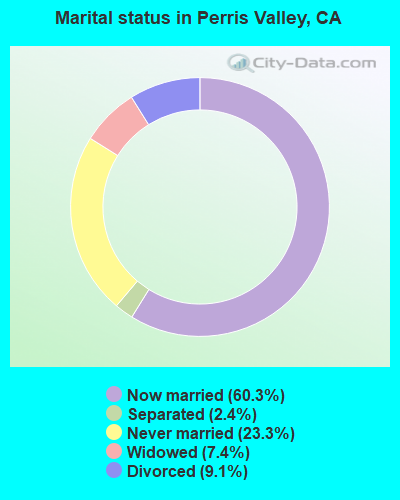
- Never married: 23.3%
- Now married: 60.3%
- Separated: 2.4%
- Widowed: 7.4%
- Divorced: 9.1%
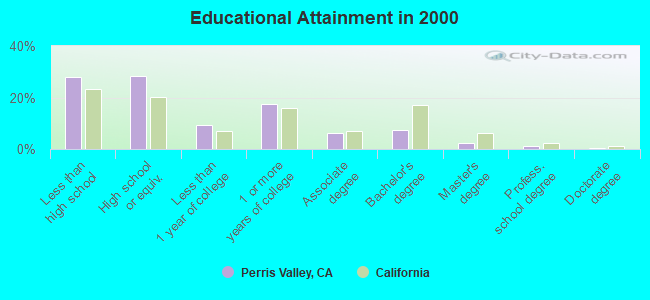
For population 25 years and over in Perris Valley:
- High school or higher: 72.2%
- Bachelor's degree or higher: 11.1%
- Graduate or professional degree: 3.7%
- Unemployed: 9.1%
- Mean travel time to work (commute): 36.2 minutes
| Here: | 14.1 |
| California average: | 16.1 |


Graphs represent county-level data. Detailed 2008 Election Results
Religion statistics for Perris Valley, CA (based on Riverside County data)


| Religion | Adherents | Congregations |
|---|---|---|
| Catholic | 602,765 | 51 |
| Evangelical Protestant | 240,306 | 741 |
| Other | 77,581 | 194 |
| Mainline Protestant | 29,535 | 103 |
| Black Protestant | 19,170 | 40 |
| Orthodox | 3,647 | 11 |
| None | 1,216,637 | - |
Food Environment Statistics:
| Riverside County: | 1.60 / 10,000 pop. |
| State: | 2.14 / 10,000 pop. |
| Riverside County: | 0.05 / 10,000 pop. |
| California: | 0.04 / 10,000 pop. |
| Riverside County: | 0.44 / 10,000 pop. |
| California: | 0.62 / 10,000 pop. |
| Here: | 1.51 / 10,000 pop. |
| State: | 1.49 / 10,000 pop. |
| Riverside County: | 5.45 / 10,000 pop. |
| California: | 7.42 / 10,000 pop. |
| Here: | 7.7% |
| California: | 7.3% |
| Riverside County: | 24.5% |
| California: | 21.3% |
| This county: | 15.2% |
| California: | 17.9% |
7.19% of this county's 2021 resident taxpayers lived in other counties in 2020 ($71,521 average adjusted gross income)
| Here: | 7.19% |
| California average: | 5.19% |
0.03% of residents moved from foreign countries ($210 average AGI)
Riverside County: 0.03% California average: 0.03%
Top counties from which taxpayers relocated into this county between 2020 and 2021:
| from Los Angeles County, CA | |
| from San Bernardino County, CA | |
| from Orange County, CA |
6.28% of this county's 2020 resident taxpayers moved to other counties in 2021 ($64,593 average adjusted gross income)
| Here: | 6.28% |
| California average: | 6.14% |
0.02% of residents moved to foreign countries ($200 average AGI)
Riverside County: 0.02% California average: 0.02%
Top counties to which taxpayers relocated from this county between 2020 and 2021:
| to San Bernardino County, CA | |
| to Los Angeles County, CA | |
| to Orange County, CA |
Strongest AM radio stations in Perris Valley:
- KPLS (830 AM; 50 kW; ORANGE, CA; Owner: CRN LICENSES, LLC)
- KFI (640 AM; 50 kW; LOS ANGELES, CA; Owner: CAPSTAR TX LIMITED PARTNERSHIP)
- KLAC (570 AM; 50 kW; LOS ANGELES, CA; Owner: AMFM RADIO LICENSES, L.L.C.)
- KHPY (1670 AM; 10 kW; MORENO VALLEY, CA; Owner: DELBERT L. VAN VOORHIS)
- KTNQ (1020 AM; 50 kW; LOS ANGELES, CA; Owner: KTNQ-AM LICENSE CORP.)
- KXTA (1150 AM; 50 kW; LOS ANGELES, CA; Owner: CITICASTERS LICENSES, L.P.)
- KDIS (1110 AM; 50 kW; PASADENA, CA; Owner: ABC,INC.)
- KFMB (760 AM; 50 kW; SAN DIEGO, CA; Owner: MIDWEST TELEVISION, INC.)
- KFWB (980 AM; 50 kW; LOS ANGELES, CA; Owner: INFINITY BROADCASTING OPERATIONS, INC.)
- KPRO (1570 AM; 5 kW; RIVERSIDE, CA; Owner: OLIVE L. SHERBAN)
- KSPN (710 AM; 50 kW; LOS ANGELES, CA; Owner: KABC-AM RADIO, INC.)
- KNX (1070 AM; 50 kW; LOS ANGELES, CA; Owner: INFINITY BROADCASTING OPERATIONS, INC.)
- KCBQ (1170 AM; 50 kW; SAN DIEGO, CA; Owner: RADIO 1210, INC.)
Strongest FM radio stations in Perris Valley:
- KRTM (88.9 FM; TEMECULA, CA; Owner: PENFOLD COMMUNICATIONS, INC.)
- KLRD (90.1 FM; YUCAIPA, CA; Owner: EDUCATIONAL MEDIA FOUNDATION)
- KUOR-FM (89.1 FM; REDLANDS, CA; Owner: UNIVERSITY OF REDLANDS)
- KOLA (99.9 FM; SAN BERNARDINO, CA; Owner: INLAND EMPIRE BROADCASTING CORP.)
- KVCR (91.9 FM; SAN BERNARDINO, CA; Owner: SAN BERNARDINO COMMUNITY COLLEGE DISTRICT)
- KUCR (88.3 FM; RIVERSIDE, CA; Owner: THE REGENTS OF THE UNIV. OF CA)
- KWRP (96.1 FM; SAN JACINTO, CA; Owner: MAGIC BROADCASTING, INC.)
- KPLM-FM2 (106.1 FM; SAN JACINTO, CA; Owner: RM BROADCASTING L.L.C.)
- KWVE (107.9 FM; SAN CLEMENTE, CA; Owner: CALVARY CHAPEL OF COSTA MESA)
- KXFG (92.9 FM; SUN CITY, CA; Owner: INFINITY RADIO OPERATIONS INC.)
- K201AR (88.1 FM; BANNING, CA; Owner: KSGN, INC.)
- K232CX (94.3 FM; DESERT HOT SPRINGS, CA; Owner: MCC RADIO, LLC)
- KXRS (105.7 FM; HEMET, CA; Owner: LAZER BROADCASTING CORPORATION)
- KCXX (103.9 FM; LAKE ARROWHEAD, CA; Owner: ALL-PRO BROADCASTING, INC.)
- KATY-FM (101.3 FM; IDYLLWILD, CA; Owner: ALL PRO BROADCASTING, INC.)
- K295AI (106.9 FM; MUSCOY, CA; Owner: ASSOCIATION FOR COMMUNITY EDUCATION, INC.)
- KGGI (99.1 FM; RIVERSIDE, CA; Owner: AMFM RADIO LICENSES, L.L.C.)
- KLYY (97.5 FM; RIVERSIDE, CA; Owner: ENTRAVISION HOLDINGS, LLC)
- K201CD (88.1 FM; VICTORVILLE, CA; Owner: SAN BERNARDINO COMMNTY COLLEGE DIST.)
- K264AF (100.7 FM; GUASTI, CA; Owner: EDUCATIONAL MEDIA FOUNDATION)
TV broadcast stations around Perris Valley:
- KTRO-LP (Channel 50; LANCASTER, CA; Owner: ROBERT D. ADELMAN)
- KHIZ (Channel 64; BARSTOW, CA; Owner: SUNBELT TELEVISION, INC.)
- KVCR-TV (Channel 24; SAN BERNARDINO, CA; Owner: SAN BERNARDINO COMMUNITY COLLEGE DISTRICT)
- K47FL (Channel 47; FALLBROOK, CA; Owner: CHANNEL 51 OF SAN DIEGO, INC.)
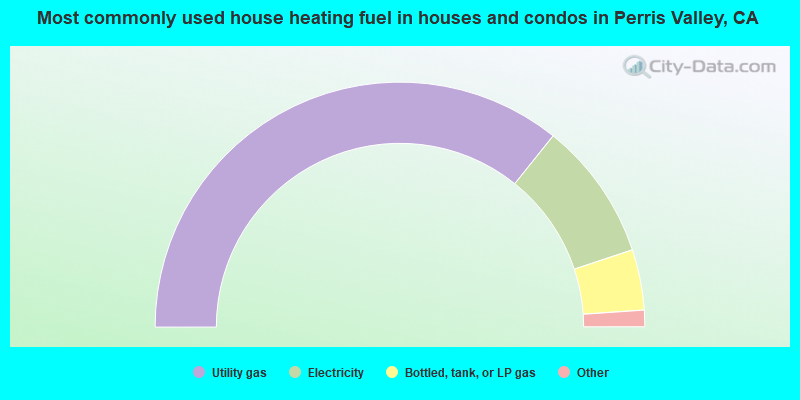
- 71.5%Utility gas
- 18.3%Electricity
- 8.0%Bottled, tank, or LP gas
- 1.2%Wood
- 0.6%No fuel used
- 0.2%Other fuel
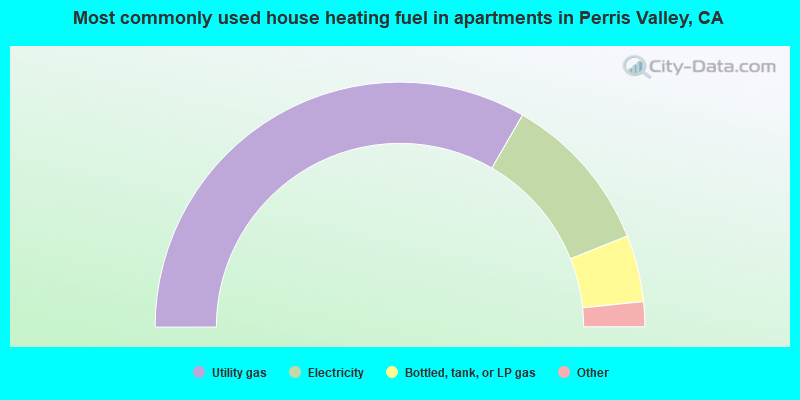
- 66.7%Utility gas
- 21.2%Electricity
- 8.8%Bottled, tank, or LP gas
- 1.5%No fuel used
- 1.2%Wood
- 0.5%Other fuel
- 0.1%Solar energy
Perris Valley compared to California state average:
- Median house value below state average.
- Unemployed percentage below state average.
- Black race population percentage above state average.
- Foreign-born population percentage significantly below state average.
- Renting percentage below state average.
- Length of stay since moving in significantly above state average.
- Number of rooms per house significantly below state average.
- House age significantly below state average.
- Percentage of population with a bachelor's degree or higher significantly below state average.
Perris Valley, CA compared to other similar cities:
Perris Valley on our top lists:
- #1 on the list of "Top 101 cities with largest percentage of females in industries: electronic shopping and mail-order houses (population 50,000+)"
- #1 on the list of "Top 101 cities with largest percentage of females in occupations: assemblers and fabricators (population 50,000+)"
- #1 on the list of "Top 101 cities with largest percentage of females in industries: miscellaneous manufacturing (population 50,000+)"
- #2 on the list of "Top 101 cities with largest percentage of males in industries: nonmetallic mineral products (population 50,000+)"
- #2 on the list of "Top 101 cities with largest percentage of females in industries: gasoline stations (population 50,000+)"
- #2 on the list of "Top 101 cities with largest percentage of males in industries: other direct selling establishments (population 50,000+)"
- #3 on the list of "Top 101 cities with largest percentage of females in industries: rail transportation (population 50,000+)"
- #3 on the list of "Top 101 cities with largest percentage of males in industries: wood products (population 50,000+)"
- #4 on the list of "Top 101 cities with largest percentage of females in occupations: farmers and farm managers (population 50,000+)"
- #4 on the list of "Top 101 cities with largest percentage of females in occupations: metal workers and plastic workers (population 50,000+)"
- #4 on the list of "Top 101 cities with largest percentage of females in industries: nonmetallic mineral products (population 50,000+)"
- #4 on the list of "Top 101 cities with largest percentage of males in occupations: construction laborers (population 50,000+)"
- #5 on the list of "Top 101 cities with largest percentage of females in occupations: supervisors and other personal care and service workers except personal appearance, transportation, and child care workers (population 50,000+)"
- #5 on the list of "Top 101 cities with the largest differences between daily high and daily low temperatures (population 50,000+)"
- #6 on the list of "Top 101 cities with largest percentage of males in occupations: construction trades workers except carpenters, electricians, painters, plumbers, and construction laborers (population 50,000+)"
- #6 on the list of "Top 101 cities with largest percentage of males in industries: electronic shopping and mail-order houses (population 50,000+)"
- #7 on the list of "Top 101 cities with largest percentage of females in industries: wood products (population 50,000+)"
- #7 on the list of "Top 101 cities with largest percentage of males in industries: repair and maintenance (population 50,000+)"
- #8 on the list of "Top 101 cities with the smallest percentages of current college students (population 100,000+)"
- #9 on the list of "Top 101 cities with largest percentage of males in industries: miscellaneous manufacturing (population 50,000+)"
- #3 on the list of "Top 101 counties with the highest lead air pollution readings in 2012 (µg/m3)"
- #4 on the list of "Top 101 counties with the highest ground withdrawal of fresh water for public supply"
- #11 on the list of "Top 101 counties with the most Catholic adherents"
- #11 on the list of "Top 101 counties with the highest total withdrawal of fresh water for public supply"
- #12 on the list of "Top 101 counties with the highest carbon monoxide air pollution readings in 2012 (ppm)"
State forum archive:
- California Pages: 2 3 4 5 6 7 8 9 10 11 12 13 14 15 16 17 18 19 20 21 22 23 24 25 26 27 28 29 30 31 32 33 34 35 36 37 38 39 40 41 42 43 44 45 46 47 48 49 50 51 52 53 54 55 56 57 58 59 60 61 62 63 64 65 66 67 68 69 70 71 72 73 74 75 76 77 78 79
- Los Angeles Pages: 2 3 4 5 6 7 8 9 10 11 12 13 14 15 16 17 18 19 20 21 22 23 24 25 26 27 28 29 30 31 32 33 34 35 36 37 38 39 40 41 42 43 44 45 46 47 48 49 50 51 52 53 54 55 56 57 58 59 60 61 62 63 64 65 66 67 68 69 70 71 72 73 74 75 76 77 78 79 80 81 82 83 84 85 86 87 88 89 90 91 92 93 94 95 96 97 98 99 100 101 102 103 104 105 106 107 108 109 110 111 112 113 114 115 116 117 118 119 120 121 122 123
- Monterey County Pages: 2 3
- Orange County Pages: 2 3 4 5 6 7 8 9 10 11 12 13 14 15 16 17 18 19 20 21 22 23 24 25 26 27 28 29 30 31 32 33 34 35 36
- Sacramento Pages: 2 3 4 5 6 7 8 9 10 11 12 13 14 15 16 17 18 19 20 21 22 23 24 25 26 27 28 29 30 31 32
- San Bernardino and Riverside Counties Pages: 2 3 4 5 6 7 8 9 10 11 12 13 14 15 16 17 18 19 20 21 22 23
- San Diego Pages: 2 3 4 5 6 7 8 9 10 11 12 13 14 15 16 17 18 19 20 21 22 23 24 25 26 27 28 29 30 31 32 33 34 35 36 37 38 39 40 41 42 43 44 45 46 47 48 49 50 51 52 53 54 55 56 57 58 59 60 61 62 63 64 65 66 67 68 69 70 71 72 73 74 75 76
- San Francisco - Oakland Pages: 2 3 4 5 6 7 8 9 10 11 12 13 14 15 16 17 18 19 20 21 22 23 24 25 26 27 28 29 30 31 32 33 34 35 36 37 38 39 40 41 42 43 44 45 46 47 48 49 50 51 52 53 54 55 56 57 58 59 60 61 62 63 64 65 66 67 68 69 70 71 72
- San Jose Pages: 2 3 4 5 6 7 8 9 10 11 12 13 14 15 16 17 18 19 20 21 22 23 24
- Ventura County Pages: 2 3 4 5 6 7