Oroville, California Submit your own pictures of this city and show them to the world
OSM Map
General Map
Google Map
MSN Map
OSM Map
General Map
Google Map
MSN Map
OSM Map
General Map
Google Map
MSN Map
OSM Map
General Map
Google Map
MSN Map
Please wait while loading the map...
Population in 2022: 20,041 (98% urban, 2% rural). Population change since 2000: +54.1%Males: 10,028 Females: 10,013
March 2022 cost of living index in Oroville: 96.5 (near average, U.S. average is 100) Percentage of residents living in poverty in 2022: 23.3%for White Non-Hispanic residents , 36.4% for Black residents , 17.4% for Hispanic or Latino residents , 15.5% for American Indian residents , 100.0% for Native Hawaiian and other Pacific Islander residents , 35.4% for other race residents , 27.6% for two or more races residents )
Profiles of local businesses
Business Search - 14 Million verified businesses
Data:
Median household income ($)
Median household income (% change since 2000)
Household income diversity
Ratio of average income to average house value (%)
Ratio of average income to average rent
Median household income ($) - White
Median household income ($) - Black or African American
Median household income ($) - Asian
Median household income ($) - Hispanic or Latino
Median household income ($) - American Indian and Alaska Native
Median household income ($) - Multirace
Median household income ($) - Other Race
Median household income for houses/condos with a mortgage ($)
Median household income for apartments without a mortgage ($)
Races - White alone (%)
Races - White alone (% change since 2000)
Races - Black alone (%)
Races - Black alone (% change since 2000)
Races - American Indian alone (%)
Races - American Indian alone (% change since 2000)
Races - Asian alone (%)
Races - Asian alone (% change since 2000)
Races - Hispanic (%)
Races - Hispanic (% change since 2000)
Races - Native Hawaiian and Other Pacific Islander alone (%)
Races - Native Hawaiian and Other Pacific Islander alone (% change since 2000)
Races - Two or more races (%)
Races - Two or more races (% change since 2000)
Races - Other race alone (%)
Races - Other race alone (% change since 2000)
Racial diversity
Unemployment (%)
Unemployment (% change since 2000)
Unemployment (%) - White
Unemployment (%) - Black or African American
Unemployment (%) - Asian
Unemployment (%) - Hispanic or Latino
Unemployment (%) - American Indian and Alaska Native
Unemployment (%) - Multirace
Unemployment (%) - Other Race
Population density (people per square mile)
Population - Males (%)
Population - Females (%)
Population - Males (%) - White
Population - Males (%) - Black or African American
Population - Males (%) - Asian
Population - Males (%) - Hispanic or Latino
Population - Males (%) - American Indian and Alaska Native
Population - Males (%) - Multirace
Population - Males (%) - Other Race
Population - Females (%) - White
Population - Females (%) - Black or African American
Population - Females (%) - Asian
Population - Females (%) - Hispanic or Latino
Population - Females (%) - American Indian and Alaska Native
Population - Females (%) - Multirace
Population - Females (%) - Other Race
Coronavirus confirmed cases (May 23, 2024)
Deaths caused by coronavirus (May 23, 2024)
Coronavirus confirmed cases (per 100k population) (May 23, 2024)
Deaths caused by coronavirus (per 100k population) (May 23, 2024)
Daily increase in number of cases (May 23, 2024)
Weekly increase in number of cases (May 23, 2024)
Cases doubled (in days) (May 23, 2024)
Hospitalized patients (Apr 18, 2022)
Negative test results (Apr 18, 2022)
Total test results (Apr 18, 2022)
COVID Vaccine doses distributed (per 100k population) (Sep 19, 2023)
COVID Vaccine doses administered (per 100k population) (Sep 19, 2023)
COVID Vaccine doses distributed (Sep 19, 2023)
COVID Vaccine doses administered (Sep 19, 2023)
Likely homosexual households (%)
Likely homosexual households (% change since 2000)
Likely homosexual households - Lesbian couples (%)
Likely homosexual households - Lesbian couples (% change since 2000)
Likely homosexual households - Gay men (%)
Likely homosexual households - Gay men (% change since 2000)
Cost of living index
Median gross rent ($)
Median contract rent ($)
Median monthly housing costs ($)
Median house or condo value ($)
Median house or condo value ($ change since 2000)
Mean house or condo value by units in structure - 1, detached ($)
Mean house or condo value by units in structure - 1, attached ($)
Mean house or condo value by units in structure - 2 ($)
Mean house or condo value by units in structure by units in structure - 3 or 4 ($)
Mean house or condo value by units in structure - 5 or more ($)
Mean house or condo value by units in structure - Boat, RV, van, etc. ($)
Mean house or condo value by units in structure - Mobile home ($)
Median house or condo value ($) - White
Median house or condo value ($) - Black or African American
Median house or condo value ($) - Asian
Median house or condo value ($) - Hispanic or Latino
Median house or condo value ($) - American Indian and Alaska Native
Median house or condo value ($) - Multirace
Median house or condo value ($) - Other Race
Median resident age
Resident age diversity
Median resident age - Males
Median resident age - Females
Median resident age - White
Median resident age - Black or African American
Median resident age - Asian
Median resident age - Hispanic or Latino
Median resident age - American Indian and Alaska Native
Median resident age - Multirace
Median resident age - Other Race
Median resident age - Males - White
Median resident age - Males - Black or African American
Median resident age - Males - Asian
Median resident age - Males - Hispanic or Latino
Median resident age - Males - American Indian and Alaska Native
Median resident age - Males - Multirace
Median resident age - Males - Other Race
Median resident age - Females - White
Median resident age - Females - Black or African American
Median resident age - Females - Asian
Median resident age - Females - Hispanic or Latino
Median resident age - Females - American Indian and Alaska Native
Median resident age - Females - Multirace
Median resident age - Females - Other Race
Commute - mean travel time to work (minutes)
Travel time to work - Less than 5 minutes (%)
Travel time to work - Less than 5 minutes (% change since 2000)
Travel time to work - 5 to 9 minutes (%)
Travel time to work - 5 to 9 minutes (% change since 2000)
Travel time to work - 10 to 19 minutes (%)
Travel time to work - 10 to 19 minutes (% change since 2000)
Travel time to work - 20 to 29 minutes (%)
Travel time to work - 20 to 29 minutes (% change since 2000)
Travel time to work - 30 to 39 minutes (%)
Travel time to work - 30 to 39 minutes (% change since 2000)
Travel time to work - 40 to 59 minutes (%)
Travel time to work - 40 to 59 minutes (% change since 2000)
Travel time to work - 60 to 89 minutes (%)
Travel time to work - 60 to 89 minutes (% change since 2000)
Travel time to work - 90 or more minutes (%)
Travel time to work - 90 or more minutes (% change since 2000)
Marital status - Never married (%)
Marital status - Now married (%)
Marital status - Separated (%)
Marital status - Widowed (%)
Marital status - Divorced (%)
Median family income ($)
Median family income (% change since 2000)
Median non-family income ($)
Median non-family income (% change since 2000)
Median per capita income ($)
Median per capita income (% change since 2000)
Median family income ($) - White
Median family income ($) - Black or African American
Median family income ($) - Asian
Median family income ($) - Hispanic or Latino
Median family income ($) - American Indian and Alaska Native
Median family income ($) - Multirace
Median family income ($) - Other Race
Median year house/condo built
Median year apartment built
Year house built - Built 2005 or later (%)
Year house built - Built 2000 to 2004 (%)
Year house built - Built 1990 to 1999 (%)
Year house built - Built 1980 to 1989 (%)
Year house built - Built 1970 to 1979 (%)
Year house built - Built 1960 to 1969 (%)
Year house built - Built 1950 to 1959 (%)
Year house built - Built 1940 to 1949 (%)
Year house built - Built 1939 or earlier (%)
Average household size
Household density (households per square mile)
Average household size - White
Average household size - Black or African American
Average household size - Asian
Average household size - Hispanic or Latino
Average household size - American Indian and Alaska Native
Average household size - Multirace
Average household size - Other Race
Occupied housing units (%)
Vacant housing units (%)
Owner occupied housing units (%)
Renter occupied housing units (%)
Vacancy status - For rent (%)
Vacancy status - For sale only (%)
Vacancy status - Rented or sold, not occupied (%)
Vacancy status - For seasonal, recreational, or occasional use (%)
Vacancy status - For migrant workers (%)
Vacancy status - Other vacant (%)
Residents with income below the poverty level (%)
Residents with income below 50% of the poverty level (%)
Children below poverty level (%)
Poor families by family type - Married-couple family (%)
Poor families by family type - Male, no wife present (%)
Poor families by family type - Female, no husband present (%)
Poverty status for native-born residents (%)
Poverty status for foreign-born residents (%)
Poverty among high school graduates not in families (%)
Poverty among people who did not graduate high school not in families (%)
Residents with income below the poverty level (%) - White
Residents with income below the poverty level (%) - Black or African American
Residents with income below the poverty level (%) - Asian
Residents with income below the poverty level (%) - Hispanic or Latino
Residents with income below the poverty level (%) - American Indian and Alaska Native
Residents with income below the poverty level (%) - Multirace
Residents with income below the poverty level (%) - Other Race
Air pollution - Air Quality Index (AQI)
Air pollution - CO
Air pollution - NO2
Air pollution - SO2
Air pollution - Ozone
Air pollution - PM10
Air pollution - PM25
Air pollution - Pb
Crime - Murders per 100,000 population
Crime - Rapes per 100,000 population
Crime - Robberies per 100,000 population
Crime - Assaults per 100,000 population
Crime - Burglaries per 100,000 population
Crime - Thefts per 100,000 population
Crime - Auto thefts per 100,000 population
Crime - Arson per 100,000 population
Crime - City-data.com crime index
Crime - Violent crime index
Crime - Property crime index
Crime - Murders per 100,000 population (5 year average)
Crime - Rapes per 100,000 population (5 year average)
Crime - Robberies per 100,000 population (5 year average)
Crime - Assaults per 100,000 population (5 year average)
Crime - Burglaries per 100,000 population (5 year average)
Crime - Thefts per 100,000 population (5 year average)
Crime - Auto thefts per 100,000 population (5 year average)
Crime - Arson per 100,000 population (5 year average)
Crime - City-data.com crime index (5 year average)
Crime - Violent crime index (5 year average)
Crime - Property crime index (5 year average)
1996 Presidential Elections Results (%) - Democratic Party (Clinton)
1996 Presidential Elections Results (%) - Republican Party (Dole)
1996 Presidential Elections Results (%) - Other
2000 Presidential Elections Results (%) - Democratic Party (Gore)
2000 Presidential Elections Results (%) - Republican Party (Bush)
2000 Presidential Elections Results (%) - Other
2004 Presidential Elections Results (%) - Democratic Party (Kerry)
2004 Presidential Elections Results (%) - Republican Party (Bush)
2004 Presidential Elections Results (%) - Other
2008 Presidential Elections Results (%) - Democratic Party (Obama)
2008 Presidential Elections Results (%) - Republican Party (McCain)
2008 Presidential Elections Results (%) - Other
2012 Presidential Elections Results (%) - Democratic Party (Obama)
2012 Presidential Elections Results (%) - Republican Party (Romney)
2012 Presidential Elections Results (%) - Other
2016 Presidential Elections Results (%) - Democratic Party (Clinton)
2016 Presidential Elections Results (%) - Republican Party (Trump)
2016 Presidential Elections Results (%) - Other
2020 Presidential Elections Results (%) - Democratic Party (Biden)
2020 Presidential Elections Results (%) - Republican Party (Trump)
2020 Presidential Elections Results (%) - Other
Ancestries Reported - Arab (%)
Ancestries Reported - Czech (%)
Ancestries Reported - Danish (%)
Ancestries Reported - Dutch (%)
Ancestries Reported - English (%)
Ancestries Reported - French (%)
Ancestries Reported - French Canadian (%)
Ancestries Reported - German (%)
Ancestries Reported - Greek (%)
Ancestries Reported - Hungarian (%)
Ancestries Reported - Irish (%)
Ancestries Reported - Italian (%)
Ancestries Reported - Lithuanian (%)
Ancestries Reported - Norwegian (%)
Ancestries Reported - Polish (%)
Ancestries Reported - Portuguese (%)
Ancestries Reported - Russian (%)
Ancestries Reported - Scotch-Irish (%)
Ancestries Reported - Scottish (%)
Ancestries Reported - Slovak (%)
Ancestries Reported - Subsaharan African (%)
Ancestries Reported - Swedish (%)
Ancestries Reported - Swiss (%)
Ancestries Reported - Ukrainian (%)
Ancestries Reported - United States (%)
Ancestries Reported - Welsh (%)
Ancestries Reported - West Indian (%)
Ancestries Reported - Other (%)
Educational Attainment - No schooling completed (%)
Educational Attainment - Less than high school (%)
Educational Attainment - High school or equivalent (%)
Educational Attainment - Less than 1 year of college (%)
Educational Attainment - 1 or more years of college (%)
Educational Attainment - Associate degree (%)
Educational Attainment - Bachelor's degree (%)
Educational Attainment - Master's degree (%)
Educational Attainment - Professional school degree (%)
Educational Attainment - Doctorate degree (%)
School Enrollment - Nursery, preschool (%)
School Enrollment - Kindergarten (%)
School Enrollment - Grade 1 to 4 (%)
School Enrollment - Grade 5 to 8 (%)
School Enrollment - Grade 9 to 12 (%)
School Enrollment - College undergrad (%)
School Enrollment - Graduate or professional (%)
School Enrollment - Not enrolled in school (%)
School enrollment - Public schools (%)
School enrollment - Private schools (%)
School enrollment - Not enrolled (%)
Median number of rooms in houses and condos
Median number of rooms in apartments
Housing units lacking complete plumbing facilities (%)
Housing units lacking complete kitchen facilities (%)
Density of houses
Urban houses (%)
Rural houses (%)
Households with people 60 years and over (%)
Households with people 65 years and over (%)
Households with people 75 years and over (%)
Households with one or more nonrelatives (%)
Households with no nonrelatives (%)
Population in households (%)
Family households (%)
Nonfamily households (%)
Population in families (%)
Family households with own children (%)
Median number of bedrooms in owner occupied houses
Mean number of bedrooms in owner occupied houses
Median number of bedrooms in renter occupied houses
Mean number of bedrooms in renter occupied houses
Median number of vehichles in owner occupied houses
Mean number of vehichles in owner occupied houses
Median number of vehichles in renter occupied houses
Mean number of vehichles in renter occupied houses
Mortgage status - with mortgage (%)
Mortgage status - with second mortgage (%)
Mortgage status - with home equity loan (%)
Mortgage status - with both second mortgage and home equity loan (%)
Mortgage status - without a mortgage (%)
Average family size
Average family size - White
Average family size - Black or African American
Average family size - Asian
Average family size - Hispanic or Latino
Average family size - American Indian and Alaska Native
Average family size - Multirace
Average family size - Other Race
Geographical mobility - Same house 1 year ago (%)
Geographical mobility - Moved within same county (%)
Geographical mobility - Moved from different county within same state (%)
Geographical mobility - Moved from different state (%)
Geographical mobility - Moved from abroad (%)
Place of birth - Born in state of residence (%)
Place of birth - Born in other state (%)
Place of birth - Native, outside of US (%)
Place of birth - Foreign born (%)
Housing units in structures - 1, detached (%)
Housing units in structures - 1, attached (%)
Housing units in structures - 2 (%)
Housing units in structures - 3 or 4 (%)
Housing units in structures - 5 to 9 (%)
Housing units in structures - 10 to 19 (%)
Housing units in structures - 20 to 49 (%)
Housing units in structures - 50 or more (%)
Housing units in structures - Mobile home (%)
Housing units in structures - Boat, RV, van, etc. (%)
House/condo owner moved in on average (years ago)
Renter moved in on average (years ago)
Year householder moved into unit - Moved in 1999 to March 2000 (%)
Year householder moved into unit - Moved in 1995 to 1998 (%)
Year householder moved into unit - Moved in 1990 to 1994 (%)
Year householder moved into unit - Moved in 1980 to 1989 (%)
Year householder moved into unit - Moved in 1970 to 1979 (%)
Year householder moved into unit - Moved in 1969 or earlier (%)
Means of transportation to work - Drove car alone (%)
Means of transportation to work - Carpooled (%)
Means of transportation to work - Public transportation (%)
Means of transportation to work - Bus or trolley bus (%)
Means of transportation to work - Streetcar or trolley car (%)
Means of transportation to work - Subway or elevated (%)
Means of transportation to work - Railroad (%)
Means of transportation to work - Ferryboat (%)
Means of transportation to work - Taxicab (%)
Means of transportation to work - Motorcycle (%)
Means of transportation to work - Bicycle (%)
Means of transportation to work - Walked (%)
Means of transportation to work - Other means (%)
Working at home (%)
Industry diversity
Most Common Industries - Agriculture, forestry, fishing and hunting, and mining (%)
Most Common Industries - Agriculture, forestry, fishing and hunting (%)
Most Common Industries - Mining, quarrying, and oil and gas extraction (%)
Most Common Industries - Construction (%)
Most Common Industries - Manufacturing (%)
Most Common Industries - Wholesale trade (%)
Most Common Industries - Retail trade (%)
Most Common Industries - Transportation and warehousing, and utilities (%)
Most Common Industries - Transportation and warehousing (%)
Most Common Industries - Utilities (%)
Most Common Industries - Information (%)
Most Common Industries - Finance and insurance, and real estate and rental and leasing (%)
Most Common Industries - Finance and insurance (%)
Most Common Industries - Real estate and rental and leasing (%)
Most Common Industries - Professional, scientific, and management, and administrative and waste management services (%)
Most Common Industries - Professional, scientific, and technical services (%)
Most Common Industries - Management of companies and enterprises (%)
Most Common Industries - Administrative and support and waste management services (%)
Most Common Industries - Educational services, and health care and social assistance (%)
Most Common Industries - Educational services (%)
Most Common Industries - Health care and social assistance (%)
Most Common Industries - Arts, entertainment, and recreation, and accommodation and food services (%)
Most Common Industries - Arts, entertainment, and recreation (%)
Most Common Industries - Accommodation and food services (%)
Most Common Industries - Other services, except public administration (%)
Most Common Industries - Public administration (%)
Occupation diversity
Most Common Occupations - Management, business, science, and arts occupations (%)
Most Common Occupations - Management, business, and financial occupations (%)
Most Common Occupations - Management occupations (%)
Most Common Occupations - Business and financial operations occupations (%)
Most Common Occupations - Computer, engineering, and science occupations (%)
Most Common Occupations - Computer and mathematical occupations (%)
Most Common Occupations - Architecture and engineering occupations (%)
Most Common Occupations - Life, physical, and social science occupations (%)
Most Common Occupations - Education, legal, community service, arts, and media occupations (%)
Most Common Occupations - Community and social service occupations (%)
Most Common Occupations - Legal occupations (%)
Most Common Occupations - Education, training, and library occupations (%)
Most Common Occupations - Arts, design, entertainment, sports, and media occupations (%)
Most Common Occupations - Healthcare practitioners and technical occupations (%)
Most Common Occupations - Health diagnosing and treating practitioners and other technical occupations (%)
Most Common Occupations - Health technologists and technicians (%)
Most Common Occupations - Service occupations (%)
Most Common Occupations - Healthcare support occupations (%)
Most Common Occupations - Protective service occupations (%)
Most Common Occupations - Fire fighting and prevention, and other protective service workers including supervisors (%)
Most Common Occupations - Law enforcement workers including supervisors (%)
Most Common Occupations - Food preparation and serving related occupations (%)
Most Common Occupations - Building and grounds cleaning and maintenance occupations (%)
Most Common Occupations - Personal care and service occupations (%)
Most Common Occupations - Sales and office occupations (%)
Most Common Occupations - Sales and related occupations (%)
Most Common Occupations - Office and administrative support occupations (%)
Most Common Occupations - Natural resources, construction, and maintenance occupations (%)
Most Common Occupations - Farming, fishing, and forestry occupations (%)
Most Common Occupations - Construction and extraction occupations (%)
Most Common Occupations - Installation, maintenance, and repair occupations (%)
Most Common Occupations - Production, transportation, and material moving occupations (%)
Most Common Occupations - Production occupations (%)
Most Common Occupations - Transportation occupations (%)
Most Common Occupations - Material moving occupations (%)
People in Group quarters - Institutionalized population (%)
People in Group quarters - Correctional institutions (%)
People in Group quarters - Federal prisons and detention centers (%)
People in Group quarters - Halfway houses (%)
People in Group quarters - Local jails and other confinement facilities (including police lockups) (%)
People in Group quarters - Military disciplinary barracks (%)
People in Group quarters - State prisons (%)
People in Group quarters - Other types of correctional institutions (%)
People in Group quarters - Nursing homes (%)
People in Group quarters - Hospitals/wards, hospices, and schools for the handicapped (%)
People in Group quarters - Hospitals/wards and hospices for chronically ill (%)
People in Group quarters - Hospices or homes for chronically ill (%)
People in Group quarters - Military hospitals or wards for chronically ill (%)
People in Group quarters - Other hospitals or wards for chronically ill (%)
People in Group quarters - Hospitals or wards for drug/alcohol abuse (%)
People in Group quarters - Mental (Psychiatric) hospitals or wards (%)
People in Group quarters - Schools, hospitals, or wards for the mentally retarded (%)
People in Group quarters - Schools, hospitals, or wards for the physically handicapped (%)
People in Group quarters - Institutions for the deaf (%)
People in Group quarters - Institutions for the blind (%)
People in Group quarters - Orthopedic wards and institutions for the physically handicapped (%)
People in Group quarters - Wards in general hospitals for patients who have no usual home elsewhere (%)
People in Group quarters - Wards in military hospitals for patients who have no usual home elsewhere (%)
People in Group quarters - Juvenile institutions (%)
People in Group quarters - Long-term care (%)
People in Group quarters - Homes for abused, dependent, and neglected children (%)
People in Group quarters - Residential treatment centers for emotionally disturbed children (%)
People in Group quarters - Training schools for juvenile delinquents (%)
People in Group quarters - Short-term care, detention or diagnostic centers for delinquent children (%)
People in Group quarters - Type of juvenile institution unknown (%)
People in Group quarters - Noninstitutionalized population (%)
People in Group quarters - College dormitories (includes college quarters off campus) (%)
People in Group quarters - Military quarters (%)
People in Group quarters - On base (%)
People in Group quarters - Barracks, unaccompanied personnel housing (UPH), (Enlisted/Officer), ;and similar group living quarters for military personnel (%)
People in Group quarters - Transient quarters for temporary residents (%)
People in Group quarters - Military ships (%)
People in Group quarters - Group homes (%)
People in Group quarters - Homes or halfway houses for drug/alcohol abuse (%)
People in Group quarters - Homes for the mentally ill (%)
People in Group quarters - Homes for the mentally retarded (%)
People in Group quarters - Homes for the physically handicapped (%)
People in Group quarters - Other group homes (%)
People in Group quarters - Religious group quarters (%)
People in Group quarters - Dormitories (%)
People in Group quarters - Agriculture workers' dormitories on farms (%)
People in Group quarters - Job Corps and vocational training facilities (%)
People in Group quarters - Other workers' dormitories (%)
People in Group quarters - Crews of maritime vessels (%)
People in Group quarters - Other nonhousehold living situations (%)
People in Group quarters - Other noninstitutional group quarters (%)
Residents speaking English at home (%)
Residents speaking English at home - Born in the United States (%)
Residents speaking English at home - Native, born elsewhere (%)
Residents speaking English at home - Foreign born (%)
Residents speaking Spanish at home (%)
Residents speaking Spanish at home - Born in the United States (%)
Residents speaking Spanish at home - Native, born elsewhere (%)
Residents speaking Spanish at home - Foreign born (%)
Residents speaking other language at home (%)
Residents speaking other language at home - Born in the United States (%)
Residents speaking other language at home - Native, born elsewhere (%)
Residents speaking other language at home - Foreign born (%)
Class of Workers - Employee of private company (%)
Class of Workers - Self-employed in own incorporated business (%)
Class of Workers - Private not-for-profit wage and salary workers (%)
Class of Workers - Local government workers (%)
Class of Workers - State government workers (%)
Class of Workers - Federal government workers (%)
Class of Workers - Self-employed workers in own not incorporated business and Unpaid family workers (%)
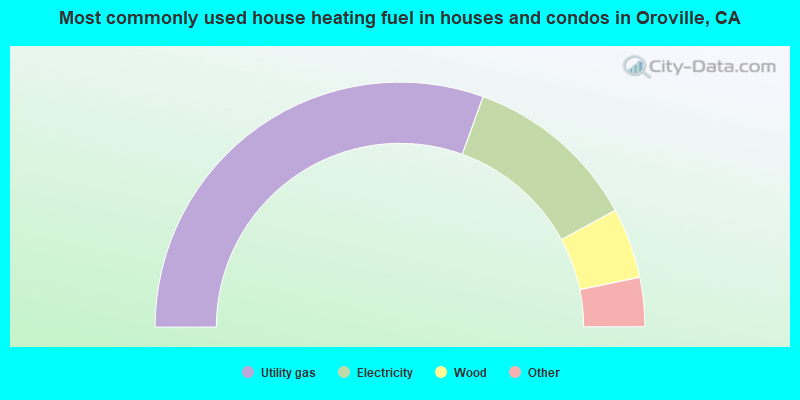
House heating fuel used in houses and condos - Utility gas (%)
House heating fuel used in houses and condos - Bottled, tank, or LP gas (%)
House heating fuel used in houses and condos - Electricity (%)
House heating fuel used in houses and condos - Fuel oil, kerosene, etc. (%)
House heating fuel used in houses and condos - Coal or coke (%)
House heating fuel used in houses and condos - Wood (%)
House heating fuel used in houses and condos - Solar energy (%)
House heating fuel used in houses and condos - Other fuel (%)
House heating fuel used in houses and condos - No fuel used (%)
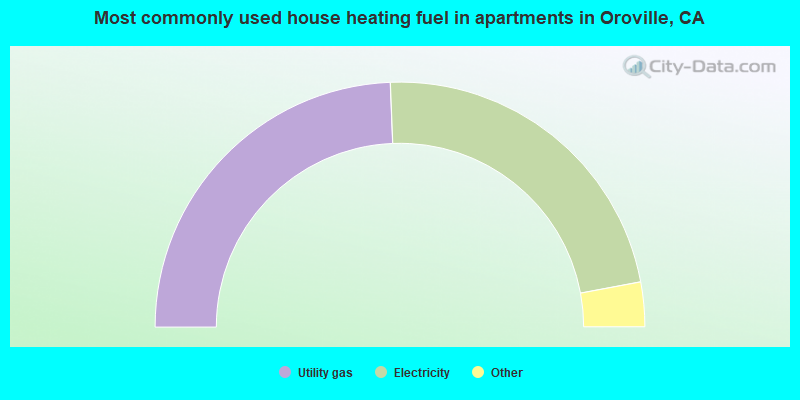
House heating fuel used in apartments - Utility gas (%)
House heating fuel used in apartments - Bottled, tank, or LP gas (%)
House heating fuel used in apartments - Electricity (%)
House heating fuel used in apartments - Fuel oil, kerosene, etc. (%)
House heating fuel used in apartments - Coal or coke (%)
House heating fuel used in apartments - Wood (%)
House heating fuel used in apartments - Solar energy (%)
House heating fuel used in apartments - Other fuel (%)
House heating fuel used in apartments - No fuel used (%)
Armed forces status - In Armed Forces (%)
Armed forces status - Civilian (%)
Armed forces status - Civilian - Veteran (%)
Armed forces status - Civilian - Nonveteran (%)
Fatal accidents locations in years 2005-2021
Fatal accidents locations in 2005
Fatal accidents locations in 2006
Fatal accidents locations in 2007
Fatal accidents locations in 2008
Fatal accidents locations in 2009
Fatal accidents locations in 2010
Fatal accidents locations in 2011
Fatal accidents locations in 2012
Fatal accidents locations in 2013
Fatal accidents locations in 2014
Fatal accidents locations in 2015
Fatal accidents locations in 2016
Fatal accidents locations in 2017
Fatal accidents locations in 2018
Fatal accidents locations in 2019
Fatal accidents locations in 2020
Fatal accidents locations in 2021
Alcohol use - People drinking some alcohol every month (%)
Alcohol use - People not drinking at all (%)
Alcohol use - Average days/month drinking alcohol
Alcohol use - Average drinks/week
Alcohol use - Average days/year people drink much
Audiometry - Average condition of hearing (%)
Audiometry - People that can hear a whisper from across a quiet room (%)
Audiometry - People that can hear normal voice from across a quiet room (%)
Audiometry - Ears ringing, roaring, buzzing (%)
Audiometry - Had a job exposure to loud noise (%)
Audiometry - Had off-work exposure to loud noise (%)
Blood Pressure & Cholesterol - Has high blood pressure (%)
Blood Pressure & Cholesterol - Checking blood pressure at home (%)
Blood Pressure & Cholesterol - Frequently checking blood cholesterol (%)
Blood Pressure & Cholesterol - Has high cholesterol level (%)
Consumer Behavior - Money monthly spent on food at supermarket/grocery store
Consumer Behavior - Money monthly spent on food at other stores
Consumer Behavior - Money monthly spent on eating out
Consumer Behavior - Money monthly spent on carryout/delivered foods
Consumer Behavior - Income spent on food at supermarket/grocery store (%)
Consumer Behavior - Income spent on food at other stores (%)
Consumer Behavior - Income spent on eating out (%)
Consumer Behavior - Income spent on carryout/delivered foods (%)
Current Health Status - General health condition (%)
Current Health Status - Blood donors (%)
Current Health Status - Has blood ever tested for HIV virus (%)
Current Health Status - Left-handed people (%)
Dermatology - People using sunscreen (%)
Diabetes - Diabetics (%)
Diabetes - Had a blood test for high blood sugar (%)
Diabetes - People taking insulin (%)
Diet Behavior & Nutrition - Diet health (%)
Diet Behavior & Nutrition - Milk product consumption (# of products/month)
Diet Behavior & Nutrition - Meals not home prepared (#/week)
Diet Behavior & Nutrition - Meals from fast food or pizza place (#/week)
Diet Behavior & Nutrition - Ready-to-eat foods (#/month)
Diet Behavior & Nutrition - Frozen meals/pizza (#/month)
Drug Use - People that ever used marijuana or hashish (%)
Drug Use - Ever used hard drugs (%)
Drug Use - Ever used any form of cocaine (%)
Drug Use - Ever used heroin (%)
Drug Use - Ever used methamphetamine (%)
Health Insurance - People covered by health insurance (%)
Kidney Conditions-Urology - Avg. # of times urinating at night
Medical Conditions - People with asthma (%)
Medical Conditions - People with anemia (%)
Medical Conditions - People with psoriasis (%)
Medical Conditions - People with overweight (%)
Medical Conditions - Elderly people having difficulties in thinking or remembering (%)
Medical Conditions - People who ever received blood transfusion (%)
Medical Conditions - People having trouble seeing even with glass/contacts (%)
Medical Conditions - People with arthritis (%)
Medical Conditions - People with gout (%)
Medical Conditions - People with congestive heart failure (%)
Medical Conditions - People with coronary heart disease (%)
Medical Conditions - People with angina pectoris (%)
Medical Conditions - People who ever had heart attack (%)
Medical Conditions - People who ever had stroke (%)
Medical Conditions - People with emphysema (%)
Medical Conditions - People with thyroid problem (%)
Medical Conditions - People with chronic bronchitis (%)
Medical Conditions - People with any liver condition (%)
Medical Conditions - People who ever had cancer or malignancy (%)
Mental Health - People who have little interest in doing things (%)
Mental Health - People feeling down, depressed, or hopeless (%)
Mental Health - People who have trouble sleeping or sleeping too much (%)
Mental Health - People feeling tired or having little energy (%)
Mental Health - People with poor appetite or overeating (%)
Mental Health - People feeling bad about themself (%)
Mental Health - People who have trouble concentrating on things (%)
Mental Health - People moving or speaking slowly or too fast (%)
Mental Health - People having thoughts they would be better off dead (%)
Oral Health - Average years since last visit a dentist
Oral Health - People embarrassed because of mouth (%)
Oral Health - People with gum disease (%)
Oral Health - General health of teeth and gums (%)
Oral Health - Average days a week using dental floss/device
Oral Health - Average days a week using mouthwash for dental problem
Oral Health - Average number of teeth
Pesticide Use - Households using pesticides to control insects (%)
Pesticide Use - Households using pesticides to kill weeds (%)
Physical Activity - People doing vigorous-intensity work activities (%)
Physical Activity - People doing moderate-intensity work activities (%)
Physical Activity - People walking or bicycling (%)
Physical Activity - People doing vigorous-intensity recreational activities (%)
Physical Activity - People doing moderate-intensity recreational activities (%)
Physical Activity - Average hours a day doing sedentary activities
Physical Activity - Average hours a day watching TV or videos
Physical Activity - Average hours a day using computer
Physical Functioning - People having limitations keeping them from working (%)
Physical Functioning - People limited in amount of work they can do (%)
Physical Functioning - People that need special equipment to walk (%)
Physical Functioning - People experiencing confusion/memory problems (%)
Physical Functioning - People requiring special healthcare equipment (%)
Prescription Medications - Average number of prescription medicines taking
Preventive Aspirin Use - Adults 40+ taking low-dose aspirin (%)
Reproductive Health - Vaginal deliveries (%)
Reproductive Health - Cesarean deliveries (%)
Reproductive Health - Deliveries resulted in a live birth (%)
Reproductive Health - Pregnancies resulted in a delivery (%)
Reproductive Health - Women breastfeeding newborns (%)
Reproductive Health - Women that had a hysterectomy (%)
Reproductive Health - Women that had both ovaries removed (%)
Reproductive Health - Women that have ever taken birth control pills (%)
Reproductive Health - Women taking birth control pills (%)
Reproductive Health - Women that have ever used Depo-Provera or injectables (%)
Reproductive Health - Women that have ever used female hormones (%)
Sexual Behavior - People 18+ that ever had sex (vaginal, anal, or oral) (%)
Sexual Behavior - Males 18+ that ever had vaginal sex with a woman (%)
Sexual Behavior - Males 18+ that ever performed oral sex on a woman (%)
Sexual Behavior - Males 18+ that ever had anal sex with a woman (%)
Sexual Behavior - Males 18+ that ever had any sex with a man (%)
Sexual Behavior - Females 18+ that ever had vaginal sex with a man (%)
Sexual Behavior - Females 18+ that ever performed oral sex on a man (%)
Sexual Behavior - Females 18+ that ever had anal sex with a man (%)
Sexual Behavior - Females 18+ that ever had any kind of sex with a woman (%)
Sexual Behavior - Average age people first had sex
Sexual Behavior - Average number of female sex partners in lifetime (males 18+)
Sexual Behavior - Average number of female vaginal sex partners in lifetime (males 18+)
Sexual Behavior - Average age people first performed oral sex on a woman (18+)
Sexual Behavior - Average number of woman performed oral sex on in lifetime (18+)
Sexual Behavior - Average number of male sex partners in lifetime (males 18+)
Sexual Behavior - Average number of male anal sex partners in lifetime (males 18+)
Sexual Behavior - Average age people first performed oral sex on a man (18+)
Sexual Behavior - Average number of male oral sex partners in lifetime (18+)
Sexual Behavior - People using protection when performing oral sex (%)
Sexual Behavior - Average number of times people have vaginal or anal sex a year
Sexual Behavior - People having sex without condom (%)
Sexual Behavior - Average number of male sex partners in lifetime (females 18+)
Sexual Behavior - Average number of male vaginal sex partners in lifetime (females 18+)
Sexual Behavior - Average number of female sex partners in lifetime (females 18+)
Sexual Behavior - Circumcised males 18+ (%)
Sleep Disorders - Average hours sleeping at night
Sleep Disorders - People that has trouble sleeping (%)
Smoking-Cigarette Use - People smoking cigarettes (%)
Taste & Smell - People 40+ having problems with smell (%)
Taste & Smell - People 40+ having problems with taste (%)
Taste & Smell - People 40+ that ever had wisdom teeth removed (%)
Taste & Smell - People 40+ that ever had tonsils teeth removed (%)
Taste & Smell - People 40+ that ever had a loss of consciousness because of a head injury (%)
Taste & Smell - People 40+ that ever had a broken nose or other serious injury to face or skull (%)
Taste & Smell - People 40+ that ever had two or more sinus infections (%)
Weight - Average height (inches)
Weight - Average weight (pounds)
Weight - Average BMI
Weight - People that are obese (%)
Weight - People that ever were obese (%)
Weight - People trying to lose weight (%)
11,089 56.3% White alone 3,158 16.0% Hispanic 2,593 13.2% Asian alone 1,801 9.1% Two or more races 688 3.5% Black alone 547 2.8% American Indian alone 50 0.3% Native Hawaiian and Other 45 0.2% Other race alone
Officers per 1,000 residents here:
1.03California average:
2.30
Latest news from Oroville, CA collected exclusively by city-data.com from local newspapers, TV, and radio stations
Ancestries: American (14.8%), Irish (8.6%), German (5.7%), English (4.9%), European (2.8%), Italian (2.4%).
Current Local Time:
Land area: 12.3 square miles.
Population density: 1,636 people per square mile (low).
1,526 residents are foreign born (5.0% Asia , 2.2% Latin America ).
This city:
7.8%California:
26.5%
Median real estate property taxes paid for housing units with mortgages in 2022: $2,794 (0.9%)Median real estate property taxes paid for housing units with no mortgage in 2022: $1,346 (0.6%)
Nearest city with pop. 50,000+: Chico, CA
Nearest city with pop. 200,000+: Sacramento, CA
Nearest city with pop. 1,000,000+: Los Angeles, CA
Nearest cities:
Cherokee, CA (3.1 miles),
Latitude: 39.51 N, Longitude: 121.55 W
Nickname or alias (official or unofficial): City of Gold - literal translation
Daytime population change due to commuting: +6,565 (+33.4%)Workers who live and work in this city: 3,524 (52.5%)
Oroville tourist attractions:
Single-family new house construction building permits:
2022: 5 buildings , average cost: $257,6002021: 17 buildings , average cost: $250,6002020: 64 buildings , average cost: $229,6002019: 60 buildings , average cost: $247,0002018: 9 buildings , average cost: $208,3002017: 3 buildings , average cost: $209,0002016: 15 buildings , average cost: $188,1002015: 15 buildings , average cost: $181,1002014: 16 buildings , average cost: $178,1002013: 6 buildings , average cost: $174,7002012: 1 building , cost: $385,4002011: 1 building , cost: $125,0002010: 3 buildings , average cost: $221,6002009: 2 buildings , average cost: $136,9002008: 35 buildings , average cost: $118,1002007: 30 buildings , average cost: $146,5002006: 29 buildings , average cost: $137,6002005: 55 buildings , average cost: $123,5002004: 128 buildings , average cost: $122,7002003: 72 buildings , average cost: $104,2002002: 43 buildings , average cost: $98,3002001: 17 buildings , average cost: $100,3002000: 32 buildings , average cost: $74,0001999: 7 buildings , average cost: $90,1001998: 6 buildings , average cost: $87,4001997: 7 buildings , average cost: $60,600Unemployment in December 2023:
Population change in the 1990s: +574 (+4.6%).
Most common occupations in Oroville, CA (%)
Both Males Females
Building and grounds cleaning and maintenance occupations (5.7%)
Other sales and related occupations, including supervisors (4.4%)
Other office and administrative support workers, including supervisors (4.2%)
Other management occupations, except farmers and farm managers (4.1%)
Cashiers (4.0%)
Material recording, scheduling, dispatching, and distributing workers (3.4%)
Health technologists and technicians (3.2%)
Building and grounds cleaning and maintenance occupations (7.5%)
Other management occupations, except farmers and farm managers (5.8%)
Driver/sales workers and truck drivers (5.6%)
Other sales and related occupations, including supervisors (4.7%)
Construction traders workers except carpenters, electricians, painters, plumbers, and construction laborers (4.4%)
Material recording, scheduling, dispatching, and distributing workers (3.9%)
Other production occupations, including supervisors (3.7%)
Other office and administrative support workers, including supervisors (7.8%)
Cashiers (5.8%)
Health technologists and technicians (5.3%)
Information and record clerks, except customer service representatives (5.1%)
Secretaries and administrative assistants (4.8%)
Other sales and related occupations, including supervisors (4.1%)
Preschool, kindergarten, elementary, and middle school teachers (4.1%)
Earthquake activity:
Oroville-area historical earthquake activity is significantly above California state average. It is 6855% greater than the overall U.S. average. On 4/18/1906 at 13:12:21, a magnitude 7.9 (7.9 UK, Class: Major, Intensity: VIII - XII) earthquake occurred 130.3 miles away from Oroville center, causing $524,000,000 total damage On 10/3/1915 at 06:52:48, a magnitude 7.6 (7.6 UK) earthquake occurred 225.5 miles away from the city center On 1/31/1922 at 13:17:28, a magnitude 7.6 (7.6 UK) earthquake occurred 227.0 miles away from Oroville center On 4/25/1992 at 18:06:04, a magnitude 7.2 (6.3 MB, 7.1 MS, 7.2 MW, 7.1 MW, Depth: 9.4 mi) earthquake occurred 145.5 miles away from the city center, causing $75,000,000 total damage On 11/8/1980 at 10:27:34, a magnitude 7.2 (6.2 MB, 7.2 MS, 7.2 MW, 7.0 ML) earthquake occurred 182.3 miles away from the city center On 10/18/1989 at 00:04:15, a magnitude 7.1 (6.5 MB, 7.1 MS, 6.9 MW, 7.0 ML) earthquake occurred 166.3 miles away from Oroville center, causing 62 deaths ( 62 shaking deaths) and 3757 injuries, causing $1,305,032,704 total damage Magnitude types: body-wave magnitude (MB), local magnitude (ML), surface-wave magnitude (MS), moment magnitude (MW) Natural disasters: The number of natural disasters in Butte County (25) is a lot greater than the US average (15).Major Disasters (Presidential) Declared: 11Emergencies Declared: 4Floods: 12, Fires: 9, Winter Storms: 6, Storms: 5, Landslides: 4, Mudslides: 4, Drought: 1, Freeze: 1, Heavy Rain: 1, Hurricane: 1, Tornado: 1, Other: 1 (Note: some incidents may be assigned to more than one category). Hospitals and medical centers in Oroville: OROVILLE HOSPITAL (Voluntary non-profit - Private, 2767 OLIVE HIGHWAY) COUNTRY CREST HEALTH CENTER (50 CONCORDIA LANE)
LAKEVIEW NURSING HOME (1912 20TH STREET)
OLIVE RIDGE POST ACUTE CARE (1000 EXECUTIVE PARKWAY)
SHADOWBROOK HEALTH CARE (1 GILMORE LANE)
OROVILLE DIALYSIS CLINIC (3012 OLIVE HIGHWAY)
GOLDEN VALLEY HOME HEALTH (1940 FEATHER RIVER BLVD SUITE K)
Amtrak station: OROVILLE (GRANDE AVE. AT STATE HWY. 70) - Bus Station
.
Services: fully wheelchair accessible, free short-term parking, free long-term parking, call for taxi service.
College/University in Oroville: Butte College Full-time enrollment: 8,649; Location: 3536 Butte Campus Drive; Public; Website: www.butte.edu)
Other colleges/universities with over 2000 students near Oroville:
California State University-Chico (about 22 miles; Chico, CA ; Full-time enrollment: 14,838)
Yuba College (about 27 miles; Marysville, CA ; FT enrollment: 4,737)
Sierra College (about 53 miles; Rocklin, CA ; FT enrollment: 11,488)
Universal Technical Institute of Northern California Inc (about 60 miles; Sacramento, CA ; FT enrollment: 3,193)
American River College (about 61 miles; Sacramento, CA ; FT enrollment: 20,452)
University of Phoenix-Sacramento Valley Campus (about 62 miles; Sacramento, CA ; FT enrollment: 2,855)
Folsom Lake College (about 63 miles; Folsom, CA ; FT enrollment: 5,308)
Public high schools in Oroville: LAS PLUMAS HIGH Students: 917, Location: 2380 LAS PLUMAS AVE., Grades: 9-12)OROVILLE HIGH Students: 813, Location: 1535 BRIDGE ST., Grades: 9-12)LEARNING COMMUNITY CHARTER Students: 256, Location: 1859 BIRD ST., Grades: KG-12, Charter school )PROSPECT HIGH (CONTINUATION) Students: 41, Location: 2060 SECOND ST., Grades: 9-12)BUTTE COUNTY SPECIAL EDUCATION Students: 36, Location: 1859 BIRD ST., Grades: KG-12)TABLE MOUNTAIN Students: 20, Location: 41 CO CENTER DR., Grades: KG-12)OROVILLE HIGH COMMUNITY DAY Students: 18, Location: 2120 SECOND ST., Grades: 9-12)IPAKANNI EARLY COLLEGE CHARTER Location: 1459 DOWNER ST., Grades: KG-12, Charter school )Private high school in Oroville: AMY CARMICHAEL CHRISTIAN ACADEMY Students: 8, Location: 1309 TEHAMA AVE, Grades: 3-11)
Biggest public elementary/middle schools in Oroville: NELSON AVENUE MIDDLE Students: 439, Location: 2255 SIXTH ST., Grades: 6-8)CENTRAL MIDDLE - RISE Students: 380, Location: 2565 MESA AVE., Grades: 7-8)ISHI HILLS MIDDLE Students: 323, Location: 1 ISHI HILLS WAY, Grades: 6-8)STANFORD AVENUE ELEMENTARY Students: 321, Location: 1801 STANFORD AVE., Grades: KG-6)HELEN M. WILCOX ELEMENTARY Students: 283, Location: 5737 AUTREY LN., Grades: KG-3)GOLDEN HILLS ELEMENTARY Students: 259, Location: 2400 VIA CANELA, Grades: 4-5)WYANDOTTE AVENUE ELEMENTARY Students: 236, Location: 2800 WYANDOTTE AVE., Grades: KG-6)PLUMAS AVENUE ELEMENTARY Students: 208, Location: 440 PLUMAS AVE., Grades: KG-5)OAKDALE HEIGHTS ELEMENTARY Students: 207, Location: 2255 LAS PLUMAS AVE., Grades: KG-6)SIERRA AVENUE ELEMENTARY Students: 181, Location: 1050 SIERRA AVE., Grades: KG-5)Private elementary/middle schools in Oroville: OROVILLE CHRISTIAN SCHOOL Students: 108, Location: 3785 OLIVE HWY, Grades: PK-8)
ST THOMAS SCHOOL Students: 90, Location: 1380 BIRD ST, Grades: PK-8)
FEATHER RIVER ADVENTIST SCHOOL Students: 11, Location: 27 COX LN, Grades: 2-8)
See full list of schools located in Oroville Library in Oroville: BUTTE COUNTY LIBRARY Operating income: $3,094,988; Location: 1820 MITCHELL AVENUE; 286,438 books ; 4 e-books ; 9,245 audio materials ; 7,798 video materials ; 9 local licensed databases ; 1 state licensed databases ; 8 other licensed databases ; 526 print serial subscriptions )
Notable locations in Oroville: (A) , Feather River Fish Hatchery (B) , Table Mountain Municipal Golf Course (C) , Veterans Memorial Building (D) , Oroville City Hall (E) , Butte County Library (F) , Butte County Courthouse (G) , Feather River Ranger District Ambulance (H) , First Responder Emergency Medical Services Station 22 (I) , Department of Forestry and Fire Protection Butte Unit / Butte County Fire Department Station 63 (J) , Oroville Fire Department Station 1 (K) . Display/hide their locations on the map
Churches in Oroville include: (A) , The Church of Jesus Christ of Latter Day Saints (B) , Church of the Nazarene (C) , First Congregational Church (D) , First Methodist Church (E) , Oro Vista Baptist Church (F) , Oroville Chinese Temple (G) , Pentecostal Assembly of God Tabernacle (H) , Saint Pauls Episcopal Church (I) . Display/hide their locations on the map
Cemetery: (1) . Display/hide its location on the map
Parks in Oroville include: (1) , Nelson Park (2) , Rotary Park (3) , Mitchell Field (4) , Sank Park (5) , Hewitt Park (6) . Display/hide their locations on the map
Tourist attractions: (1) , Butte County - Director's Office (Cultural Attractions- Events- & Facilities; 3 County Center Drive) (2) . Display/hide their approximate locations on the map
Hotels: (1) , Best Value Inn (580 Oro Dam Boulevard East) (2) , Budget Inn of Oroville (1475 Feather River Boulevard) (3) , Budget Inn (1475 Feather River Blvd) (4) . Display/hide their approximate locations on the map
Birthplace of: Doug LaMalfa - California state senator, Bev Hansen - Politician, Robert H. Young - Army Medal of Honor recipient, Dave Hudgens - Baseball player and coach, Kevin Brown (left-handed pitcher) - Baseball player, Travis Shook - Jazz pianist.
Butte County has a predicted average indoor radon screening level less than 2 pCi/L (pico curies per liter) - Low Potential Drinking water stations with addresses in Oroville and their reported violations in the past:
RIVER REFLECTIONS RV & CAMPGROUND (Population served: 125, Groundwater):
Past health violations:
MCL, Monthly (TCR) - In FEB-2012, Contaminant: Coliform. Follow-up actions: St Violation/Reminder Notice (FEB-21-2012), St Compliance achieved (FEB-21-2012)
MCL, Monthly (TCR) - In NOV-2010, Contaminant: Coliform. Follow-up actions: St Violation/Reminder Notice (NOV-10-2010), St Compliance achieved (NOV-10-2010)
MCL, Monthly (TCR) - In MAR-2010, Contaminant: Coliform
Past monitoring violations:
One routine major monitoring violation
Population served: 85, Groundwater):
Past health violations:
MCL, Monthly (TCR) - In DEC-2010, Contaminant: Coliform. Follow-up actions: St Violation/Reminder Notice (DEC-09-2010), St Compliance achieved (DEC-09-2010)
Past monitoring violations:
Initial Tap Sampling for Pb and Cu - In JUL-01-1993, Contaminant: Lead and Copper Rule. Follow-up actions: Fed Compliance achieved (SEP-30-2005)
7 routine major monitoring violations
2 regular monitoring violations
Population served: 25, Groundwater):
Past health violations:
MCL, Monthly (TCR) - In JUN-2010, Contaminant: Coliform. Follow-up actions: St Formal NOV issued (JUN-23-2010)
Population served: 25, Groundwater):
Past monitoring violations:
One routine major monitoring violation
Drinking water stations with addresses in Oroville that have no violations reported:
DWR-MONUMENT HILL RESTROOMS (Population served: 593, Primary Water Source Type: Groundwater)
WM. B. IDE ADOBE (Population served: 500, Primary Water Source Type: Groundwater)
IRVINE FINCH RIVER ACCESS (Population served: 144, Primary Water Source Type: Groundwater)
SLY CREEK CAMPGROUND (Population served: 85, Primary Water Source Type: Groundwater)
STRAWBERRY CAMPROUND (Population served: 75, Primary Water Source Type: Groundwater)
FALLING ROCK RV PARK (Population served: 50, Primary Water Source Type: Groundwater)
RIVER ONE RV PARK LLC (Population served: 26, Primary Water Source Type: Groundwater)
Average household size: This city:
2.6 peopleCalifornia:
2.9 people
Percentage of family households: This city:
61.9%Whole state:
68.7%
Percentage of households with unmarried partners: This city:
11.5%Whole state:
7.2%
Likely homosexual households (counted as self-reported same-sex unmarried-partner households)
Lesbian couples: 0.2% of all households Gay men: 0.3% of all households
People in group quarters in Oroville in 2010:
557 people in local jails and other municipal confinement facilities
201 people in nursing facilities/skilled-nursing facilities
54 people in correctional facilities intended for juveniles
42 people in group homes intended for adults
23 people in residential treatment centers for adults
7 people in workers' group living quarters and job corps centers
People in group quarters in Oroville in 2000:
432 people in local jails and other confinement facilities (including police lockups)
175 people in nursing homes
83 people in other noninstitutional group quarters
54 people in halfway houses
34 people in other group homes
33 people in homes for the mentally ill
8 people in homes for the mentally retarded
Banks with branches in Oroville (2011 data):
JPMorgan Chase Bank, National Association: Oroville Branch at 2001 Oro Dam Boulevard, branch established on 1966/01/27. Info updated 2011/11/10: Bank assets: $1,811,678.0 mil, Deposits: $1,190,738.0 mil, headquarters in Columbus, OH, positive income , International Specialization, 5577 total offices , Holding Company: Jpmorgan Chase & Co.
U.S. Bank National Association: Oroville Branch at 2111 Oro Dam Boulevard, branch established on 1926/01/01. Info updated 2012/01/30: Bank assets: $330,470.8 mil, Deposits: $236,091.5 mil, headquarters in Cincinnati, OH, positive income , 3121 total offices , Holding Company: U.S. Bancorp
Wells Fargo Bank, National Association: Oroville Branch at 2325 Myers Street, branch established on 1989/08/21. Info updated 2011/04/05: Bank assets: $1,161,490.0 mil, Deposits: $905,653.0 mil, headquarters in Sioux Falls, SD, positive income , 6395 total offices , Holding Company: Wells Fargo & Company
Bank of America, National Association: Oroville Branch at 1820 Oro Dam Boulevard, branch established on 1975/08/14. Info updated 2009/11/18: Bank assets: $1,451,969.3 mil, Deposits: $1,077,176.8 mil, headquarters in Charlotte, NC, positive income , 5782 total offices , Holding Company: Bank Of America Corporation
Tri Counties Bank: Oroville Branch at 1180 Oro Dam Boulevard, branch established on 2002/06/03. Info updated 2011/09/26: Bank assets: $2,554.4 mil, Deposits: $2,191.2 mil, headquarters in Chico, CA, positive income , Commercial Lending Specialization, 71 total offices , Holding Company: Trico Bancshares
Bank of the West: Oroville Branch at 2626 Oro Dam Boulevard, branch established on 1964/08/05. Info updated 2009/11/16: Bank assets: $62,408.3 mil, Deposits: $43,995.2 mil, headquarters in San Francisco, CA, positive income , 647 total offices , Holding Company: Bnp Paribas
Rabobank, National Association: Oroville Branch at 2227 Myers Street, branch established on 1990/12/14. Info updated 2011/01/27: Bank assets: $11,745.0 mil, Deposits: $8,446.0 mil, headquarters in Roseville, CA, positive income , Agricultural Specialization, 124 total offices , Holding Company: Cooperatieve Centrale Raiffeisen-Boerenleenbank B.A., "rabobank Nederland
For population 15 years and over in Oroville:
Never married: 38.6%Now married: 35.0%Separated: 2.1%Widowed: 7.7%Divorced: 16.6% For population 25 years and over in Oroville:
High school or higher: 83.5%Bachelor's degree or higher: 14.1%Graduate or professional degree: 3.5%Unemployed: 12.8%Mean travel time to work (commute): 19.0 minutes
Education Gini index (Inequality in education) Here:
14.3California average:
15.5
Religion statistics for Oroville, CA (based on Butte County data)
Religion Adherents Congregations Catholic 34,101 7 Evangelical Protestant 22,822 129 Other 11,031 36 Mainline Protestant 6,272 24 Black Protestant 475 4 Orthodox 280 2 None 145,019 -
Source: Clifford Grammich, Kirk Hadaway, Richard Houseal, Dale E.Jones, Alexei Krindatch, Richie Stanley and Richard H.Taylor. 2012. 2010 U.S.Religion Census: Religious Congregations & Membership Study. Association of Statisticians of American Religious Bodies. Jones, Dale E., et al. 2002. Congregations and Membership in the United States 2000. Nashville, TN: Glenmary Research Center. Graphs represent county-level data
Food Environment Statistics: Number of grocery stores : 50This county :
2.29 / 10,000 pop.California :
2.14 / 10,000 pop.
Number of supercenters and club stores : 2Butte County :
0.09 / 10,000 pop.California :
0.04 / 10,000 pop.
Number of convenience stores (no gas) : 18This county :
0.82 / 10,000 pop.California :
0.62 / 10,000 pop.
Number of convenience stores (with gas) : 49This county :
2.25 / 10,000 pop.California :
1.49 / 10,000 pop.
Number of full-service restaurants : 133Butte County :
6.10 / 10,000 pop.California :
7.42 / 10,000 pop.
Adult diabetes rate : Butte County :
9.0%California :
7.3%
Adult obesity rate : This county :
25.1%California :
21.3%
Low-income preschool obesity rate : Butte County :
12.3%California :
17.9%
Health and Nutrition: Healthy diet rate : Oroville:
49.0%California:
49.4%
Average overall health of teeth and gums : Here:
45.5%California:
48.0%
Average BMI : Oroville:
28.8California:
28.1
People feeling badly about themselves : Oroville:
21.0%California:
20.2%
People not drinking alcohol at all : This city:
12.2%State:
11.2%
Average hours sleeping at night : Oroville:
6.8California:
6.8
Overweight people : Oroville:
34.0%California:
31.5%
General health condition : This city:
55.1%California:
56.4%
Average condition of hearing : More about Health and Nutrition of Oroville, CA Residents
Local government employment and payroll (March 2022)
Function
Full-time employees
Monthly full-time payroll
Average yearly full-time wage
Part-time employees
Monthly part-time payroll
Police Protection - Officers
18 $141,559 $94,373 0 $0 Police - Other
16 $66,183 $49,637 0 $0 Firefighters
14 $175,420 $150,360 1 $399 Other Government Administration
12 $73,366 $73,366 10 $4,290 Other and Unallocable
10 $95,701 $114,841 0 $0 Parks and Recreation
8 $31,866 $47,799 1 $1,687 Financial Administration
7 $43,024 $73,755 0 $0 Streets and Highways
7 $25,046 $42,936 0 $0 Sewerage
5 $26,795 $64,308 0 $0 Housing and Community Development (Local)
3 $17,683 $70,732 0 $0 Fire - Other
3 $28,730 $114,920 0 $0
Totals for Government
103 $725,373 $84,509 12 $6,376
Oroville government finances - Expenditure in 2017 (per resident):
Construction - Housing and Community Development: $1,661,000 ($82.88)
Sewerage: $773,000 ($38.57)Air Transportation: $688,000 ($34.33)Police Protection: $568,000 ($28.34)Central Staff Services: $230,000 ($11.48)Regular Highways: $171,000 ($8.53)Local Fire Protection: $137,000 ($6.84)General - Other: $126,000 ($6.29)Current Operations - Police Protection: $5,251,000 ($262.01)
Housing and Community Development: $3,709,000 ($185.07)Central Staff Services: $3,321,000 ($165.71)Local Fire Protection: $2,892,000 ($144.30)Sewerage: $2,421,000 ($120.80)Regular Highways: $1,305,000 ($65.12)Financial Administration: $622,000 ($31.04)Air Transportation: $558,000 ($27.84)Parks and Recreation: $495,000 ($24.70)Transit Utilities: $462,000 ($23.05)Health - Other: $306,000 ($15.27)Protective Inspection and Regulation - Other: $258,000 ($12.87)General - Other: $19,000 ($0.95)General - Interest on Debt: $292,000 ($14.57)
Other Capital Outlay - Housing and Community Development: $149,000 ($7.43)
Central Staff Services: $104,000 ($5.19)Financial Administration: $50,000 ($2.49)Parks and Recreation: $28,000 ($1.40)Protective Inspection and Regulation - Other: $25,000 ($1.25)Health - Other: $20,000 ($1.00)Regular Highways: $12,000 ($0.60)Parking Facilities: $6,000 ($0.30)Natural Resources - Other: $3,000 ($0.15)
Oroville government finances - Revenue in 2017 (per resident):
Charges - Sewerage: $3,544,000 ($176.84)
Other: $685,000 ($34.18)Air Transportation: $553,000 ($27.59)Parks and Recreation: $25,000 ($1.25)Federal Intergovernmental - Other: $2,491,000 ($124.30)
Miscellaneous - General Revenue - Other: $3,458,000 ($172.55)
Interest Earnings: $1,261,000 ($62.92)Sale of Property: $197,000 ($9.83)Fines and Forfeits: $131,000 ($6.54)Rents: $59,000 ($2.94)Donations From Private Sources: $18,000 ($0.90)State Intergovernmental - Other: $865,000 ($43.16)
Highways: $356,000 ($17.76)General Local Government Support: $32,000 ($1.60)Tax - General Sales and Gross Receipts: $4,920,000 ($245.50)
Property: $3,138,000 ($156.58)Public Utilities Sales: $2,758,000 ($137.62)Other Selective Sales: $627,000 ($31.29)Other License: $331,000 ($16.52)Other: $269,000 ($13.42)Occupation and Business License - Other: $80,000 ($3.99)Documentary and Stock Transfer: $53,000 ($2.64)
Oroville government finances - Debt in 2017 (per resident):
Long Term Debt - Beginning Outstanding - Unspecified Public Purpose: $5,766,000 ($287.71)
Outstanding Unspecified Public Purpose: $5,262,000 ($262.56)Retired Unspecified Public Purpose: $504,000 ($25.15)
Oroville government finances - Cash and Securities in 2017 (per resident):
Bond Funds - Cash and Securities: $3,925,000 ($195.85)
Other Funds - Cash and Securities: $68,110,000 ($3398.53)
Sinking Funds - Cash and Securities: $30,000 ($1.50)
Businesses in Oroville, CA
Name Count Name Count
7-Eleven 3 Lane Furniture 1 AT&T 1 Little Caesars Pizza 1 Ace Hardware 1 McDonald's 1 Applebee's 1 Motel 6 1 Arby's 1 New Balance 1 AutoZone 1 Nike 1 Big O Tires 1 Payless 1 Blockbuster 1 Pizza Hut 1 Burger King 1 Quiznos 1 CVS 1 RadioShack 2 Chevrolet 1 Rite Aid 1 Circle K 1 SAS Shoes 1 Comfort Inn 1 Sears 1 Curves 1 Sprint Nextel 1 Days Inn 1 Staples 1 Dennys 1 Subway 1 FedEx 5 T-Mobile 2 Ford 1 Taco Bell 2 GNC 1 Toyota 1 GameStop 1 U-Haul 5 H&R Block 1 UPS 7 Holiday Inn 1 Vans 1 Home Depot 1 Walgreens 1 Jack In The Box 1 Walmart 1 Jones New York 2 Wendy's 1 KFC 1 YMCA 1
Strongest AM radio stations in Oroville:
KEWE (1340 AM; 1 kW; OROVILLE, CA; Owner: CLEAR CHANNEL BROADCASTING LICENSES, INC.)
KFBK (1530 AM; 50 kW; SACRAMENTO, CA; Owner: AMFM RADIO LICENSES, L.L.C.)
KFIA (710 AM; 25 kW; CARMICHAEL, CA; Owner: VISTA BROADCASTING INC.)
KPAY (1290 AM; 5 kW; CHICO, CA; Owner: CAPSTAR TX LIMITED PARTNERSHIP)
KKOH (780 AM; 50 kW; RENO, NV; Owner: CITADEL BROADCASTING COMPANY)
KHTK (1140 AM; 50 kW; SACRAMENTO, CA; Owner: INFINITY RADIO SUBSIDIARY OPERATIONS INC.)
KSTE (650 AM; 25 kW; RANCHO CORDOVA, CA; Owner: AMFM RADIO LICENSES, L.L.C.)
KCBS (740 AM; 50 kW; SAN FRANCISCO, CA; Owner: INFINITY BROADCASTING OPERATIONS, INC.)
KMYC (1410 AM; 5 kW; MARYSVILLE, CA; Owner: THOMAS F. HUTH)
KNCO (830 AM; 5 kW; GRASS VALLEY, CA; Owner: NEVADA COUNTY BROADCASTERS, INC.)
KCBC (770 AM; 50 kW; RIVERBANK, CA; Owner: KIERTRON, INC.)
KKXX (930 AM; 1 kW; PARADISE, CA; Owner: BUTTE BROADCASTING COMPANY, INC.)
KUBA (1600 AM; 5 kW; YUBA CITY, CA; Owner: HARLAN COMMUNICATIONS, INC.)
Strongest FM radio stations in Oroville:
K258AQ (99.5 FM; YANKEE HILL, CA; Owner: CALVARY CHAPEL OF TWIN FALLS, INC.)
KYIX (104.9 FM; SOUTH OROVILLE, CA; Owner: BUTTE BROADCASTING COMPANY, INC.)
KRBS-LP (107.1 FM; OROVILLE, CA; Owner: BIRD STREET MEDIA PROJECT)
KHHZ (97.7 FM; OROVILLE, CA; Owner: CLEAR CHANNEL BROADCASTING LICENSES, INC.)
KHAP (89.1 FM; CHICO, CA; Owner: FAMILY STATIONS, INC.)
KRCX-FM (99.9 FM; MARYSVILLE, CA; Owner: ENTRAVISION HOLDINGS, LLC)
KMJE (101.5 FM; GRIDLEY, CA; Owner: RESULTS RADIO LICENSEE, LLC)
K213BZ (90.5 FM; RICHVALE, CA; Owner: FAMILY STATIONS, INC.)
KKCY (103.1 FM; COLUSA, CA; Owner: RESULTS RADIO LICENSEE, LLC)
KHGQ (100.3 FM; QUINCY, CA; Owner: KEILY MILLER)
KXCL (103.9 FM; YUBA CITY, CA; Owner: HARLAN COMMUNICATIONS, INC.)
KLVC (88.3 FM; MAGALIA, CA; Owner: EDUCATIONAL MEDIA FOUNDATION)
K216CF (91.1 FM; CHICO, CA; Owner: YOUR CHRISTIAN COMPANION NETWORK, INC.)
K205EJ (88.9 FM; CHESTER, CA; Owner: CALVARY CHAPEL OF TWIN FALLS, INC.)
KZAP (96.7 FM; PARADISE, CA; Owner: REGENT LICENSEE OF CHICO, INC.)
KHSL-FM (103.5 FM; PARADISE, CA; Owner: CAPSTAR TX LIMITED PARTNERSHIP)
KCHO (91.7 FM; CHICO, CA; Owner: UNIV. FOUNDATION/CA. ST. UNIV. CHICO)
KMXI (95.1 FM; CHICO, CA; Owner: CAPSTAR TX LIMITED PARTNERSHIP)
KFMF (93.9 FM; CHICO, CA; Owner: REGENT LICENSEE OF CHICO, INC)
KTOR (99.7 FM; WESTWOOD, CA; Owner: SIERRA RADIO, INC.)
TV broadcast stations around Oroville:
K15CX (Channel 15; OROVILLE, CA; Owner: CALIFORNIA BROADCASTING, INC.)
K08NH (Channel 8; OROVILLE, CA; Owner: SAINTE PARTNERS II, L.P.)
KMMK-LP (Channel 14; SACRAMENTO, CA; Owner: CABALLERO TELEVISION TEXAS, L.L.C.)
KEZT-CA (Channel 23; SACRAMENTO, CA; Owner: TELEFUTURA SACRAMENTO LLC)
K51BP (Channel 51; PALERMO, CA; Owner: WVIT INC)
K18AO (Channel 18; OROVILLE/PARADISE, CA; Owner: CHICO LICENSE, L.L.C.)
K49CT (Channel 49; PARADISE, CA; Owner: CATAMOUNT BROADCASTING OF CHICO-REDDING, INC.)
National Bridge Inventory (NBI) Statistics 43 Number of bridges728ft / 222m Total length $1,555,000 Total costs376,454 Total average daily traffic38,789 Total average daily truck traffic
New bridges - historical statistics
2 1910-1919 3 1920-1929 4 1930-1939 3 1950-1959 22 1960-1969 2 1970-1979 4 1980-1989 2 2000-2009 1 2010-2019
See full National Bridge Inventory statistics for Oroville, CA
Home Mortgage Disclosure Act Aggregated Statistics For Year 2009(Based on 1 full and 3 partial tracts) A) FHA, FSA/RHS & VA B) Conventional C) Refinancings D) Home Improvement Loans F) Non-occupant Loans on G) Loans On Manufactured Number Average Value Number Average Value Number Average Value Number Average Value Number Average Value Number Average Value
LOANS ORIGINATED 26 $124,559 18 $109,961 40 $143,030 2 $102,485 15 $98,441 2 $116,900 APPLICATIONS APPROVED, NOT ACCEPTED 0 $0 4 $106,838 4 $165,278 0 $0 4 $103,485 0 $0 APPLICATIONS DENIED 4 $122,335 4 $108,068 35 $139,883 7 $33,651 6 $84,365 1 $49,370 APPLICATIONS WITHDRAWN 4 $137,798 2 $143,560 22 $154,107 4 $59,295 9 $106,516 0 $0 FILES CLOSED FOR INCOMPLETENESS 1 $130,830 0 $0 5 $152,502 0 $0 0 $0 0 $0
Aggregated Statistics For Year 2008(Based on 1 full and 3 partial tracts) A) FHA, FSA/RHS & VA B) Conventional C) Refinancings D) Home Improvement Loans F) Non-occupant Loans on G) Loans On Manufactured Number Average Value Number Average Value Number Average Value Number Average Value Number Average Value Number Average Value
LOANS ORIGINATED 11 $139,882 35 $123,697 57 $134,250 10 $59,726 23 $108,691 4 $101,565 APPLICATIONS APPROVED, NOT ACCEPTED 2 $129,125 6 $169,033 10 $140,925 3 $86,577 5 $120,632 1 $222,480 APPLICATIONS DENIED 2 $163,855 12 $91,972 70 $163,793 26 $47,173 18 $139,204 4 $57,928 APPLICATIONS WITHDRAWN 1 $99,290 6 $111,288 31 $155,948 8 $149,529 15 $141,924 2 $113,305 FILES CLOSED FOR INCOMPLETENESS 0 $0 1 $132,080 6 $195,137 1 $432,470 2 $250,510 0 $0
Aggregated Statistics For Year 2007(Based on 1 full and 3 partial tracts) A) FHA, FSA/RHS & VA B) Conventional C) Refinancings D) Home Improvement Loans E) Loans on Dwellings For 5+ Families F) Non-occupant Loans on G) Loans On Manufactured Number Average Value Number Average Value Number Average Value Number Average Value Number Average Value Number Average Value Number Average Value
LOANS ORIGINATED 6 $147,147 47 $142,160 146 $155,112 28 $95,081 2 $825,895 58 $141,339 5 $83,020 APPLICATIONS APPROVED, NOT ACCEPTED 0 $0 14 $164,675 25 $161,174 7 $59,837 0 $0 8 $185,766 1 $34,470 APPLICATIONS DENIED 2 $152,540 20 $267,477 146 $173,416 28 $78,077 0 $0 39 $223,165 6 $137,483 APPLICATIONS WITHDRAWN 0 $0 11 $128,891 66 $157,440 4 $114,722 2 $382,040 9 $154,216 0 $0 FILES CLOSED FOR INCOMPLETENESS 0 $0 2 $176,500 17 $203,912 0 $0 0 $0 6 $208,330 0 $0
Aggregated Statistics For Year 2006(Based on 1 full and 3 partial tracts) A) FHA, FSA/RHS & VA B) Conventional C) Refinancings D) Home Improvement Loans E) Loans on Dwellings For 5+ Families F) Non-occupant Loans on G) Loans On Manufactured Number Average Value Number Average Value Number Average Value Number Average Value Number Average Value Number Average Value Number Average Value
LOANS ORIGINATED 16 $131,235 116 $138,678 250 $151,406 40 $80,729 2 $736,380 106 $147,931 9 $127,739 APPLICATIONS APPROVED, NOT ACCEPTED 1 $108,670 22 $130,023 39 $162,098 7 $124,336 0 $0 20 $129,394 0 $0 APPLICATIONS DENIED 1 $183,030 56 $133,350 164 $161,113 39 $92,395 2 $1,010,285 51 $151,370 9 $83,227 APPLICATIONS WITHDRAWN 2 $113,330 21 $143,530 133 $160,727 13 $108,626 0 $0 20 $153,974 3 $84,037 FILES CLOSED FOR INCOMPLETENESS 0 $0 4 $142,778 15 $178,659 2 $117,510 0 $0 4 $150,940 0 $0
Aggregated Statistics For Year 2005(Based on 1 full and 3 partial tracts) A) FHA, FSA/RHS & VA B) Conventional C) Refinancings D) Home Improvement Loans E) Loans on Dwellings For 5+ Families F) Non-occupant Loans on G) Loans On Manufactured Number Average Value Number Average Value Number Average Value Number Average Value Number Average Value Number Average Value Number Average Value
LOANS ORIGINATED 7 $132,227 175 $127,043 262 $141,837 52 $97,430 5 $1,175,228 134 $129,025 4 $140,592 APPLICATIONS APPROVED, NOT ACCEPTED 1 $289,680 28 $111,561 41 $138,298 6 $85,993 0 $0 16 $113,221 3 $107,287 APPLICATIONS DENIED 2 $148,525 61 $124,785 142 $123,907 34 $63,793 1 $608,080 36 $131,699 13 $69,547 APPLICATIONS WITHDRAWN 0 $0 32 $142,348 134 $139,671 17 $100,500 0 $0 27 $158,613 4 $102,922 FILES CLOSED FOR INCOMPLETENESS 0 $0 1 $100,060 34 $134,612 3 $110,873 0 $0 5 $123,370 1 $112,400
Aggregated Statistics For Year 2004(Based on 1 full and 3 partial tracts) A) FHA, FSA/RHS & VA B) Conventional C) Refinancings D) Home Improvement Loans E) Loans on Dwellings For 5+ Families F) Non-occupant Loans on G) Loans On Manufactured Number Average Value Number Average Value Number Average Value Number Average Value Number Average Value Number Average Value Number Average Value
LOANS ORIGINATED 16 $109,703 157 $110,563 238 $105,018 51 $75,297 2 $728,665 134 $99,416 6 $97,797 APPLICATIONS APPROVED, NOT ACCEPTED 1 $87,810 29 $114,551 43 $113,239 11 $57,620 0 $0 23 $113,154 2 $79,205 APPLICATIONS DENIED 0 $0 44 $128,806 130 $110,658 24 $40,717 1 $3,240,540 35 $118,531 7 $67,010 APPLICATIONS WITHDRAWN 2 $143,970 20 $118,829 99 $122,008 10 $84,285 0 $0 16 $147,694 1 $79,330 FILES CLOSED FOR INCOMPLETENESS 0 $0 4 $100,178 30 $106,351 1 $45,330 0 $0 6 $88,570 1 $56,570
Aggregated Statistics For Year 2003(Based on 1 full and 3 partial tracts) A) FHA, FSA/RHS & VA B) Conventional C) Refinancings D) Home Improvement Loans E) Loans on Dwellings For 5+ Families F) Non-occupant Loans on Number Average Value Number Average Value Number Average Value Number Average Value Number Average Value Number Average Value
LOANS ORIGINATED 15 $90,913 130 $91,996 312 $93,239 16 $37,644 2 $1,606,450 98 $81,179 APPLICATIONS APPROVED, NOT ACCEPTED 1 $83,740 15 $83,346 41 $92,957 4 $35,278 0 $0 13 $84,944 APPLICATIONS DENIED 0 $0 25 $85,492 129 $91,869 16 $31,028 2 $1,016,860 26 $81,686 APPLICATIONS WITHDRAWN 2 $67,915 17 $103,113 86 $100,416 2 $46,635 0 $0 16 $105,782 FILES CLOSED FOR INCOMPLETENESS 0 $0 2 $102,675 10 $75,146 2 $95,310 0 $0 1 $77,880
Aggregated Statistics For Year 2002(Based on 1 full and 3 partial tracts) A) FHA, FSA/RHS & VA B) Conventional C) Refinancings D) Home Improvement Loans E) Loans on Dwellings For 5+ Families F) Non-occupant Loans on Number Average Value Number Average Value Number Average Value Number Average Value Number Average Value Number Average Value
LOANS ORIGINATED 14 $76,801 98 $83,601 152 $83,660 11 $23,294 1 $158,190 70 $67,773 APPLICATIONS APPROVED, NOT ACCEPTED 1 $81,720 16 $77,079 29 $93,182 7 $30,993 0 $0 9 $68,066 APPLICATIONS DENIED 2 $90,335 14 $77,451 82 $77,860 14 $15,612 0 $0 16 $68,638 APPLICATIONS WITHDRAWN 2 $67,845 12 $94,304 56 $87,173 3 $23,097 0 $0 7 $81,747 FILES CLOSED FOR INCOMPLETENESS 0 $0 2 $104,320 8 $88,890 0 $0 0 $0 0 $0
Aggregated Statistics For Year 2001(Based on 1 full and 3 partial tracts) A) FHA, FSA/RHS & VA B) Conventional C) Refinancings D) Home Improvement Loans E) Loans on Dwellings For 5+ Families F) Non-occupant Loans on Number Average Value Number Average Value Number Average Value Number Average Value Number Average Value Number Average Value
LOANS ORIGINATED 23 $69,514 82 $69,863 117 $78,013 9 $21,271 3 $660,180 53 $57,110 APPLICATIONS APPROVED, NOT ACCEPTED 2 $79,125 9 $94,418 19 $75,541 3 $19,423 0 $0 3 $84,173 APPLICATIONS DENIED 2 $62,300 23 $60,962 73 $70,431 16 $19,272 0 $0 14 $61,811 APPLICATIONS WITHDRAWN 2 $97,135 7 $80,257 45 $71,402 2 $25,495 0 $0 5 $61,450 FILES CLOSED FOR INCOMPLETENESS 0 $0 3 $85,627 12 $74,439 0 $0 0 $0 3 $48,433
Aggregated Statistics For Year 2000(Based on 1 full and 3 partial tracts) A) FHA, FSA/RHS & VA B) Conventional C) Refinancings D) Home Improvement Loans E) Loans on Dwellings For 5+ Families F) Non-occupant Loans on Number Average Value Number Average Value Number Average Value Number Average Value Number Average Value Number Average Value
LOANS ORIGINATED 31 $66,672 62 $57,616 50 $67,284 11 $16,945 1 $227,780 30 $50,090 APPLICATIONS APPROVED, NOT ACCEPTED 2 $48,275 5 $78,606 16 $70,172 10 $18,940 0 $0 4 $48,758 APPLICATIONS DENIED 6 $53,413 28 $65,592 74 $64,674 17 $24,322 2 $1,149,440 16 $58,113 APPLICATIONS WITHDRAWN 2 $64,885 14 $56,169 29 $53,664 2 $16,260 0 $0 3 $31,287 FILES CLOSED FOR INCOMPLETENESS 1 $79,880 2 $37,545 5 $72,826 0 $0 0 $0 1 $48,660
Aggregated Statistics For Year 1999(Based on 1 full and 2 partial tracts) A) FHA, FSA/RHS & VA B) Conventional C) Refinancings D) Home Improvement Loans E) Loans on Dwellings For 5+ Families F) Non-occupant Loans on Number Average Value Number Average Value Number Average Value Number Average Value Number Average Value Number Average Value
LOANS ORIGINATED 24 $63,345 42 $57,130 69 $60,689 10 $23,107 0 $0 26 $48,783 APPLICATIONS APPROVED, NOT ACCEPTED 2 $45,590 4 $85,768 16 $71,011 5 $21,872 0 $0 2 $64,480 APPLICATIONS DENIED 5 $67,864 16 $61,146 68 $58,350 12 $21,836 2 $169,750 14 $51,347 APPLICATIONS WITHDRAWN 2 $54,225 9 $67,620 31 $59,526 2 $23,680 0 $0 6 $45,850 FILES CLOSED FOR INCOMPLETENESS 1 $77,540 3 $52,747 8 $58,679 0 $0 0 $0 2 $30,705
Detailed HMDA statistics for the following Tracts:
0027.00
, 0028.00 , 0030.00 , 0031.00
Private Mortgage Insurance Companies Aggregated Statistics For Year 2009(Based on 2 partial tracts) A) Conventional Number Average Value
LOANS ORIGINATED 1 $247,950 APPLICATIONS APPROVED, NOT ACCEPTED 0 $0 APPLICATIONS DENIED 0 $0 APPLICATIONS WITHDRAWN 0 $0 FILES CLOSED FOR INCOMPLETENESS 0 $0
Aggregated Statistics For Year 2008(Based on 1 full and 3 partial tracts) A) Conventional B) Refinancings C) Non-occupant Loans on Number Average Value Number Average Value Number Average Value
LOANS ORIGINATED 6 $186,795 2 $172,985 2 $163,230 APPLICATIONS APPROVED, NOT ACCEPTED 4 $169,665 2 $193,090 1 $132,130 APPLICATIONS DENIED 0 $0 1 $150,070 0 $0 APPLICATIONS WITHDRAWN 0 $0 0 $0 0 $0 FILES CLOSED FOR INCOMPLETENESS 1 $270,680 0 $0 0 $0
Aggregated Statistics For Year 2007(Based on 1 full and 3 partial tracts) A) Conventional B) Refinancings C) Non-occupant Loans on Number Average Value Number Average Value Number Average Value
LOANS ORIGINATED 10 $202,645 9 $216,542 2 $136,070 APPLICATIONS APPROVED, NOT ACCEPTED 3 $177,030 2 $240,450 0 $0 APPLICATIONS DENIED 0 $0 0 $0 0 $0 APPLICATIONS WITHDRAWN 2 $134,955 1 $169,760 0 $0 FILES CLOSED FOR INCOMPLETENESS 0 $0 0 $0 0 $0
Aggregated Statistics For Year 2006(Based on 1 full and 3 partial tracts) A) Conventional B) Refinancings C) Non-occupant Loans on D) Loans On Manufactured Number Average Value Number Average Value Number Average Value Number Average Value
LOANS ORIGINATED 5 $198,300 6 $188,218 1 $215,380 1 $101,610 APPLICATIONS APPROVED, NOT ACCEPTED 2 $189,085 0 $0 0 $0 0 $0 APPLICATIONS DENIED 0 $0 0 $0 0 $0 0 $0 APPLICATIONS WITHDRAWN 0 $0 1 $321,130 0 $0 0 $0 FILES CLOSED FOR INCOMPLETENESS 0 $0 0 $0 0 $0 0 $0
Aggregated Statistics For Year 2005(Based on 1 full and 3 partial tracts) A) Conventional B) Refinancings C) Non-occupant Loans on Number Average Value Number Average Value Number Average Value
LOANS ORIGINATED 8 $153,380 6 $186,402 4 $109,665 APPLICATIONS APPROVED, NOT ACCEPTED 2 $97,275 2 $140,795 1 $143,130 APPLICATIONS DENIED 0 $0 0 $0 0 $0 APPLICATIONS WITHDRAWN 1 $122,000 0 $0 1 $122,000 FILES CLOSED FOR INCOMPLETENESS 0 $0 0 $0 0 $0
Aggregated Statistics For Year 2004(Based on 1 full and 3 partial tracts) A) Conventional B) Refinancings C) Non-occupant Loans on D) Loans On Manufactured Number Average Value Number Average Value Number Average Value Number Average Value
LOANS ORIGINATED 23 $127,083 4 $137,085 11 $121,878 1 $171,780 APPLICATIONS APPROVED, NOT ACCEPTED 3 $113,380 2 $130,930 1 $83,860 0 $0 APPLICATIONS DENIED 1 $129,620 0 $0 1 $129,620 0 $0 APPLICATIONS WITHDRAWN 0 $0 0 $0 0 $0 0 $0 FILES CLOSED FOR INCOMPLETENESS 0 $0 0 $0 0 $0 0 $0
Aggregated Statistics For Year 2003(Based on 1 full and 3 partial tracts) A) Conventional B) Refinancings C) Non-occupant Loans on Number Average Value Number Average Value Number Average Value
LOANS ORIGINATED 32 $101,956 9 $100,174 10 $83,149 APPLICATIONS APPROVED, NOT ACCEPTED 8 $137,064 2 $102,095 1 $147,280 APPLICATIONS DENIED 0 $0 0 $0 0 $0 APPLICATIONS WITHDRAWN 0 $0 0 $0 0 $0 FILES CLOSED FOR INCOMPLETENESS 0 $0 0 $0 0 $0
Aggregated Statistics For Year 2002(Based on 1 full and 3 partial tracts) A) Conventional B) Refinancings C) Non-occupant Loans on Number Average Value Number Average Value Number Average Value
LOANS ORIGINATED 30 $97,450 8 $121,214 12 $75,308 APPLICATIONS APPROVED, NOT ACCEPTED 3 $78,367 3 $73,020 2 $58,300 APPLICATIONS DENIED 0 $0 0 $0 0 $0 APPLICATIONS WITHDRAWN 0 $0 0 $0 0 $0 FILES CLOSED FOR INCOMPLETENESS 0 $0 0 $0 0 $0
Aggregated Statistics For Year 2001(Based on 1 full and 3 partial tracts) A) Conventional B) Refinancings C) Non-occupant Loans on Number Average Value Number Average Value Number Average Value
LOANS ORIGINATED 32 $86,320 8 $86,718 7 $54,977 APPLICATIONS APPROVED, NOT ACCEPTED 2 $65,280 3 $70,623 2 $68,260 APPLICATIONS DENIED 0 $0 0 $0 0 $0 APPLICATIONS WITHDRAWN 1 $92,230 0 $0 0 $0 FILES CLOSED FOR INCOMPLETENESS 0 $0 0 $0 0 $0
Aggregated Statistics For Year 2000(Based on 1 full and 3 partial tracts) A) Conventional B) Refinancings C) Non-occupant Loans on Number Average Value Number Average Value Number Average Value
LOANS ORIGINATED 29 $66,221 5 $82,556 11 $49,755 APPLICATIONS APPROVED, NOT ACCEPTED 2 $66,475 1 $72,490 3 $46,327 APPLICATIONS DENIED 0 $0 0 $0 0 $0 APPLICATIONS WITHDRAWN 0 $0 1 $91,530 0 $0 FILES CLOSED FOR INCOMPLETENESS 0 $0 0 $0 0 $0
Aggregated Statistics For Year 1999(Based on 1 full and 2 partial tracts) A) Conventional B) Refinancings C) Non-occupant Loans on Number Average Value Number Average Value Number Average Value
LOANS ORIGINATED 8 $71,242 2 $119,110 1 $71,780 APPLICATIONS APPROVED, NOT ACCEPTED 0 $0 0 $0 0 $0 APPLICATIONS DENIED 2 $83,140 0 $0 0 $0 APPLICATIONS WITHDRAWN 0 $0 0 $0 0 $0 FILES CLOSED FOR INCOMPLETENESS 0 $0 0 $0 0 $0
Detailed PMIC statistics for the following Tracts:
0027.00
, 0028.00 , 0030.00 , 0031.00 Fire-safe hotels and motels in Oroville, California:
Comfort Inn, 1470 Feather Riv Blvd, Oroville, California 95965 Phone: (530) 533-9675, Fax: (530) 533-5862
Gold Country Casino And Hotel, 4020 Olive Hwy, Oroville, California 95966 Phone: (530) 534-9892, Fax: (530) 534-9123
Sunset Inn, 1835 Feather River Blvd, Oroville, California 95965 Phone: (530) 533-8201, Fax: (530) 533-7515
Holiday Inn Express Oroville, 550 Oroville Dam Blvd, Oroville, California 95966 Phone: (530) 534-5566, Fax: (530) 534-5599
Americas Best Value Inn & Suites, 580 Oro Dm, Oroville, California 95965 Phone: (530) 533-7070, Fax: (530) 532-0402
All 5 fire-safe hotels and motels in Oroville, California
Most common first names in Oroville, CA among deceased individuals Name Count Lived (average)
John 370 73.3 years William 354 75.0 years James 345 71.9 years Robert 314 71.5 years Mary 263 79.8 years Charles 238 75.4 years George 225 77.1 years Dorothy 155 77.7 years Richard 140 69.5 years Frank 132 76.6 years
Most common last names in Oroville, CA among deceased individuals Last name Count Lived (average)
Smith 176 74.5 years Brown 126 76.5 years Johnson 121 76.0 years Jones 106 73.2 years Williams 98 74.9 years Miller 87 75.1 years Davis 78 74.1 years Anderson 77 76.4 years Clark 70 74.6 years Martin 68 73.7 years
Oroville compared to California state average:
Median household income below state average. Median house value significantly below state average. Foreign-born population percentage significantly below state average. Length of stay since moving in significantly above state average. Institutionalized population percentage significantly above state average. Percentage of population with a bachelor's degree or higher below state average.
#34 on the list of "Top 101 cities with largest percentage of males in occupations: healthcare support occupations (population 5,000+)"
#37 on the list of "Top 101 cities with the largest percentage of people in halfway houses (population 1,000+)"
#40 on the list of "Top 101 cities with the most residents born in Thailand (population 500+)"
#73 on the list of "Top 101 cities with the largest percentage of unmarried partner households (population 5,000+)"
#95 on the list of "Top 101 cities with largest percentage of females in industries: arts, entertainment, and recreation (population 5,000+)"
#12 on the list of "Top 101 counties with the lowest lead air pollution readings in 2012 (µg/m3 )"
#15 on the list of "Top 101 counties with the highest carbon monoxide air pollution readings in 2012 (ppm)"
#17 on the list of "Top 101 counties with the highest lead air pollution readings in 2012 (µg/m3 )"
#18 on the list of "Top 101 counties with highest percentage of residents voting for 3rd party candidates in the 2012 Presidential Election (pop. 50,000+)"
#37 on the list of "Top 101 counties with the lowest percentage of residents relocating to foreign countries in 2011"
Top Patent Applicants
Drew P. Henry (5)
Willem Crone (4)
Steven J. Koch (3)
Kent Scheidel Mckenzie (3)
Daniel B. Shipman (2)
Joe Dunning (2)
Kent S. Mckenzie (2)
Steven H. Horn (1)
Tommy Jack Card (1)
Daniel A. Baldwin (1)
Total of 33 patent applications in 2008-2024.
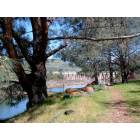

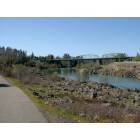


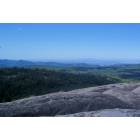
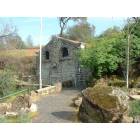
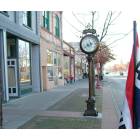
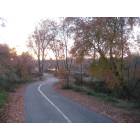

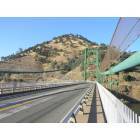
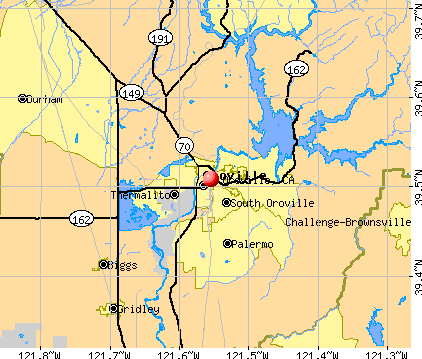


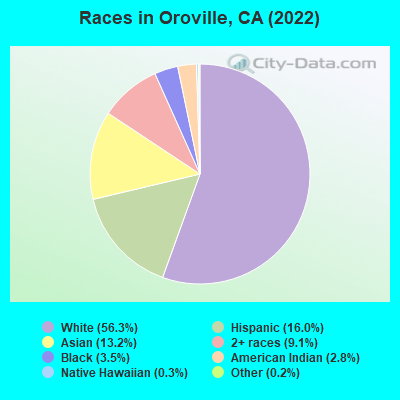
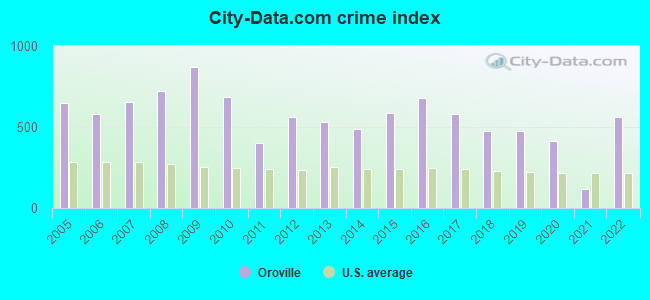
 Recent articles from our blog. Our writers, many of them Ph.D. graduates or candidates, create easy-to-read articles on a wide variety of topics.

 (21.9 miles
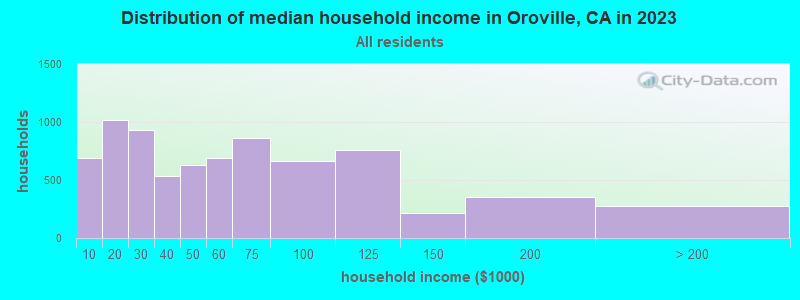
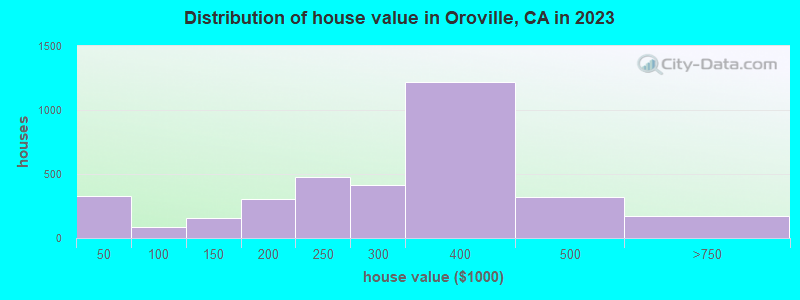

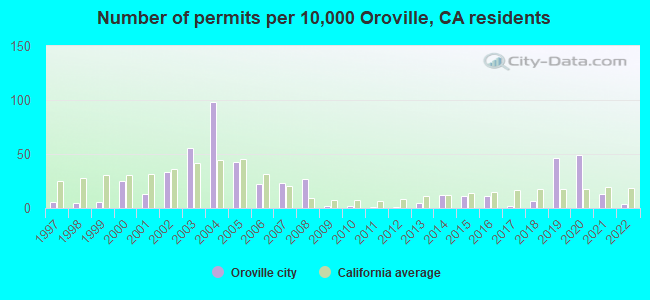
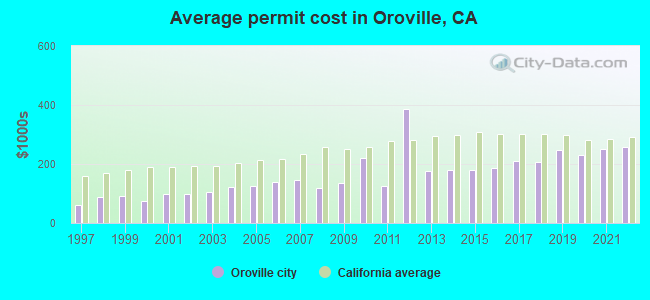
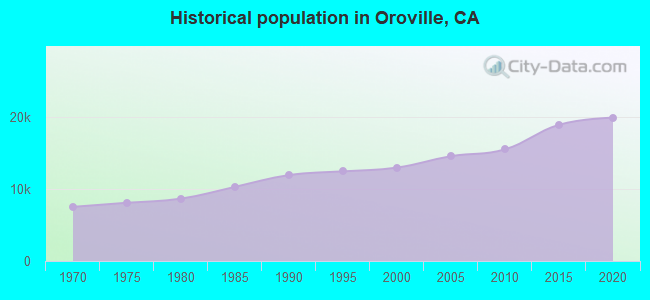
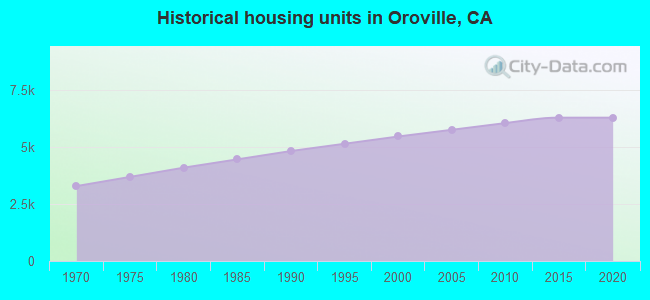
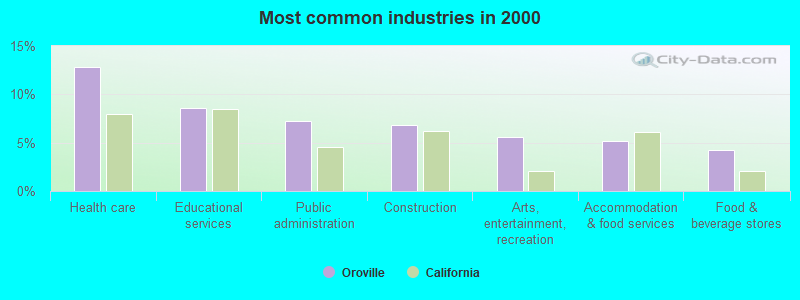
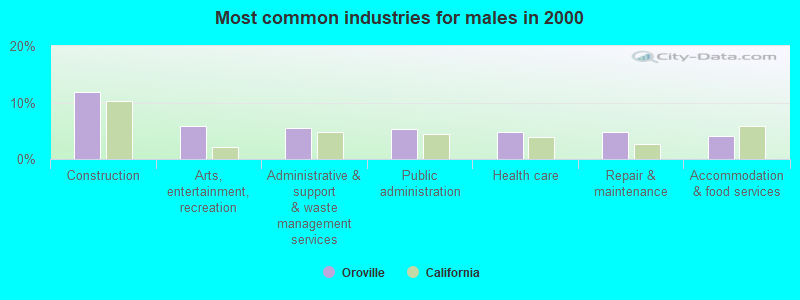
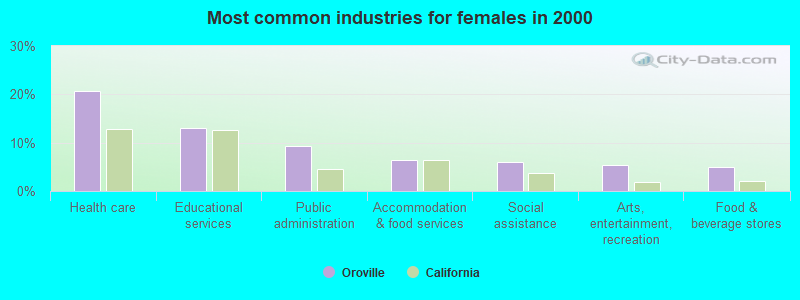
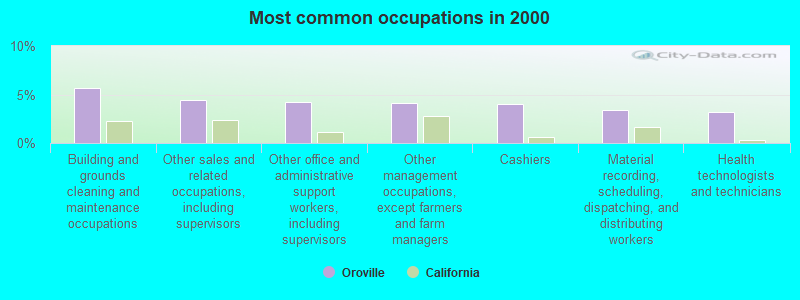
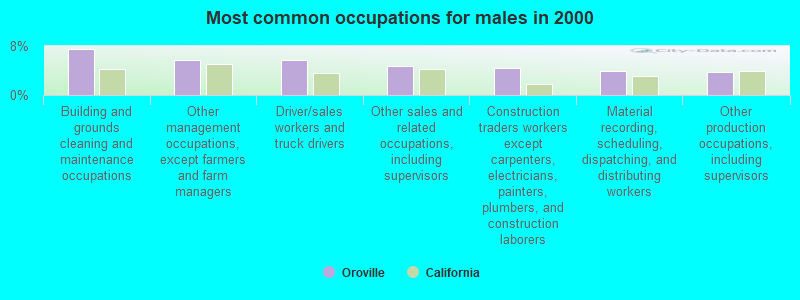
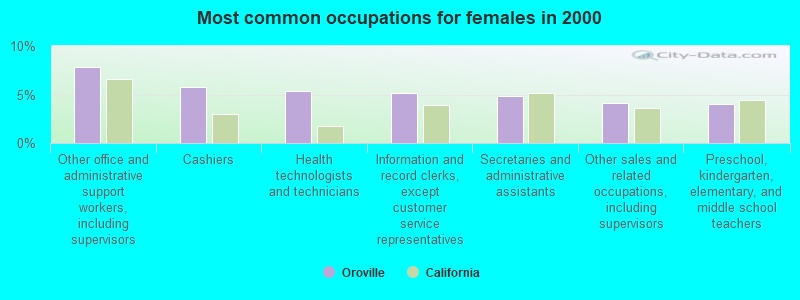
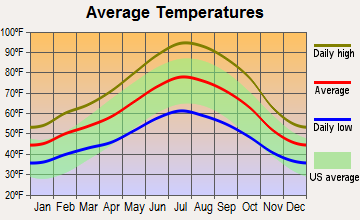
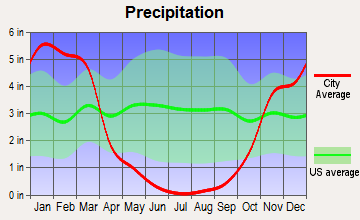
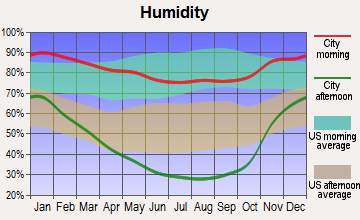
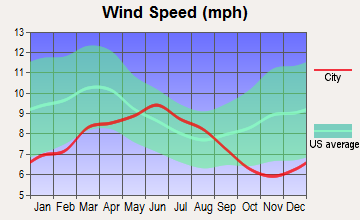
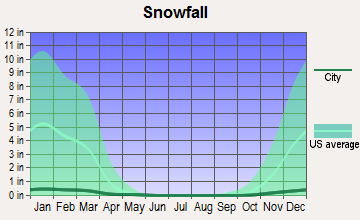
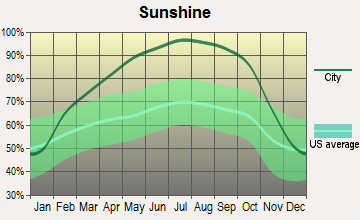

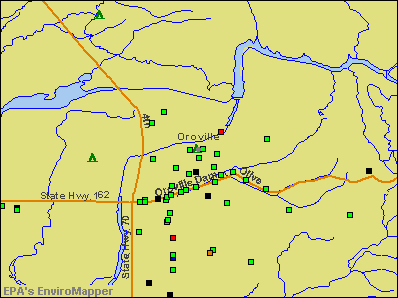

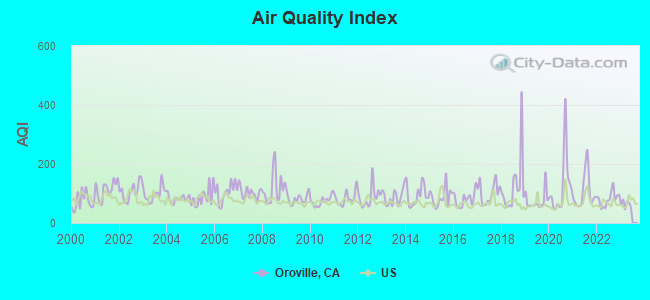
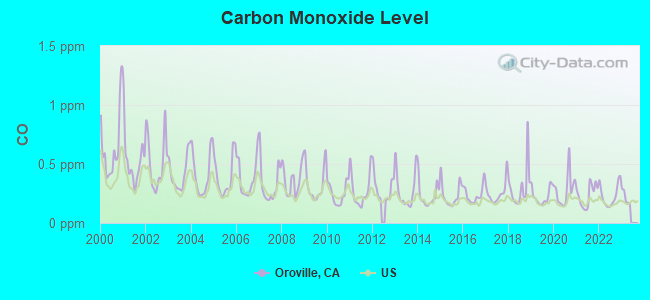
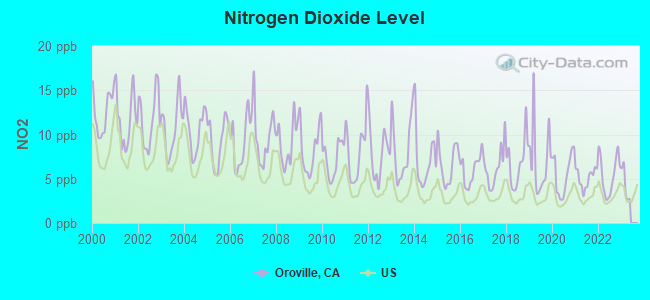
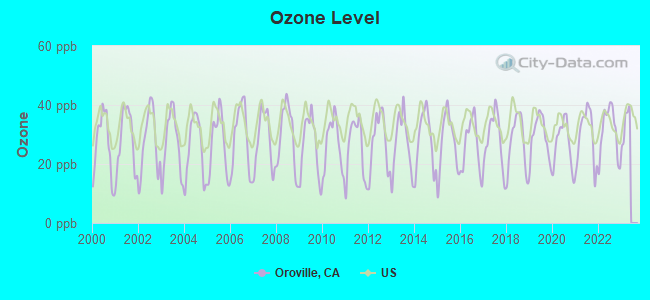
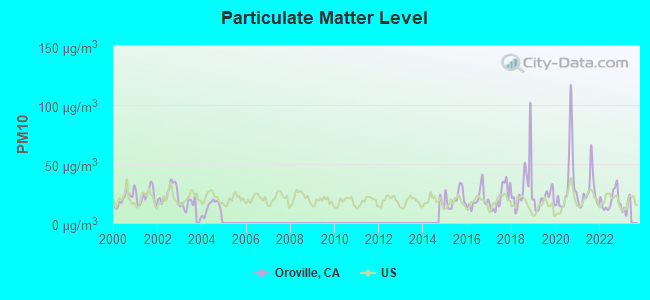
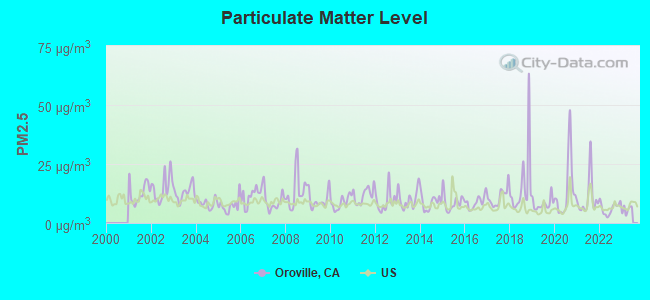
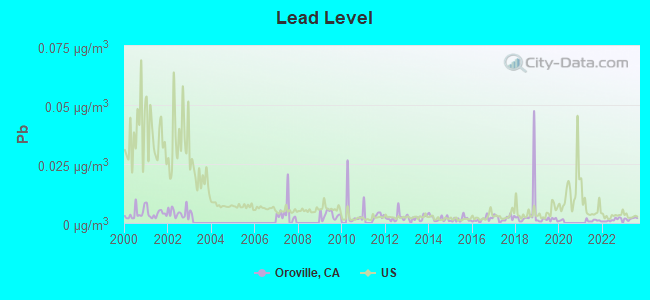
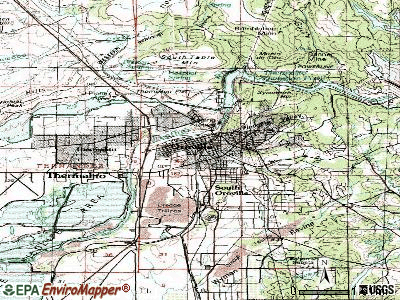
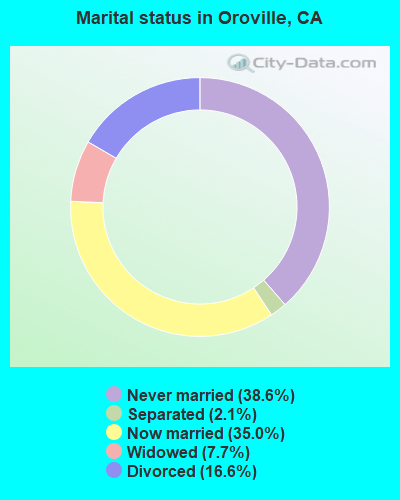
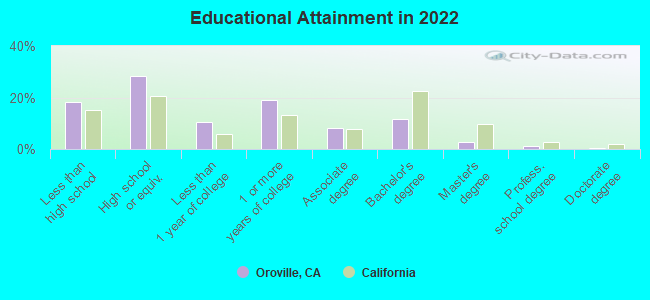
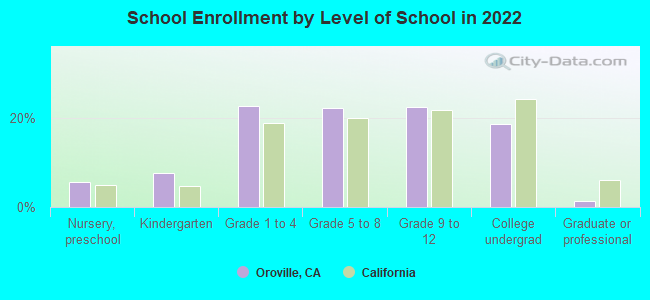
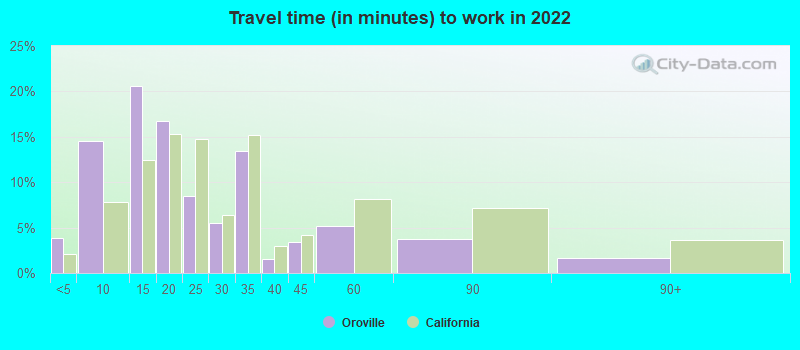
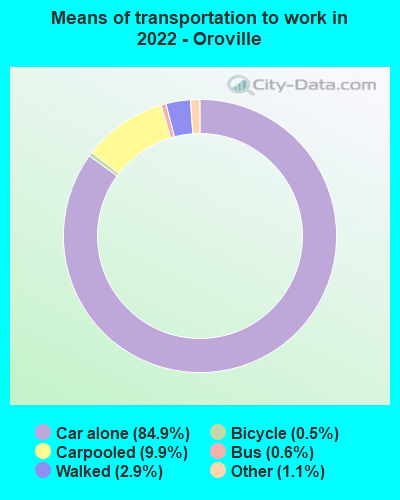
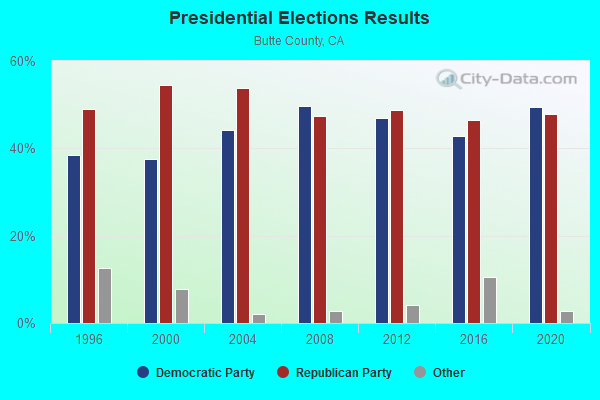
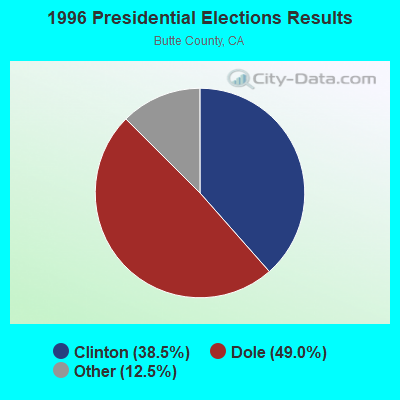
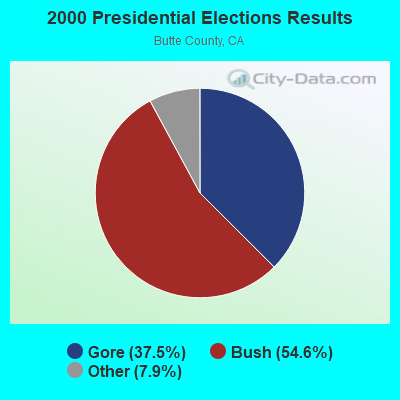
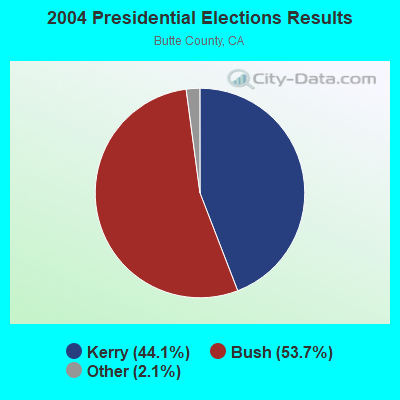
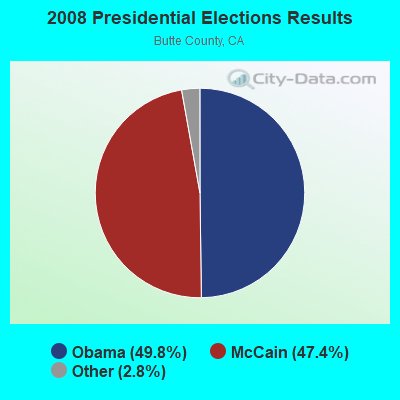
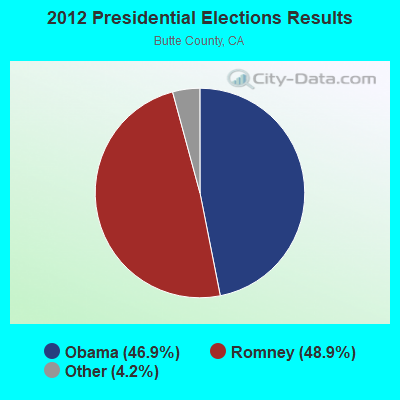
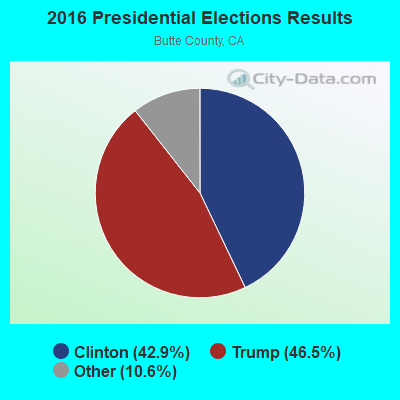
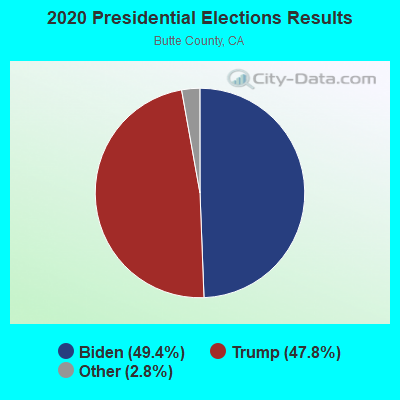
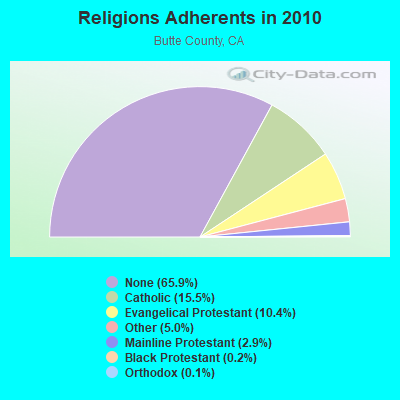
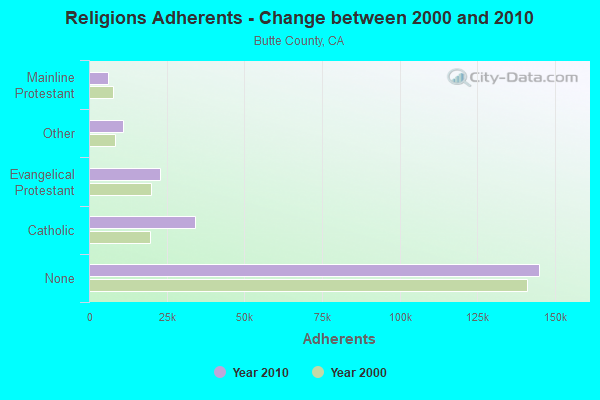
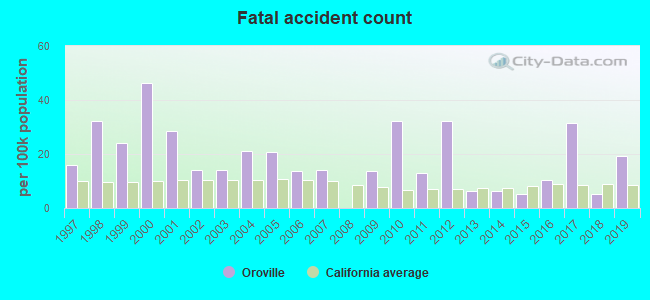
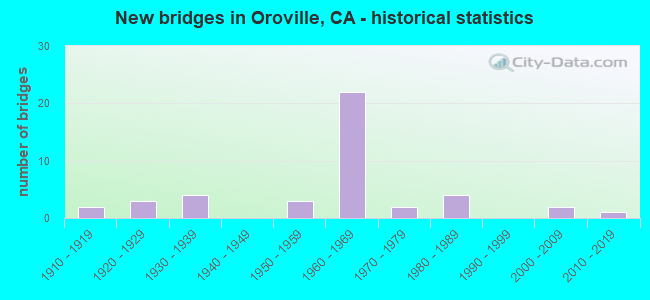
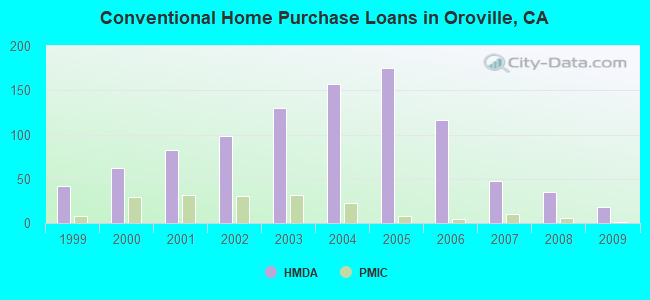
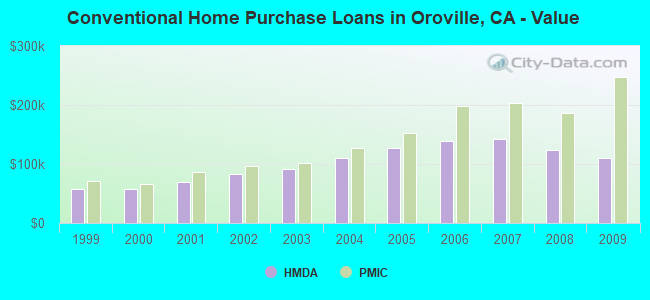
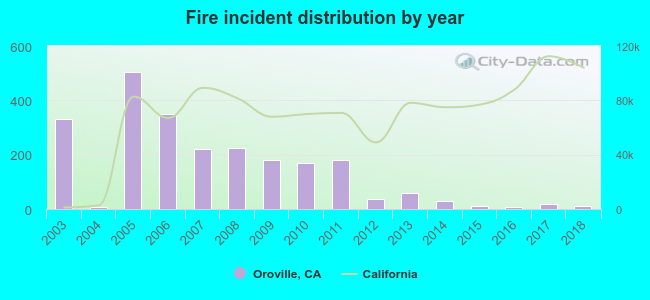 According to the data from the years 2003 - 2018 the average number of fires per year is 147. The highest number of fires - 506 took place in 2005, and the least - 8 in 2004. The data has a decreasing trend.
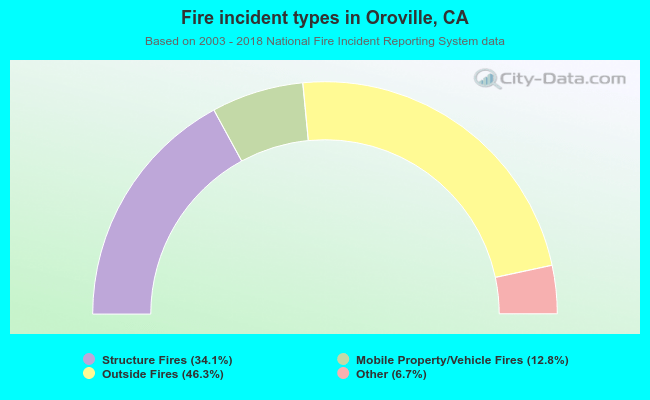 When looking into fire subcategories, the most incidents belonged to: Outside Fires (46.3%), and Structure Fires (34.1%).