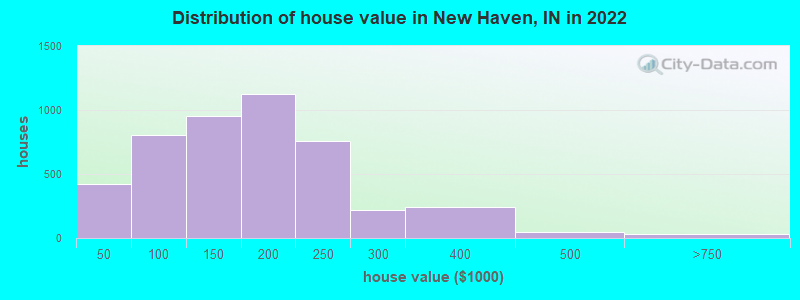
Estimated median house or condo value in 2022: $162,869 (it was $73,300 in 2000)
New Haven:
$162,869
IN:
$208,700
Mean prices in 2022:all housing units: $242,726; detached houses: $164,571; townhouses or other attached units: over $1,000,000; mobile homes: $858,160
Median gross rent in 2022: $973.
March 2022 cost of living index in New Haven: 83.0 (low, U.S. average is 100)
Percentage of residents living in poverty in 2022: 7.7%
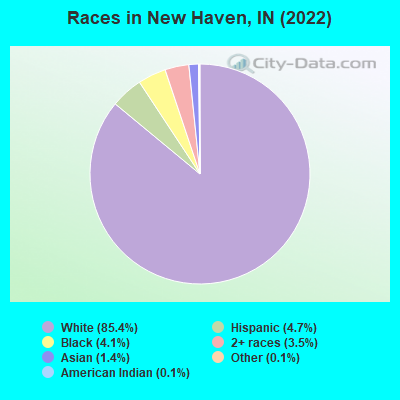
(6.3% for White Non-Hispanic residents, 34.8% for Black residents, 8.2% for Hispanic or Latino residents, 1.5% for other race residents, 12.2% for two or more races residents)
According to our research of Indiana and other state lists, there were 2 registered sex offenders living in New Haven, Indiana as of June 03, 2024. The ratio of all residents to sex offenders in New Haven is 7,942 to 1. The ratio of registered sex offenders to all residents in this city is much lower than the state average.
Crime rates in New Haven by year
Type
2009
2010
2011
2012
2013
2014
2015
2016
2017
2018
2019
2020
2021
2022
Murders (per 100,000)
0 (0.0)
0 (0.0)
0 (0.0)
0 (0.0)
0 (0.0)
0 (0.0)
0 (0.0)
1 (6.3)
1 (6.5)
1 (6.4)
2 (12.6)
0 (0.0)
0 (0.0)
0 (0.0)
Rapes (per 100,000)
2 (14.6)
1 (6.8)
5 (33.6)
4 (26.7)
2 (12.8)
3 (19.2)
8 (50.6)
3 (18.9)
4 (25.8)
13 (83.0)
6 (37.9)
3 (18.7)
8 (49.7)
2 (12.6)
Robberies (per 100,000)
11 (80.1)
9 (60.8)
11 (74.0)
8 (53.4)
13 (83.5)
6 (38.4)
8 (50.6)
5 (31.5)
13 (84.0)
13 (83.0)
15 (94.8)
6 (37.4)
4 (24.9)
1 (6.3)
Assaults (per 100,000)
10 (72.8)
14 (94.6)
9 (60.5)
20 (133.6)
9 (57.8)
7 (44.8)
6 (38.0)
29 (182.6)
20 (129.2)
24 (153.2)
24 (151.7)
35 (218.2)
28 (174.0)
28 (176.6)
Burglaries (per 100,000)
57 (415.2)
69 (466.4)
60 (403.5)
80 (534.5)
83 (532.9)
41 (262.2)
31 (196.2)
47 (295.9)
40 (258.4)
35 (223.4)
42 (265.5)
22 (137.1)
26 (161.6)
43 (271.2)
Thefts (per 100,000)
280 (2,039)
294 (1,987)
317 (2,132)
336 (2,245)
422 (2,709)
260 (1,663)
203 (1,285)
294 (1,851)
266 (1,718)
242 (1,544)
244 (1,542)
165 (1,028)
135 (839.1)
124 (782.0)
Auto thefts (per 100,000)
30 (218.5)
16 (108.2)
24 (161.4)
30 (200.4)
27 (173.4)
30 (191.9)
24 (151.9)
12 (75.5)
29 (187.3)
25 (159.6)
40 (252.8)
24 (149.6)
15 (93.2)
20 (126.1)
Arson (per 100,000)
0 (0.0)
0 (0.0)
1 (6.7)
6 (40.1)
0 (0.0)
0 (0.0)
0 (0.0)
4 (25.2)
1 (6.5)
0 (0.0)
3 (19.0)
4 (24.9)
1 (6.2)
0 (0.0)
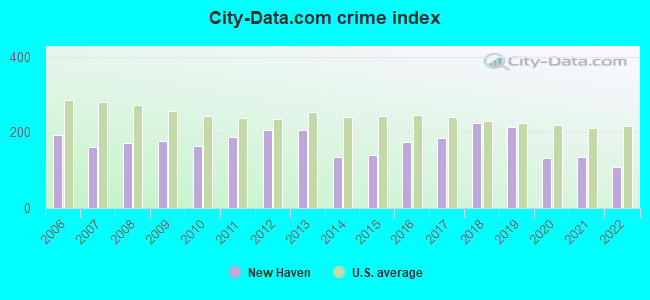
City-Data.com crime index
178.4
163.4
187.6
207.4
206.4
136.0
140.5
174.4
186.4
224.8
214.9
132.5
134.4
107.7
The City-Data.com crime index weighs serious crimes and violent crimes more heavily. Higher means more crime, U.S. average is 246.1. It adjusts for the number of visitors and daily workers commuting into cities.
Latest news from New Haven, IN collected exclusively by city-data.com from local newspapers, TV, and radio stations
Ancestries: German (35.2%), American (14.5%), English (6.8%), Irish (5.3%), European (3.6%), Polish (1.1%).
Current Local Time: EST time zone
Incorporated in 1865
Elevation: 758 feet
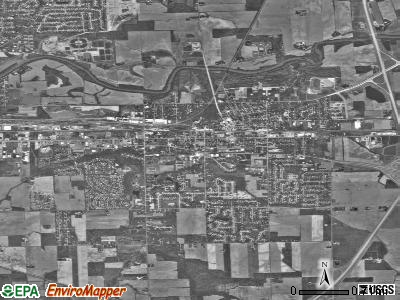
Land area: 8.15 square miles.
Population density: 1,944 people per square mile (low).
608 residents are foreign born (2.2% Latin America, 0.8% Asia, 0.4% North America).
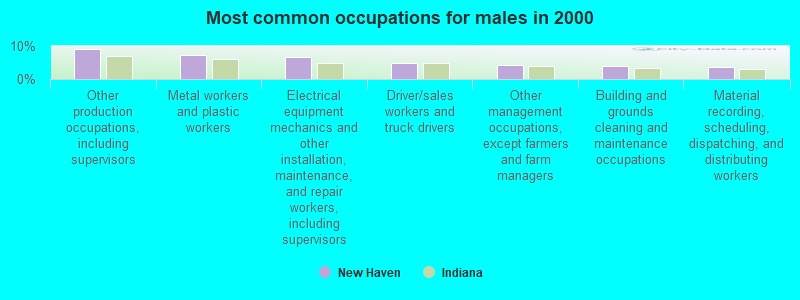
This city:
3.8%
Indiana:
5.6%
Median real estate property taxes paid for housing units with mortgages in 2022: $1,165 (0.7%) Median real estate property taxes paid for housing units with no mortgage in 2022: $1,112 (0.7%)
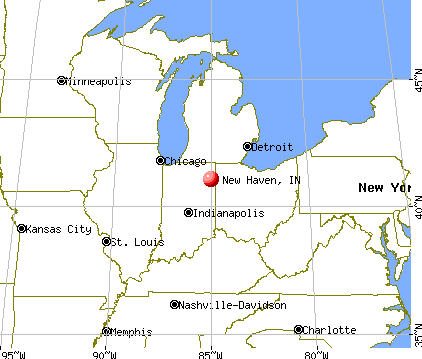
Nearest city with pop. 50,000+: Fort Wayne, IN (5.5 miles , pop. 205,727).
Nearest city with pop. 1,000,000+: Chicago, IL (147.8 miles , pop. 2,896,016).
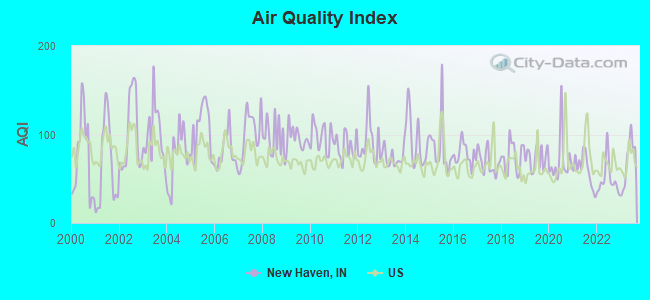
Air Quality Index (AQI) level in 2023 was 69.2. This is about average.
City:
69.2
U.S.:
72.6
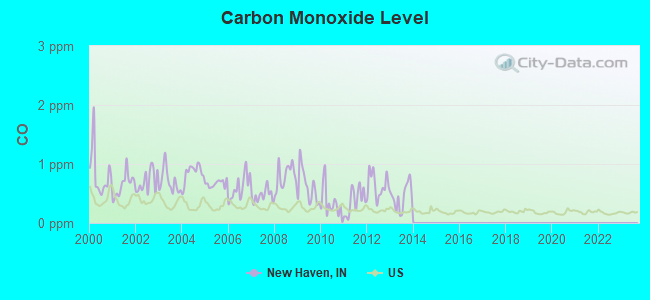
Carbon Monoxide (CO) [ppm] level in 2013 was 0.447. This is significantly worse than average.Closest monitor was 6.0 miles away from the city center.
City:
0.447
U.S.:
0.251
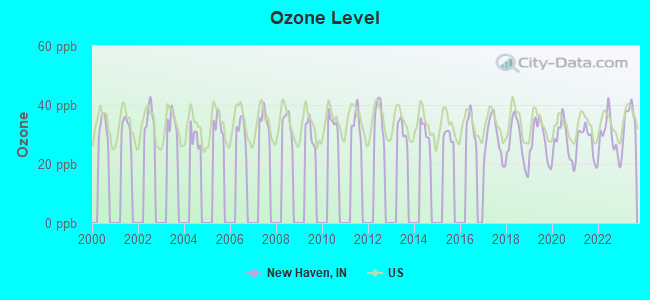
Ozone [ppb] level in 2023 was 34.9. This is about average.Closest monitor was 4.6 miles away from the city center.
City:
34.9
U.S.:
33.3
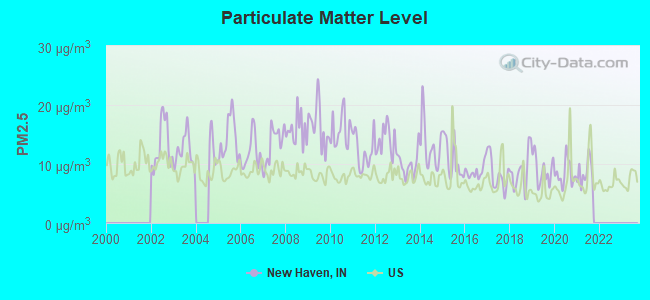
Particulate Matter (PM2.5) [µg/m3] level in 2021 was 8.61. This is about average.Closest monitor was 4.6 miles away from the city center.
City:
8.61
U.S.:
8.11
Tornado activity:
New Haven-area historical tornado activity is near Indiana state average. It is 72% greater than the overall U.S. average.
On 11/10/2002, a category F4 (max. wind speeds 207-260 mph) tornado 23.8 miles away from the New Haven city center killed 4 peopleand injured 17 peopleand caused $30 million in damages.
On 5/16/1968, a category F3 (max. wind speeds 158-206 mph) tornado 2.5 miles away from the city center killed one personand injured 15 peopleand causedbetween $50,000 and $500,000 in damages.
Earthquake activity:
New Haven-area historical earthquake activity is significantly above Indiana state average. It is 1% smaller than the overall U.S. average.
On 7/12/1986 at 08:19:37, a magnitude 4.5 (4.5 MB, Class: Light, Intensity: IV - V) earthquake occurred 50.1 miles away from New Haven center On 4/18/2008 at 09:36:59, a magnitude 5.4 (5.1 MB, 4.8 MS, 5.4 MW, 5.2 MW, Class: Moderate, Intensity: VI - VII) earthquake occurred 236.5 miles away from the city center On 7/27/1980 at 18:52:21, a magnitude 5.2 (5.1 MB, 4.7 MS, 5.0 UK, 5.2 UK) earthquake occurred 206.2 miles away from New Haven center On 4/18/2008 at 09:36:59, a magnitude 5.2 (5.2 MW, Depth: 8.9 mi) earthquake occurred 236.5 miles away from the city center On 6/10/1987 at 23:48:54, a magnitude 5.1 (4.9 MB, 4.4 MS, 4.6 MS, 5.1 LG) earthquake occurred 217.2 miles away from the city center On 9/25/1998 at 19:52:52, a magnitude 5.2 (4.8 MB, 4.3 MS, 5.2 LG, 4.5 MW, Depth: 3.1 mi) earthquake occurred 242.2 miles away from New Haven center Magnitude types: regional Lg-wave magnitude (LG), body-wave magnitude (MB), surface-wave magnitude (MS), moment magnitude (MW)
Natural disasters:
The number of natural disasters in Allen County (14) is near the US average (15). Major Disasters (Presidential) Declared: 9 Emergencies Declared: 4
Causes of natural disasters: Floods: 8, Storms: 7, Winter Storms: 4, Tornadoes: 3, Hurricane: 1, Snow: 1, Snowstorm: 1, Other: 1 (Note: some incidents may be assigned to more than one category).
Hospitals and medical centers in New Haven:
BRIGHTON HALL NURSING CENTER (1201 DALY DRIVE)
NEW HAVEN CARE AND REHABILITATION CENTER (1201 DALY DR)
Notable locations in New Haven: New Haven - Adams Township Fire Department Station 1 and Emergency Medical Services (A), New Haven - Adams Township Fire Department Station 3 (B). Display/hide their locations on the map
Tourist attractions: T-N-T Entertainment (Amusement & Theme Parks; 10929 Lincoln Highway East), Halter Pool Tables (Arcades & Amusements; 305 E Lincoln Hwy).
Courts: Indiana State - License Branch-Bmv- New Haven (709 Lincoln Highway East), New Haven City - City Court- Traffic Tickets & Fines (815 Lincoln Highway East), Allen County - Superior Court- Juvenile Probation Department- Probation - Juve (925 Wells).
Birthplace of: Bubbles Hargrave - Major League Baseball catcher.
Allen County has a predicted average indoor radon screening level greater than 4 pCi/L (pico curies per liter) - Highest Potential
Drinking water stations with addresses in New Haven and their reported violations in the past:
NEW HAVEN WATER DEPARTMENT (Population served: 13,000, Purch surface water):
Past monitoring violations:
Monitoring and Reporting (DBP) - Between JUL-2013 and SEP-2013, Contaminant: Total Haloacetic Acids (HAA5). Follow-up actions: St Compliance achieved (OCT-07-2013), St Public Notif requested (DEC-04-2013), St Violation/Reminder Notice (DEC-04-2013)
Monitoring and Reporting (DBP) - Between JUL-2013 and SEP-2013, Contaminant: TTHM. Follow-up actions: St Compliance achieved (OCT-07-2013), St Public Notif requested (DEC-04-2013), St Violation/Reminder Notice (DEC-04-2013)
Monitoring and Reporting (DBP) - Between APR-2013 and JUN-2013, Contaminant: Total Haloacetic Acids (HAA5). Follow-up actions: St Public Notif requested (SEP-04-2013), St Violation/Reminder Notice (SEP-04-2013), St Compliance achieved (OCT-07-2013)
Monitoring and Reporting (DBP) - Between APR-2013 and JUN-2013, Contaminant: TTHM. Follow-up actions: St Public Notif requested (SEP-04-2013), St Violation/Reminder Notice (SEP-04-2013), St Compliance achieved (OCT-07-2013)
One minor monitoring violation
Drinking water stations with addresses in New Haven that have no violations reported:
RUPERT RIDGE AMISH SCHOOL (Population served: 140,Primary Water Source Type: Groundwater)
Average household size:
This city:
2.5 people
Indiana:
2.5 people
Percentage of family households:
This city:
68.3%
Whole state:
66.9%
Percentage of households with unmarried partners:
This city:
6.7%
Whole state:
6.9%
Likely homosexual households (counted as self-reported same-sex unmarried-partner households)
Lesbian couples: 0.4% of all households
Gay men: 0.2% of all households
89 people in nursing facilities/skilled-nursing facilities in 2010
People in group quarters in New Haven in 2000:
86 people in nursing homes
10 people in other nonhousehold living situations
2 people in religious group quarters
Banks with branches in New Haven (2011 data):
Fifth Third Bank: New Haven Branch at 1230 Lincoln Highway East, branch established on 1988/06/30. Info updated 2009/10/05: Bank assets: $114,540.4 mil, Deposits: $89,689.1 mil, headquarters in Cincinnati, OH, positive income, Commercial Lending Specialization, 1378 total offices, Holding Company: Fifth Third Bancorp
Wells Fargo Bank, National Association: New Haven Branch at 1536 U.S. Highway 30 East, branch established on 1979/04/02. Info updated 2011/04/05: Bank assets: $1,161,490.0 mil, Deposits: $905,653.0 mil, headquarters in Sioux Falls, SD, positive income, 6395 total offices, Holding Company: Wells Fargo & Company
JPMorgan Chase Bank, National Association: New Haven Branch at 321 Lincoln Highway West, branch established on 1977/02/28. Info updated 2011/11/10: Bank assets: $1,811,678.0 mil, Deposits: $1,190,738.0 mil, headquarters in Columbus, OH, positive income, International Specialization, 5577 total offices, Holding Company: Jpmorgan Chase & Co.
1st Source Bank: New Haven Branch at 134 Lincoln Highway, West, branch established on 1890/01/01. Info updated 2008/06/16: Bank assets: $4,361.6 mil, Deposits: $3,520.6 mil, headquarters in South Bend, IN, positive income, Commercial Lending Specialization, 79 total offices, Holding Company: 1st Source Corporation
PNC Bank, National Association: New Haven Branch at 411 Lincoln Highway West, branch established on 1977/07/14. Info updated 2012/03/20: Bank assets: $263,309.6 mil, Deposits: $197,343.0 mil, headquarters in Wilmington, DE, positive income, Commercial Lending Specialization, 3085 total offices, Holding Company: Pnc Financial Services Group, Inc., The
Grabill Bank: New Haven Branch at 11075 Isabelle Drive, branch established on 2000/10/30. Info updated 2006/11/03: Bank assets: $619.4 mil, Deposits: $458.4 mil, headquarters in Grabill, IN, positive income, Commercial Lending Specialization, 9 total offices, Holding Company: Independent Alliance Banks, Inc.
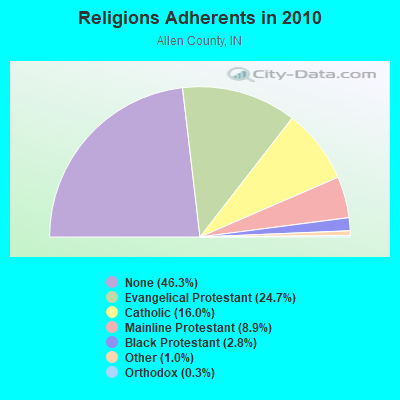
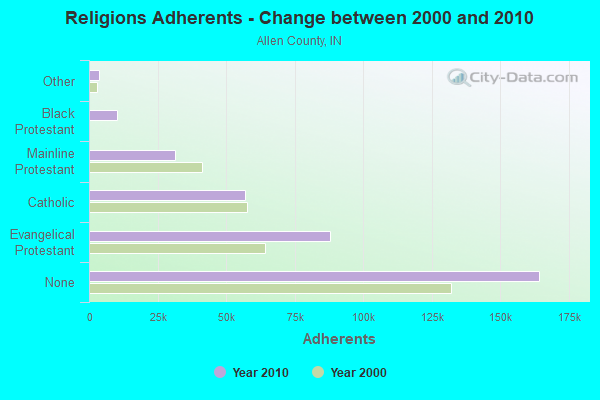
Religion statistics for New Haven, IN (based on Allen County data)
Religion
Adherents
Congregations
Evangelical Protestant
87,855
248
Catholic
56,898
22
Mainline Protestant
31,461
76
Black Protestant
10,108
26
Other
3,723
18
Orthodox
931
5
None
164,353
-
Source: Clifford Grammich, Kirk Hadaway, Richard Houseal, Dale E.Jones, Alexei Krindatch, Richie Stanley and Richard H.Taylor. 2012. 2010 U.S.Religion Census: Religious Congregations & Membership Study. Association of Statisticians of American Religious Bodies. Jones, Dale E., et al. 2002. Congregations and Membership in the United States 2000. Nashville, TN: Glenmary Research Center. Graphs represent county-level data
Aircraft: PIPER PA-28 (Category: Land, Seats: 2, Weight: Up to 12,499 Pounds, Speed: 107 mph), Engine: LYCOMING 0-320 SERIES (180 HP) (Reciprocating) N-Number: 5159W, N5159W, N-5159W, Serial Number: 28-190, Year manufactured: 1961, Airworthiness Date: 11/17/1961, Certificate Issue Date: 06/14/1989 Registrant (Co-Owned): Lynn R Ehle, 16231 Slusher Road, New Haven, IN 46774, Other Owners: Janice M Ehle
Aircraft: PIPER PA-11 (Category: Land, Seats: 2, Weight: Up to 12,499 Pounds, Speed: 67 mph), Engine: CONT MOTOR C90-12F (95 HP) (Reciprocating) N-Number: 657M, N657M, N-657M, Serial Number: 16878, Year manufactured: 1946, Airworthiness Date: 06/19/2014, Certificate Issue Date: 07/19/2016 Registrant (Co-Owned): Geoff L Robison, Po Box 28, New Haven, IN 46774, Other Owners: Brad L Hartz
Aircraft: GULFSTREAM AM CORP COMM DIV 695A (Category: Land, Engines: 2, Seats: 11, Weight: Up to 12,499 Pounds), Engine: AIRESEARCH TPE331 SERIES (904 HP) (Turbo-prop) N-Number: 695HT, N695HT, N-695HT, Serial Number: 96038, Year manufactured: 1982, Airworthiness Date: 12/31/2003, Certificate Issue Date: 12/12/2020 Registrant (Corporation): Challenge Tool & Manufacturing Inc, 11725 Lincoln Hwy E, New Haven, IN 46774
Aircraft: PIPER PA-31-350 (Category: Land, Engines: 2, Seats: 8, Weight: Up to 12,499 Pounds, Speed: 162 mph), Engine: Reciprocating N-Number: 71LK, N71LK, N-71LK, Serial Number: 31-8052155, Certificate Issue Date: 12/19/2015 Registrant (Corporation): Challenge Tool & Mfg Inc, 11725 Lincoln Hwy E, New Haven, IN 46774
Aircraft: CESSNA 172K (Category: Land, Seats: 4, Weight: Up to 12,499 Pounds, Speed: 105 mph), Engine: LYCOMING 0-320 SERIES (180 HP) (4 Cycle) N-Number: 79102, N79102, N-79102, Serial Number: 17257882, Year manufactured: 1969, Airworthiness Date: 01/18/1969, Certificate Issue Date: 10/03/2012 Registrant (Individual): Scott I Strong, 1705 Woodmere Dr, New Haven, IN 46774
Aircraft: CESSNA 170A (Category: Land, Seats: 4, Weight: Up to 12,499 Pounds, Speed: 105 mph), Engine: CONT MOTOR C145 SERIES (145 HP) (Reciprocating) N-Number: 9969A, N9969A, N-9969A, Serial Number: 19628, Year manufactured: 1950, Airworthiness Date: 08/29/1956, Certificate Issue Date: 05/25/2004 Registrant (Individual): Geoff L Robison, Po Box 28, New Haven, IN 46774
Home Mortgage Disclosure Act Aggregated Statistics For Year 2009 (Based on 1 full and 3 partial tracts)
A) FHA, FSA/RHS & VA Home Purchase Loans
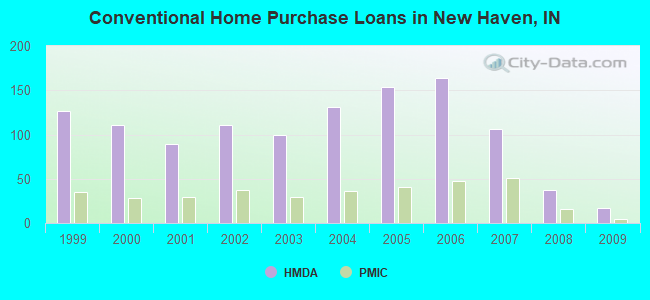
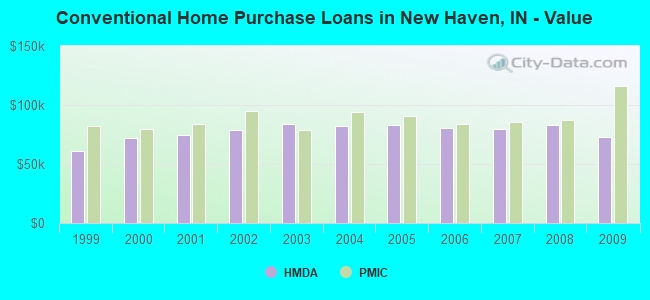
B) Conventional Home Purchase Loans
C) Refinancings
D) Home Improvement Loans
F) Non-occupant Loans on < 5 Family Dwellings (A B C & D)
G) Loans On Manufactured Home Dwelling (A B C & D)
Number
Average Value
Number
Average Value
Number
Average Value
Number
Average Value
Number
Average Value
Number
Average Value
LOANS ORIGINATED
54
$85,229
17
$73,006
148
$93,078
14
$25,811
12
$53,662
0
$0
APPLICATIONS APPROVED, NOT ACCEPTED
1
$25,490
1
$111,660
18
$87,568
0
$0
0
$0
1
$14,990
APPLICATIONS DENIED
5
$68,212
5
$64,462
55
$101,192
11
$9,491
4
$32,485
3
$4,063
APPLICATIONS WITHDRAWN
2
$81,855
1
$34,870
33
$106,794
5
$27,624
2
$75,495
1
$13,280
FILES CLOSED FOR INCOMPLETENESS
1
$50,410
1
$155,310
13
$85,015
0
$0
0
$0
0
$0
Aggregated Statistics For Year 2008 (Based on 1 full and 3 partial tracts)
A) FHA, FSA/RHS & VA Home Purchase Loans
B) Conventional Home Purchase Loans
C) Refinancings
D) Home Improvement Loans
F) Non-occupant Loans on < 5 Family Dwellings (A B C & D)
G) Loans On Manufactured Home Dwelling (A B C & D)
Number
Average Value
Number
Average Value
Number
Average Value
Number
Average Value
Number
Average Value
Number
Average Value
LOANS ORIGINATED
46
$81,277
37
$83,302
75
$88,130
16
$25,143
13
$81,914
1
$15,670
APPLICATIONS APPROVED, NOT ACCEPTED
1
$195,150
4
$72,008
9
$137,918
2
$14,695
2
$345,345
1
$20,180
APPLICATIONS DENIED
8
$72,068
11
$49,083
78
$84,319
26
$15,250
3
$46,630
4
$11,352
APPLICATIONS WITHDRAWN
4
$67,970
2
$95,070
43
$87,843
2
$27,065
0
$0
1
$12,260
FILES CLOSED FOR INCOMPLETENESS
0
$0
1
$89,780
6
$88,825
0
$0
0
$0
0
$0
Aggregated Statistics For Year 2007 (Based on 1 full and 3 partial tracts)
A) FHA, FSA/RHS & VA Home Purchase Loans
B) Conventional Home Purchase Loans
C) Refinancings
D) Home Improvement Loans
F) Non-occupant Loans on < 5 Family Dwellings (A B C & D)
G) Loans On Manufactured Home Dwelling (A B C & D)
Number
Average Value
Number
Average Value
Number
Average Value
Number
Average Value
Number
Average Value
Number
Average Value
LOANS ORIGINATED
29
$105,001
106
$79,425
123
$77,489
21
$22,304
25
$57,416
0
$0
APPLICATIONS APPROVED, NOT ACCEPTED
3
$105,170
12
$88,508
26
$86,907
6
$50,140
4
$60,958
1
$38,150
APPLICATIONS DENIED
6
$125,845
25
$75,345
106
$93,459
19
$33,174
8
$68,742
3
$29,413
APPLICATIONS WITHDRAWN
1
$106,200
8
$105,455
53
$79,171
4
$32,195
2
$75,030
0
$0
FILES CLOSED FOR INCOMPLETENESS
0
$0
4
$85,825
17
$95,272
1
$94,690
1
$118,980
0
$0
Aggregated Statistics For Year 2006 (Based on 1 full and 3 partial tracts)
A) FHA, FSA/RHS & VA Home Purchase Loans
B) Conventional Home Purchase Loans
C) Refinancings
D) Home Improvement Loans
E) Loans on Dwellings For 5+ Families
F) Non-occupant Loans on < 5 Family Dwellings (A B C & D)
G) Loans On Manufactured Home Dwelling (A B C & D)
Number
Average Value
Number
Average Value
Number
Average Value
Number
Average Value
Number
Average Value
Number
Average Value
Number
Average Value
LOANS ORIGINATED
33
$98,065
164
$80,343
137
$73,540
22
$24,959
2
$315,295
21
$53,514
5
$37,946
APPLICATIONS APPROVED, NOT ACCEPTED
2
$177,965
27
$88,473
29
$76,283
9
$33,897
0
$0
4
$37,215
1
$29,210
APPLICATIONS DENIED
3
$98,813
44
$72,450
121
$80,622
36
$19,194
0
$0
10
$57,747
8
$39,638
APPLICATIONS WITHDRAWN
1
$133,210
6
$80,823
65
$85,647
5
$28,358
0
$0
3
$56,660
2
$78,945
FILES CLOSED FOR INCOMPLETENESS
2
$73,120
5
$75,114
24
$90,148
0
$0
0
$0
0
$0
0
$0
Aggregated Statistics For Year 2005 (Based on 1 full and 3 partial tracts)
A) FHA, FSA/RHS & VA Home Purchase Loans
B) Conventional Home Purchase Loans
C) Refinancings
D) Home Improvement Loans
F) Non-occupant Loans on < 5 Family Dwellings (A B C & D)
G) Loans On Manufactured Home Dwelling (A B C & D)
Number
Average Value
Number
Average Value
Number
Average Value
Number
Average Value
Number
Average Value
Number
Average Value
LOANS ORIGINATED
40
$100,002
154
$83,083
161
$78,735
20
$28,505
16
$50,966
3
$27,970
APPLICATIONS APPROVED, NOT ACCEPTED
4
$107,708
17
$58,898
32
$72,300
5
$32,088
3
$59,150
2
$31,335
APPLICATIONS DENIED
3
$121,240
47
$65,633
142
$83,985
36
$29,700
7
$29,739
10
$27,136
APPLICATIONS WITHDRAWN
2
$65,735
23
$75,063
94
$90,177
8
$85,590
5
$53,812
1
$37,990
FILES CLOSED FOR INCOMPLETENESS
1
$44,080
12
$83,480
23
$84,787
1
$71,510
2
$39,040
0
$0
Aggregated Statistics For Year 2004 (Based on 1 full and 3 partial tracts)
A) FHA, FSA/RHS & VA Home Purchase Loans
B) Conventional Home Purchase Loans
C) Refinancings
D) Home Improvement Loans
F) Non-occupant Loans on < 5 Family Dwellings (A B C & D)
G) Loans On Manufactured Home Dwelling (A B C & D)
Number
Average Value
Number
Average Value
Number
Average Value
Number
Average Value
Number
Average Value
Number
Average Value
LOANS ORIGINATED
40
$103,437
131
$82,087
202
$73,566
24
$26,237
26
$84,802
8
$31,372
APPLICATIONS APPROVED, NOT ACCEPTED
1
$109,750
12
$78,048
35
$68,677
4
$34,348
2
$52,110
4
$29,170
APPLICATIONS DENIED
8
$103,640
37
$66,991
133
$76,938
36
$22,684
12
$48,938
13
$32,592
APPLICATIONS WITHDRAWN
2
$139,775
6
$93,598
100
$84,893
5
$29,222
3
$64,167
0
$0
FILES CLOSED FOR INCOMPLETENESS
1
$91,960
7
$85,301
13
$81,605
0
$0
2
$54,490
0
$0
Aggregated Statistics For Year 2003 (Based on 1 full and 3 partial tracts)
A) FHA, FSA/RHS & VA Home Purchase Loans
B) Conventional Home Purchase Loans
C) Refinancings
D) Home Improvement Loans
F) Non-occupant Loans on < 5 Family Dwellings (A B C & D)
Number
Average Value
Number
Average Value
Number
Average Value
Number
Average Value
Number
Average Value
LOANS ORIGINATED
57
$92,644
100
$83,777
368
$79,990
22
$19,758
22
$50,029
APPLICATIONS APPROVED, NOT ACCEPTED
4
$77,908
18
$67,764
65
$80,656
2
$32,220
4
$64,282
APPLICATIONS DENIED
6
$81,375
24
$59,124
148
$73,731
22
$11,892
4
$41,675
APPLICATIONS WITHDRAWN
7
$97,690
5
$70,800
109
$76,099
2
$16,355
4
$69,748
FILES CLOSED FOR INCOMPLETENESS
1
$75,280
3
$70,457
22
$83,371
0
$0
1
$64,770
Aggregated Statistics For Year 2002 (Based on 1 full and 3 partial tracts)
A) FHA, FSA/RHS & VA Home Purchase Loans
B) Conventional Home Purchase Loans
C) Refinancings
D) Home Improvement Loans
F) Non-occupant Loans on < 5 Family Dwellings (A B C & D)
Number
Average Value
Number
Average Value
Number
Average Value
Number
Average Value
Number
Average Value
LOANS ORIGINATED
53
$80,873
111
$78,496
350
$73,667
36
$14,192
19
$54,898
APPLICATIONS APPROVED, NOT ACCEPTED
4
$82,828
11
$70,878
56
$68,564
2
$9,480
1
$42,990
APPLICATIONS DENIED
4
$84,302
27
$69,936
114
$64,805
13
$16,835
4
$44,952
APPLICATIONS WITHDRAWN
0
$0
11
$67,258
33
$75,070
2
$4,885
2
$57,055
FILES CLOSED FOR INCOMPLETENESS
0
$0
5
$59,650
44
$74,221
0
$0
1
$29,290
Aggregated Statistics For Year 2001 (Based on 1 full and 3 partial tracts)
A) FHA, FSA/RHS & VA Home Purchase Loans
B) Conventional Home Purchase Loans
C) Refinancings
D) Home Improvement Loans
E) Loans on Dwellings For 5+ Families
F) Non-occupant Loans on < 5 Family Dwellings (A B C & D)
Number
Average Value
Number
Average Value
Number
Average Value
Number
Average Value
Number
Average Value
Number
Average Value
LOANS ORIGINATED
57
$89,593
89
$74,932
308
$65,013
49
$13,586
2
$433,915
16
$53,346
APPLICATIONS APPROVED, NOT ACCEPTED
7
$81,371
20
$60,716
54
$59,729
7
$10,363
0
$0
2
$37,820
APPLICATIONS DENIED
6
$89,273
50
$40,603
156
$55,158
23
$12,767
0
$0
7
$51,923
APPLICATIONS WITHDRAWN
2
$77,295
11
$68,487
35
$60,725
2
$6,665
0
$0
2
$57,360
FILES CLOSED FOR INCOMPLETENESS
1
$73,330
1
$63,280
12
$59,324
1
$16,070
0
$0
0
$0
Aggregated Statistics For Year 2000 (Based on 1 full and 3 partial tracts)
A) FHA, FSA/RHS & VA Home Purchase Loans
B) Conventional Home Purchase Loans
C) Refinancings
D) Home Improvement Loans
F) Non-occupant Loans on < 5 Family Dwellings (A B C & D)
Number
Average Value
Number
Average Value
Number
Average Value
Number
Average Value
Number
Average Value
LOANS ORIGINATED
55
$74,158
111
$72,243
110
$49,691
29
$15,567
11
$34,392
APPLICATIONS APPROVED, NOT ACCEPTED
2
$101,635
13
$45,902
45
$57,498
8
$20,861
0
$0
APPLICATIONS DENIED
8
$94,685
50
$40,093
110
$50,215
28
$13,846
3
$81,317
APPLICATIONS WITHDRAWN
2
$70,180
7
$40,754
43
$58,918
2
$9,090
1
$23,840
FILES CLOSED FOR INCOMPLETENESS
0
$0
2
$79,375
6
$56,762
0
$0
0
$0
Aggregated Statistics For Year 1999 (Based on 1 full and 3 partial tracts)
A) FHA, FSA/RHS & VA Home Purchase Loans
B) Conventional Home Purchase Loans
C) Refinancings
D) Home Improvement Loans
F) Non-occupant Loans on < 5 Family Dwellings (A B C & D)
2002 - 2017 National Fire Incident Reporting System (NFIRS) incidents
According to the data from the years 2002 - 2017 the average number of fires per year is 60. The highest number of reported fires - 122 took place in 2012, and the least - 11 in 2002. The data has an increasing trend.
When looking into fire subcategories, the most reports belonged to: Structure Fires (74.5%), and Outside Fires (15.9%).
Fire incident types reported to NFIRS in New Haven, IN


 Recent articles from our blog. Our writers, many of them Ph.D. graduates or candidates, create easy-to-read articles on a wide variety of topics.

 (5.5 miles


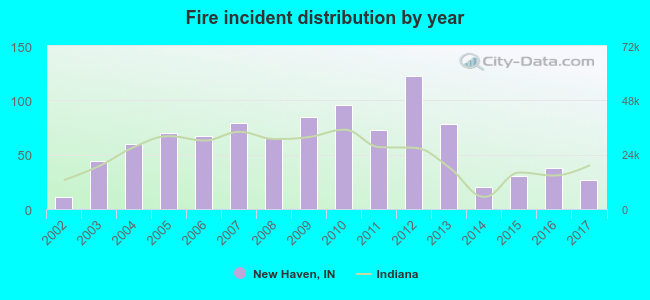 According to the data from the years 2002 - 2017 the average number of fires per year is 60. The highest number of reported fires - 122 took place in 2012, and the least - 11 in 2002. The data has an increasing trend.
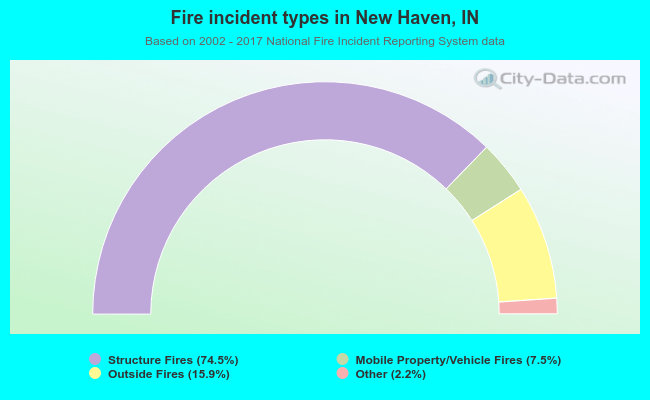 When looking into fire subcategories, the most reports belonged to: Structure Fires (74.5%), and Outside Fires (15.9%).