Moncks Corner, South Carolina Submit your own pictures of this town and show them to the world
OSM Map
General Map
Google Map
MSN Map
OSM Map
General Map
Google Map
MSN Map
OSM Map
General Map
Google Map
MSN Map
OSM Map
General Map
Google Map
MSN Map
Please wait while loading the map...
Population in 2022: 15,262 (88% urban, 12% rural). Population change since 2000: +156.4%Males: 7,273 Females: 7,989
March 2022 cost of living index in Moncks Corner: 91.2 (less than average, U.S. average is 100) Percentage of residents living in poverty in 2022: 8.1%for White Non-Hispanic residents , 8.1% for Black residents , 3.4% for Hispanic or Latino residents , 15.7% for American Indian residents , 25.0% for other race residents , 2.4% for two or more races residents )
Profiles of local businesses
Business Search - 14 Million verified businesses
Data:
Median household income ($)
Median household income (% change since 2000)
Household income diversity
Ratio of average income to average house value (%)
Ratio of average income to average rent
Median household income ($) - White
Median household income ($) - Black or African American
Median household income ($) - Asian
Median household income ($) - Hispanic or Latino
Median household income ($) - American Indian and Alaska Native
Median household income ($) - Multirace
Median household income ($) - Other Race
Median household income for houses/condos with a mortgage ($)
Median household income for apartments without a mortgage ($)
Races - White alone (%)
Races - White alone (% change since 2000)
Races - Black alone (%)
Races - Black alone (% change since 2000)
Races - American Indian alone (%)
Races - American Indian alone (% change since 2000)
Races - Asian alone (%)
Races - Asian alone (% change since 2000)
Races - Hispanic (%)
Races - Hispanic (% change since 2000)
Races - Native Hawaiian and Other Pacific Islander alone (%)
Races - Native Hawaiian and Other Pacific Islander alone (% change since 2000)
Races - Two or more races (%)
Races - Two or more races (% change since 2000)
Races - Other race alone (%)
Races - Other race alone (% change since 2000)
Racial diversity
Unemployment (%)
Unemployment (% change since 2000)
Unemployment (%) - White
Unemployment (%) - Black or African American
Unemployment (%) - Asian
Unemployment (%) - Hispanic or Latino
Unemployment (%) - American Indian and Alaska Native
Unemployment (%) - Multirace
Unemployment (%) - Other Race
Population density (people per square mile)
Population - Males (%)
Population - Females (%)
Population - Males (%) - White
Population - Males (%) - Black or African American
Population - Males (%) - Asian
Population - Males (%) - Hispanic or Latino
Population - Males (%) - American Indian and Alaska Native
Population - Males (%) - Multirace
Population - Males (%) - Other Race
Population - Females (%) - White
Population - Females (%) - Black or African American
Population - Females (%) - Asian
Population - Females (%) - Hispanic or Latino
Population - Females (%) - American Indian and Alaska Native
Population - Females (%) - Multirace
Population - Females (%) - Other Race
Coronavirus confirmed cases (Jun 04, 2024)
Deaths caused by coronavirus (Jun 04, 2024)
Coronavirus confirmed cases (per 100k population) (Jun 04, 2024)
Deaths caused by coronavirus (per 100k population) (Jun 04, 2024)
Daily increase in number of cases (Jun 04, 2024)
Weekly increase in number of cases (Jun 04, 2024)
Cases doubled (in days) (Jun 04, 2024)
Hospitalized patients (Apr 18, 2022)
Negative test results (Apr 18, 2022)
Total test results (Apr 18, 2022)
COVID Vaccine doses distributed (per 100k population) (Sep 19, 2023)
COVID Vaccine doses administered (per 100k population) (Sep 19, 2023)
COVID Vaccine doses distributed (Sep 19, 2023)
COVID Vaccine doses administered (Sep 19, 2023)
Likely homosexual households (%)
Likely homosexual households (% change since 2000)
Likely homosexual households - Lesbian couples (%)
Likely homosexual households - Lesbian couples (% change since 2000)
Likely homosexual households - Gay men (%)
Likely homosexual households - Gay men (% change since 2000)
Cost of living index
Median gross rent ($)
Median contract rent ($)
Median monthly housing costs ($)
Median house or condo value ($)
Median house or condo value ($ change since 2000)
Mean house or condo value by units in structure - 1, detached ($)
Mean house or condo value by units in structure - 1, attached ($)
Mean house or condo value by units in structure - 2 ($)
Mean house or condo value by units in structure by units in structure - 3 or 4 ($)
Mean house or condo value by units in structure - 5 or more ($)
Mean house or condo value by units in structure - Boat, RV, van, etc. ($)
Mean house or condo value by units in structure - Mobile home ($)
Median house or condo value ($) - White
Median house or condo value ($) - Black or African American
Median house or condo value ($) - Asian
Median house or condo value ($) - Hispanic or Latino
Median house or condo value ($) - American Indian and Alaska Native
Median house or condo value ($) - Multirace
Median house or condo value ($) - Other Race
Median resident age
Resident age diversity
Median resident age - Males
Median resident age - Females
Median resident age - White
Median resident age - Black or African American
Median resident age - Asian
Median resident age - Hispanic or Latino
Median resident age - American Indian and Alaska Native
Median resident age - Multirace
Median resident age - Other Race
Median resident age - Males - White
Median resident age - Males - Black or African American
Median resident age - Males - Asian
Median resident age - Males - Hispanic or Latino
Median resident age - Males - American Indian and Alaska Native
Median resident age - Males - Multirace
Median resident age - Males - Other Race
Median resident age - Females - White
Median resident age - Females - Black or African American
Median resident age - Females - Asian
Median resident age - Females - Hispanic or Latino
Median resident age - Females - American Indian and Alaska Native
Median resident age - Females - Multirace
Median resident age - Females - Other Race
Commute - mean travel time to work (minutes)
Travel time to work - Less than 5 minutes (%)
Travel time to work - Less than 5 minutes (% change since 2000)
Travel time to work - 5 to 9 minutes (%)
Travel time to work - 5 to 9 minutes (% change since 2000)
Travel time to work - 10 to 19 minutes (%)
Travel time to work - 10 to 19 minutes (% change since 2000)
Travel time to work - 20 to 29 minutes (%)
Travel time to work - 20 to 29 minutes (% change since 2000)
Travel time to work - 30 to 39 minutes (%)
Travel time to work - 30 to 39 minutes (% change since 2000)
Travel time to work - 40 to 59 minutes (%)
Travel time to work - 40 to 59 minutes (% change since 2000)
Travel time to work - 60 to 89 minutes (%)
Travel time to work - 60 to 89 minutes (% change since 2000)
Travel time to work - 90 or more minutes (%)
Travel time to work - 90 or more minutes (% change since 2000)
Marital status - Never married (%)
Marital status - Now married (%)
Marital status - Separated (%)
Marital status - Widowed (%)
Marital status - Divorced (%)
Median family income ($)
Median family income (% change since 2000)
Median non-family income ($)
Median non-family income (% change since 2000)
Median per capita income ($)
Median per capita income (% change since 2000)
Median family income ($) - White
Median family income ($) - Black or African American
Median family income ($) - Asian
Median family income ($) - Hispanic or Latino
Median family income ($) - American Indian and Alaska Native
Median family income ($) - Multirace
Median family income ($) - Other Race
Median year house/condo built
Median year apartment built
Year house built - Built 2005 or later (%)
Year house built - Built 2000 to 2004 (%)
Year house built - Built 1990 to 1999 (%)
Year house built - Built 1980 to 1989 (%)
Year house built - Built 1970 to 1979 (%)
Year house built - Built 1960 to 1969 (%)
Year house built - Built 1950 to 1959 (%)
Year house built - Built 1940 to 1949 (%)
Year house built - Built 1939 or earlier (%)
Average household size
Household density (households per square mile)
Average household size - White
Average household size - Black or African American
Average household size - Asian
Average household size - Hispanic or Latino
Average household size - American Indian and Alaska Native
Average household size - Multirace
Average household size - Other Race
Occupied housing units (%)
Vacant housing units (%)
Owner occupied housing units (%)
Renter occupied housing units (%)
Vacancy status - For rent (%)
Vacancy status - For sale only (%)
Vacancy status - Rented or sold, not occupied (%)
Vacancy status - For seasonal, recreational, or occasional use (%)
Vacancy status - For migrant workers (%)
Vacancy status - Other vacant (%)
Residents with income below the poverty level (%)
Residents with income below 50% of the poverty level (%)
Children below poverty level (%)
Poor families by family type - Married-couple family (%)
Poor families by family type - Male, no wife present (%)
Poor families by family type - Female, no husband present (%)
Poverty status for native-born residents (%)
Poverty status for foreign-born residents (%)
Poverty among high school graduates not in families (%)
Poverty among people who did not graduate high school not in families (%)
Residents with income below the poverty level (%) - White
Residents with income below the poverty level (%) - Black or African American
Residents with income below the poverty level (%) - Asian
Residents with income below the poverty level (%) - Hispanic or Latino
Residents with income below the poverty level (%) - American Indian and Alaska Native
Residents with income below the poverty level (%) - Multirace
Residents with income below the poverty level (%) - Other Race
Air pollution - Air Quality Index (AQI)
Air pollution - CO
Air pollution - NO2
Air pollution - SO2
Air pollution - Ozone
Air pollution - PM10
Air pollution - PM25
Air pollution - Pb
Crime - Murders per 100,000 population
Crime - Rapes per 100,000 population
Crime - Robberies per 100,000 population
Crime - Assaults per 100,000 population
Crime - Burglaries per 100,000 population
Crime - Thefts per 100,000 population
Crime - Auto thefts per 100,000 population
Crime - Arson per 100,000 population
Crime - City-data.com crime index
Crime - Violent crime index
Crime - Property crime index
Crime - Murders per 100,000 population (5 year average)
Crime - Rapes per 100,000 population (5 year average)
Crime - Robberies per 100,000 population (5 year average)
Crime - Assaults per 100,000 population (5 year average)
Crime - Burglaries per 100,000 population (5 year average)
Crime - Thefts per 100,000 population (5 year average)
Crime - Auto thefts per 100,000 population (5 year average)
Crime - Arson per 100,000 population (5 year average)
Crime - City-data.com crime index (5 year average)
Crime - Violent crime index (5 year average)
Crime - Property crime index (5 year average)
1996 Presidential Elections Results (%) - Democratic Party (Clinton)
1996 Presidential Elections Results (%) - Republican Party (Dole)
1996 Presidential Elections Results (%) - Other
2000 Presidential Elections Results (%) - Democratic Party (Gore)
2000 Presidential Elections Results (%) - Republican Party (Bush)
2000 Presidential Elections Results (%) - Other
2004 Presidential Elections Results (%) - Democratic Party (Kerry)
2004 Presidential Elections Results (%) - Republican Party (Bush)
2004 Presidential Elections Results (%) - Other
2008 Presidential Elections Results (%) - Democratic Party (Obama)
2008 Presidential Elections Results (%) - Republican Party (McCain)
2008 Presidential Elections Results (%) - Other
2012 Presidential Elections Results (%) - Democratic Party (Obama)
2012 Presidential Elections Results (%) - Republican Party (Romney)
2012 Presidential Elections Results (%) - Other
2016 Presidential Elections Results (%) - Democratic Party (Clinton)
2016 Presidential Elections Results (%) - Republican Party (Trump)
2016 Presidential Elections Results (%) - Other
2020 Presidential Elections Results (%) - Democratic Party (Biden)
2020 Presidential Elections Results (%) - Republican Party (Trump)
2020 Presidential Elections Results (%) - Other
Ancestries Reported - Arab (%)
Ancestries Reported - Czech (%)
Ancestries Reported - Danish (%)
Ancestries Reported - Dutch (%)
Ancestries Reported - English (%)
Ancestries Reported - French (%)
Ancestries Reported - French Canadian (%)
Ancestries Reported - German (%)
Ancestries Reported - Greek (%)
Ancestries Reported - Hungarian (%)
Ancestries Reported - Irish (%)
Ancestries Reported - Italian (%)
Ancestries Reported - Lithuanian (%)
Ancestries Reported - Norwegian (%)
Ancestries Reported - Polish (%)
Ancestries Reported - Portuguese (%)
Ancestries Reported - Russian (%)
Ancestries Reported - Scotch-Irish (%)
Ancestries Reported - Scottish (%)
Ancestries Reported - Slovak (%)
Ancestries Reported - Subsaharan African (%)
Ancestries Reported - Swedish (%)
Ancestries Reported - Swiss (%)
Ancestries Reported - Ukrainian (%)
Ancestries Reported - United States (%)
Ancestries Reported - Welsh (%)
Ancestries Reported - West Indian (%)
Ancestries Reported - Other (%)
Educational Attainment - No schooling completed (%)
Educational Attainment - Less than high school (%)
Educational Attainment - High school or equivalent (%)
Educational Attainment - Less than 1 year of college (%)
Educational Attainment - 1 or more years of college (%)
Educational Attainment - Associate degree (%)
Educational Attainment - Bachelor's degree (%)
Educational Attainment - Master's degree (%)
Educational Attainment - Professional school degree (%)
Educational Attainment - Doctorate degree (%)
School Enrollment - Nursery, preschool (%)
School Enrollment - Kindergarten (%)
School Enrollment - Grade 1 to 4 (%)
School Enrollment - Grade 5 to 8 (%)
School Enrollment - Grade 9 to 12 (%)
School Enrollment - College undergrad (%)
School Enrollment - Graduate or professional (%)
School Enrollment - Not enrolled in school (%)
School enrollment - Public schools (%)
School enrollment - Private schools (%)
School enrollment - Not enrolled (%)
Median number of rooms in houses and condos
Median number of rooms in apartments
Housing units lacking complete plumbing facilities (%)
Housing units lacking complete kitchen facilities (%)
Density of houses
Urban houses (%)
Rural houses (%)
Households with people 60 years and over (%)
Households with people 65 years and over (%)
Households with people 75 years and over (%)
Households with one or more nonrelatives (%)
Households with no nonrelatives (%)
Population in households (%)
Family households (%)
Nonfamily households (%)
Population in families (%)
Family households with own children (%)
Median number of bedrooms in owner occupied houses
Mean number of bedrooms in owner occupied houses
Median number of bedrooms in renter occupied houses
Mean number of bedrooms in renter occupied houses
Median number of vehichles in owner occupied houses
Mean number of vehichles in owner occupied houses
Median number of vehichles in renter occupied houses
Mean number of vehichles in renter occupied houses
Mortgage status - with mortgage (%)
Mortgage status - with second mortgage (%)
Mortgage status - with home equity loan (%)
Mortgage status - with both second mortgage and home equity loan (%)
Mortgage status - without a mortgage (%)
Average family size
Average family size - White
Average family size - Black or African American
Average family size - Asian
Average family size - Hispanic or Latino
Average family size - American Indian and Alaska Native
Average family size - Multirace
Average family size - Other Race
Geographical mobility - Same house 1 year ago (%)
Geographical mobility - Moved within same county (%)
Geographical mobility - Moved from different county within same state (%)
Geographical mobility - Moved from different state (%)
Geographical mobility - Moved from abroad (%)
Place of birth - Born in state of residence (%)
Place of birth - Born in other state (%)
Place of birth - Native, outside of US (%)
Place of birth - Foreign born (%)
Housing units in structures - 1, detached (%)
Housing units in structures - 1, attached (%)
Housing units in structures - 2 (%)
Housing units in structures - 3 or 4 (%)
Housing units in structures - 5 to 9 (%)
Housing units in structures - 10 to 19 (%)
Housing units in structures - 20 to 49 (%)
Housing units in structures - 50 or more (%)
Housing units in structures - Mobile home (%)
Housing units in structures - Boat, RV, van, etc. (%)
House/condo owner moved in on average (years ago)
Renter moved in on average (years ago)
Year householder moved into unit - Moved in 1999 to March 2000 (%)
Year householder moved into unit - Moved in 1995 to 1998 (%)
Year householder moved into unit - Moved in 1990 to 1994 (%)
Year householder moved into unit - Moved in 1980 to 1989 (%)
Year householder moved into unit - Moved in 1970 to 1979 (%)
Year householder moved into unit - Moved in 1969 or earlier (%)
Means of transportation to work - Drove car alone (%)
Means of transportation to work - Carpooled (%)
Means of transportation to work - Public transportation (%)
Means of transportation to work - Bus or trolley bus (%)
Means of transportation to work - Streetcar or trolley car (%)
Means of transportation to work - Subway or elevated (%)
Means of transportation to work - Railroad (%)
Means of transportation to work - Ferryboat (%)
Means of transportation to work - Taxicab (%)
Means of transportation to work - Motorcycle (%)
Means of transportation to work - Bicycle (%)
Means of transportation to work - Walked (%)
Means of transportation to work - Other means (%)
Working at home (%)
Industry diversity
Most Common Industries - Agriculture, forestry, fishing and hunting, and mining (%)
Most Common Industries - Agriculture, forestry, fishing and hunting (%)
Most Common Industries - Mining, quarrying, and oil and gas extraction (%)
Most Common Industries - Construction (%)
Most Common Industries - Manufacturing (%)
Most Common Industries - Wholesale trade (%)
Most Common Industries - Retail trade (%)
Most Common Industries - Transportation and warehousing, and utilities (%)
Most Common Industries - Transportation and warehousing (%)
Most Common Industries - Utilities (%)
Most Common Industries - Information (%)
Most Common Industries - Finance and insurance, and real estate and rental and leasing (%)
Most Common Industries - Finance and insurance (%)
Most Common Industries - Real estate and rental and leasing (%)
Most Common Industries - Professional, scientific, and management, and administrative and waste management services (%)
Most Common Industries - Professional, scientific, and technical services (%)
Most Common Industries - Management of companies and enterprises (%)
Most Common Industries - Administrative and support and waste management services (%)
Most Common Industries - Educational services, and health care and social assistance (%)
Most Common Industries - Educational services (%)
Most Common Industries - Health care and social assistance (%)
Most Common Industries - Arts, entertainment, and recreation, and accommodation and food services (%)
Most Common Industries - Arts, entertainment, and recreation (%)
Most Common Industries - Accommodation and food services (%)
Most Common Industries - Other services, except public administration (%)
Most Common Industries - Public administration (%)
Occupation diversity
Most Common Occupations - Management, business, science, and arts occupations (%)
Most Common Occupations - Management, business, and financial occupations (%)
Most Common Occupations - Management occupations (%)
Most Common Occupations - Business and financial operations occupations (%)
Most Common Occupations - Computer, engineering, and science occupations (%)
Most Common Occupations - Computer and mathematical occupations (%)
Most Common Occupations - Architecture and engineering occupations (%)
Most Common Occupations - Life, physical, and social science occupations (%)
Most Common Occupations - Education, legal, community service, arts, and media occupations (%)
Most Common Occupations - Community and social service occupations (%)
Most Common Occupations - Legal occupations (%)
Most Common Occupations - Education, training, and library occupations (%)
Most Common Occupations - Arts, design, entertainment, sports, and media occupations (%)
Most Common Occupations - Healthcare practitioners and technical occupations (%)
Most Common Occupations - Health diagnosing and treating practitioners and other technical occupations (%)
Most Common Occupations - Health technologists and technicians (%)
Most Common Occupations - Service occupations (%)
Most Common Occupations - Healthcare support occupations (%)
Most Common Occupations - Protective service occupations (%)
Most Common Occupations - Fire fighting and prevention, and other protective service workers including supervisors (%)
Most Common Occupations - Law enforcement workers including supervisors (%)
Most Common Occupations - Food preparation and serving related occupations (%)
Most Common Occupations - Building and grounds cleaning and maintenance occupations (%)
Most Common Occupations - Personal care and service occupations (%)
Most Common Occupations - Sales and office occupations (%)
Most Common Occupations - Sales and related occupations (%)
Most Common Occupations - Office and administrative support occupations (%)
Most Common Occupations - Natural resources, construction, and maintenance occupations (%)
Most Common Occupations - Farming, fishing, and forestry occupations (%)
Most Common Occupations - Construction and extraction occupations (%)
Most Common Occupations - Installation, maintenance, and repair occupations (%)
Most Common Occupations - Production, transportation, and material moving occupations (%)
Most Common Occupations - Production occupations (%)
Most Common Occupations - Transportation occupations (%)
Most Common Occupations - Material moving occupations (%)
People in Group quarters - Institutionalized population (%)
People in Group quarters - Correctional institutions (%)
People in Group quarters - Federal prisons and detention centers (%)
People in Group quarters - Halfway houses (%)
People in Group quarters - Local jails and other confinement facilities (including police lockups) (%)
People in Group quarters - Military disciplinary barracks (%)
People in Group quarters - State prisons (%)
People in Group quarters - Other types of correctional institutions (%)
People in Group quarters - Nursing homes (%)
People in Group quarters - Hospitals/wards, hospices, and schools for the handicapped (%)
People in Group quarters - Hospitals/wards and hospices for chronically ill (%)
People in Group quarters - Hospices or homes for chronically ill (%)
People in Group quarters - Military hospitals or wards for chronically ill (%)
People in Group quarters - Other hospitals or wards for chronically ill (%)
People in Group quarters - Hospitals or wards for drug/alcohol abuse (%)
People in Group quarters - Mental (Psychiatric) hospitals or wards (%)
People in Group quarters - Schools, hospitals, or wards for the mentally retarded (%)
People in Group quarters - Schools, hospitals, or wards for the physically handicapped (%)
People in Group quarters - Institutions for the deaf (%)
People in Group quarters - Institutions for the blind (%)
People in Group quarters - Orthopedic wards and institutions for the physically handicapped (%)
People in Group quarters - Wards in general hospitals for patients who have no usual home elsewhere (%)
People in Group quarters - Wards in military hospitals for patients who have no usual home elsewhere (%)
People in Group quarters - Juvenile institutions (%)
People in Group quarters - Long-term care (%)
People in Group quarters - Homes for abused, dependent, and neglected children (%)
People in Group quarters - Residential treatment centers for emotionally disturbed children (%)
People in Group quarters - Training schools for juvenile delinquents (%)
People in Group quarters - Short-term care, detention or diagnostic centers for delinquent children (%)
People in Group quarters - Type of juvenile institution unknown (%)
People in Group quarters - Noninstitutionalized population (%)
People in Group quarters - College dormitories (includes college quarters off campus) (%)
People in Group quarters - Military quarters (%)
People in Group quarters - On base (%)
People in Group quarters - Barracks, unaccompanied personnel housing (UPH), (Enlisted/Officer), ;and similar group living quarters for military personnel (%)
People in Group quarters - Transient quarters for temporary residents (%)
People in Group quarters - Military ships (%)
People in Group quarters - Group homes (%)
People in Group quarters - Homes or halfway houses for drug/alcohol abuse (%)
People in Group quarters - Homes for the mentally ill (%)
People in Group quarters - Homes for the mentally retarded (%)
People in Group quarters - Homes for the physically handicapped (%)
People in Group quarters - Other group homes (%)
People in Group quarters - Religious group quarters (%)
People in Group quarters - Dormitories (%)
People in Group quarters - Agriculture workers' dormitories on farms (%)
People in Group quarters - Job Corps and vocational training facilities (%)
People in Group quarters - Other workers' dormitories (%)
People in Group quarters - Crews of maritime vessels (%)
People in Group quarters - Other nonhousehold living situations (%)
People in Group quarters - Other noninstitutional group quarters (%)
Residents speaking English at home (%)
Residents speaking English at home - Born in the United States (%)
Residents speaking English at home - Native, born elsewhere (%)
Residents speaking English at home - Foreign born (%)
Residents speaking Spanish at home (%)
Residents speaking Spanish at home - Born in the United States (%)
Residents speaking Spanish at home - Native, born elsewhere (%)
Residents speaking Spanish at home - Foreign born (%)
Residents speaking other language at home (%)
Residents speaking other language at home - Born in the United States (%)
Residents speaking other language at home - Native, born elsewhere (%)
Residents speaking other language at home - Foreign born (%)
Class of Workers - Employee of private company (%)
Class of Workers - Self-employed in own incorporated business (%)
Class of Workers - Private not-for-profit wage and salary workers (%)
Class of Workers - Local government workers (%)
Class of Workers - State government workers (%)
Class of Workers - Federal government workers (%)
Class of Workers - Self-employed workers in own not incorporated business and Unpaid family workers (%)
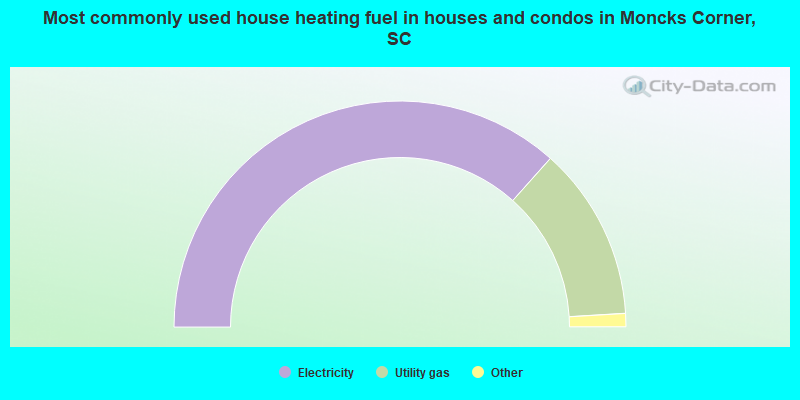
House heating fuel used in houses and condos - Utility gas (%)
House heating fuel used in houses and condos - Bottled, tank, or LP gas (%)
House heating fuel used in houses and condos - Electricity (%)
House heating fuel used in houses and condos - Fuel oil, kerosene, etc. (%)
House heating fuel used in houses and condos - Coal or coke (%)
House heating fuel used in houses and condos - Wood (%)
House heating fuel used in houses and condos - Solar energy (%)
House heating fuel used in houses and condos - Other fuel (%)
House heating fuel used in houses and condos - No fuel used (%)
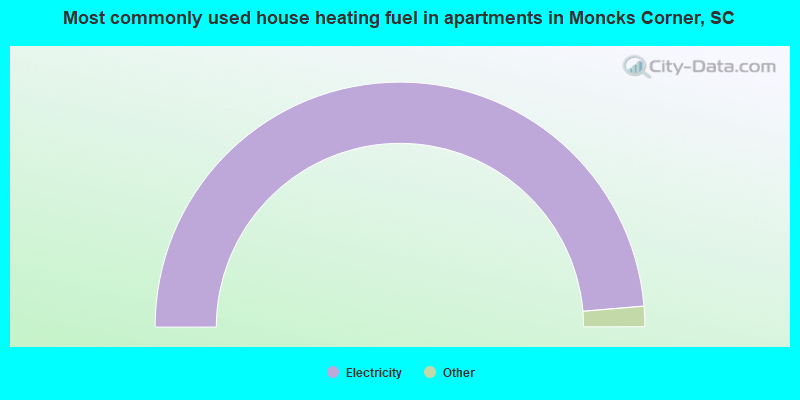
House heating fuel used in apartments - Utility gas (%)
House heating fuel used in apartments - Bottled, tank, or LP gas (%)
House heating fuel used in apartments - Electricity (%)
House heating fuel used in apartments - Fuel oil, kerosene, etc. (%)
House heating fuel used in apartments - Coal or coke (%)
House heating fuel used in apartments - Wood (%)
House heating fuel used in apartments - Solar energy (%)
House heating fuel used in apartments - Other fuel (%)
House heating fuel used in apartments - No fuel used (%)
Armed forces status - In Armed Forces (%)
Armed forces status - Civilian (%)
Armed forces status - Civilian - Veteran (%)
Armed forces status - Civilian - Nonveteran (%)
Fatal accidents locations in years 2005-2021
Fatal accidents locations in 2005
Fatal accidents locations in 2006
Fatal accidents locations in 2007
Fatal accidents locations in 2008
Fatal accidents locations in 2009
Fatal accidents locations in 2010
Fatal accidents locations in 2011
Fatal accidents locations in 2012
Fatal accidents locations in 2013
Fatal accidents locations in 2014
Fatal accidents locations in 2015
Fatal accidents locations in 2016
Fatal accidents locations in 2017
Fatal accidents locations in 2018
Fatal accidents locations in 2019
Fatal accidents locations in 2020
Fatal accidents locations in 2021
Alcohol use - People drinking some alcohol every month (%)
Alcohol use - People not drinking at all (%)
Alcohol use - Average days/month drinking alcohol
Alcohol use - Average drinks/week
Alcohol use - Average days/year people drink much
Audiometry - Average condition of hearing (%)
Audiometry - People that can hear a whisper from across a quiet room (%)
Audiometry - People that can hear normal voice from across a quiet room (%)
Audiometry - Ears ringing, roaring, buzzing (%)
Audiometry - Had a job exposure to loud noise (%)
Audiometry - Had off-work exposure to loud noise (%)
Blood Pressure & Cholesterol - Has high blood pressure (%)
Blood Pressure & Cholesterol - Checking blood pressure at home (%)
Blood Pressure & Cholesterol - Frequently checking blood cholesterol (%)
Blood Pressure & Cholesterol - Has high cholesterol level (%)
Consumer Behavior - Money monthly spent on food at supermarket/grocery store
Consumer Behavior - Money monthly spent on food at other stores
Consumer Behavior - Money monthly spent on eating out
Consumer Behavior - Money monthly spent on carryout/delivered foods
Consumer Behavior - Income spent on food at supermarket/grocery store (%)
Consumer Behavior - Income spent on food at other stores (%)
Consumer Behavior - Income spent on eating out (%)
Consumer Behavior - Income spent on carryout/delivered foods (%)
Current Health Status - General health condition (%)
Current Health Status - Blood donors (%)
Current Health Status - Has blood ever tested for HIV virus (%)
Current Health Status - Left-handed people (%)
Dermatology - People using sunscreen (%)
Diabetes - Diabetics (%)
Diabetes - Had a blood test for high blood sugar (%)
Diabetes - People taking insulin (%)
Diet Behavior & Nutrition - Diet health (%)
Diet Behavior & Nutrition - Milk product consumption (# of products/month)
Diet Behavior & Nutrition - Meals not home prepared (#/week)
Diet Behavior & Nutrition - Meals from fast food or pizza place (#/week)
Diet Behavior & Nutrition - Ready-to-eat foods (#/month)
Diet Behavior & Nutrition - Frozen meals/pizza (#/month)
Drug Use - People that ever used marijuana or hashish (%)
Drug Use - Ever used hard drugs (%)
Drug Use - Ever used any form of cocaine (%)
Drug Use - Ever used heroin (%)
Drug Use - Ever used methamphetamine (%)
Health Insurance - People covered by health insurance (%)
Kidney Conditions-Urology - Avg. # of times urinating at night
Medical Conditions - People with asthma (%)
Medical Conditions - People with anemia (%)
Medical Conditions - People with psoriasis (%)
Medical Conditions - People with overweight (%)
Medical Conditions - Elderly people having difficulties in thinking or remembering (%)
Medical Conditions - People who ever received blood transfusion (%)
Medical Conditions - People having trouble seeing even with glass/contacts (%)
Medical Conditions - People with arthritis (%)
Medical Conditions - People with gout (%)
Medical Conditions - People with congestive heart failure (%)
Medical Conditions - People with coronary heart disease (%)
Medical Conditions - People with angina pectoris (%)
Medical Conditions - People who ever had heart attack (%)
Medical Conditions - People who ever had stroke (%)
Medical Conditions - People with emphysema (%)
Medical Conditions - People with thyroid problem (%)
Medical Conditions - People with chronic bronchitis (%)
Medical Conditions - People with any liver condition (%)
Medical Conditions - People who ever had cancer or malignancy (%)
Mental Health - People who have little interest in doing things (%)
Mental Health - People feeling down, depressed, or hopeless (%)
Mental Health - People who have trouble sleeping or sleeping too much (%)
Mental Health - People feeling tired or having little energy (%)
Mental Health - People with poor appetite or overeating (%)
Mental Health - People feeling bad about themself (%)
Mental Health - People who have trouble concentrating on things (%)
Mental Health - People moving or speaking slowly or too fast (%)
Mental Health - People having thoughts they would be better off dead (%)
Oral Health - Average years since last visit a dentist
Oral Health - People embarrassed because of mouth (%)
Oral Health - People with gum disease (%)
Oral Health - General health of teeth and gums (%)
Oral Health - Average days a week using dental floss/device
Oral Health - Average days a week using mouthwash for dental problem
Oral Health - Average number of teeth
Pesticide Use - Households using pesticides to control insects (%)
Pesticide Use - Households using pesticides to kill weeds (%)
Physical Activity - People doing vigorous-intensity work activities (%)
Physical Activity - People doing moderate-intensity work activities (%)
Physical Activity - People walking or bicycling (%)
Physical Activity - People doing vigorous-intensity recreational activities (%)
Physical Activity - People doing moderate-intensity recreational activities (%)
Physical Activity - Average hours a day doing sedentary activities
Physical Activity - Average hours a day watching TV or videos
Physical Activity - Average hours a day using computer
Physical Functioning - People having limitations keeping them from working (%)
Physical Functioning - People limited in amount of work they can do (%)
Physical Functioning - People that need special equipment to walk (%)
Physical Functioning - People experiencing confusion/memory problems (%)
Physical Functioning - People requiring special healthcare equipment (%)
Prescription Medications - Average number of prescription medicines taking
Preventive Aspirin Use - Adults 40+ taking low-dose aspirin (%)
Reproductive Health - Vaginal deliveries (%)
Reproductive Health - Cesarean deliveries (%)
Reproductive Health - Deliveries resulted in a live birth (%)
Reproductive Health - Pregnancies resulted in a delivery (%)
Reproductive Health - Women breastfeeding newborns (%)
Reproductive Health - Women that had a hysterectomy (%)
Reproductive Health - Women that had both ovaries removed (%)
Reproductive Health - Women that have ever taken birth control pills (%)
Reproductive Health - Women taking birth control pills (%)
Reproductive Health - Women that have ever used Depo-Provera or injectables (%)
Reproductive Health - Women that have ever used female hormones (%)
Sexual Behavior - People 18+ that ever had sex (vaginal, anal, or oral) (%)
Sexual Behavior - Males 18+ that ever had vaginal sex with a woman (%)
Sexual Behavior - Males 18+ that ever performed oral sex on a woman (%)
Sexual Behavior - Males 18+ that ever had anal sex with a woman (%)
Sexual Behavior - Males 18+ that ever had any sex with a man (%)
Sexual Behavior - Females 18+ that ever had vaginal sex with a man (%)
Sexual Behavior - Females 18+ that ever performed oral sex on a man (%)
Sexual Behavior - Females 18+ that ever had anal sex with a man (%)
Sexual Behavior - Females 18+ that ever had any kind of sex with a woman (%)
Sexual Behavior - Average age people first had sex
Sexual Behavior - Average number of female sex partners in lifetime (males 18+)
Sexual Behavior - Average number of female vaginal sex partners in lifetime (males 18+)
Sexual Behavior - Average age people first performed oral sex on a woman (18+)
Sexual Behavior - Average number of woman performed oral sex on in lifetime (18+)
Sexual Behavior - Average number of male sex partners in lifetime (males 18+)
Sexual Behavior - Average number of male anal sex partners in lifetime (males 18+)
Sexual Behavior - Average age people first performed oral sex on a man (18+)
Sexual Behavior - Average number of male oral sex partners in lifetime (18+)
Sexual Behavior - People using protection when performing oral sex (%)
Sexual Behavior - Average number of times people have vaginal or anal sex a year
Sexual Behavior - People having sex without condom (%)
Sexual Behavior - Average number of male sex partners in lifetime (females 18+)
Sexual Behavior - Average number of male vaginal sex partners in lifetime (females 18+)
Sexual Behavior - Average number of female sex partners in lifetime (females 18+)
Sexual Behavior - Circumcised males 18+ (%)
Sleep Disorders - Average hours sleeping at night
Sleep Disorders - People that has trouble sleeping (%)
Smoking-Cigarette Use - People smoking cigarettes (%)
Taste & Smell - People 40+ having problems with smell (%)
Taste & Smell - People 40+ having problems with taste (%)
Taste & Smell - People 40+ that ever had wisdom teeth removed (%)
Taste & Smell - People 40+ that ever had tonsils teeth removed (%)
Taste & Smell - People 40+ that ever had a loss of consciousness because of a head injury (%)
Taste & Smell - People 40+ that ever had a broken nose or other serious injury to face or skull (%)
Taste & Smell - People 40+ that ever had two or more sinus infections (%)
Weight - Average height (inches)
Weight - Average weight (pounds)
Weight - Average BMI
Weight - People that are obese (%)
Weight - People that ever were obese (%)
Weight - People trying to lose weight (%)
Officers per 1,000 residents here:
2.31South Carolina average:
2.34
Latest news from Moncks Corner, SC collected exclusively by city-data.com from local newspapers, TV, and radio stations
Ancestries: American (14.7%), English (7.8%), German (4.0%), Irish (3.8%), Scottish (1.7%), European (1.5%).
Current Local Time:
Incorporated on 12/15/1909
Land area: 4.46 square miles.
Population density: 3,418 people per square mile (average).
368 residents are foreign born (1.1% Latin America , 0.7% Africa , 0.5% Europe , 0.3% Asia ).
This town:
2.6%South Carolina:
5.3%
Median real estate property taxes paid for housing units with mortgages in 2022: $1,711 (0.5%)Median real estate property taxes paid for housing units with no mortgage in 2022: $1,694 (0.6%)
Nearest city with pop. 50,000+: North Charleston, SC
Nearest city with pop. 200,000+: Charlotte, NC
Nearest city with pop. 1,000,000+: Philadelphia, PA
Nearest cities:
Latitude: 33.20 N, Longitude: 80.01 W
Daytime population change due to commuting: +2,485 (+17.4%)Workers who live and work in this town: 2,485 (33.7%)
Moncks Corner tourist attractions:
Single-family new house construction building permits:
2022: 266 buildings , average cost: $356,6002021: 220 buildings , average cost: $340,2002020: 160 buildings , average cost: $348,9002019: 165 buildings , average cost: $326,2002018: 239 buildings , average cost: $324,3002017: 267 buildings , average cost: $321,1002016: 260 buildings , average cost: $336,4002015: 192 buildings , average cost: $290,5002014: 180 buildings , average cost: $259,2002013: 119 buildings , average cost: $256,3002012: 82 buildings , average cost: $242,6002011: 98 buildings , average cost: $221,6002010: 106 buildings , average cost: $216,8002009: 100 buildings , average cost: $220,9002008: 15 buildings , average cost: $130,4002007: 26 buildings , average cost: $110,2002006: 44 buildings , average cost: $107,3002005: 40 buildings , average cost: $120,0002004: 66 buildings , average cost: $90,6002003: 23 buildings , average cost: $127,6002002: 17 buildings , average cost: $128,8002001: 37 buildings , average cost: $91,7002000: 38 buildings , average cost: $97,6001999: 18 buildings , average cost: $105,5001998: 21 buildings , average cost: $80,6001997: 11 buildings , average cost: $97,000Unemployment in December 2023: Here:
2.7%South Carolina:
3.1%
Population change in the 1990s: +131 (+2.3%).
Most common occupations in Moncks Corner, SC (%)
Both Males Females
Building and grounds cleaning and maintenance occupations (6.1%)
Electrical equipment mechanics and other installation, maintenance, and repair workers, including supervisors (4.9%)
Other sales and related occupations, including supervisors (4.8%)
Other production occupations, including supervisors (4.7%)
Preschool, kindergarten, elementary, and middle school teachers (4.3%)
Other office and administrative support workers, including supervisors (4.0%)
Cashiers (3.7%)
Electrical equipment mechanics and other installation, maintenance, and repair workers, including supervisors (9.1%)
Building and grounds cleaning and maintenance occupations (7.1%)
Other sales and related occupations, including supervisors (6.7%)
Construction traders workers except carpenters, electricians, painters, plumbers, and construction laborers (6.3%)
Laborers and material movers, hand (5.0%)
Other production occupations, including supervisors (4.7%)
Metal workers and plastic workers (3.7%)
Preschool, kindergarten, elementary, and middle school teachers (7.1%)
Cashiers (6.8%)
Secretaries and administrative assistants (6.4%)
Other office and administrative support workers, including supervisors (6.1%)
Building and grounds cleaning and maintenance occupations (5.3%)
Other production occupations, including supervisors (4.7%)
Sales representatives, services, wholesale and manufacturing (4.2%)
Tornado activity:
Moncks Corner-area historical tornado activity is below South Carolina state average. It is 26% smaller than the overall U.S. average.
On 9/11/1960, a category F3 (max. wind speeds 158-206 mph) tornado 27.5 miles away from the Moncks Corner town center injured 10 people and caused between $500,000 and $5,000,000 in damages.
On 9/3/1998, a category F2 (max. wind speeds 113-157 mph) tornado 1.2 miles away from the town center injured 9 people and caused $3 million in damages.
Earthquake activity:
Moncks Corner-area historical earthquake activity is significantly above South Carolina state average. It is 48% smaller than the overall U.S. average. On 11/22/1974 at 05:25:55, a magnitude 4.7 (4.7 MB, Class: Light, Intensity: IV - V) earthquake occurred 22.0 miles away from the city center On 8/21/1992 at 16:31:55, a magnitude 4.4 (4.1 MB, 4.1 LG, 4.4 LG, Depth: 6.2 mi) earthquake occurred 12.0 miles away from the city center On 8/2/1974 at 08:52:09, a magnitude 4.9 (4.3 MB, 4.9 LG) earthquake occurred 150.5 miles away from Moncks Corner center On 8/23/2011 at 17:51:04, a magnitude 5.8 (5.8 MW, Depth: 3.7 mi, Class: Moderate, Intensity: VI - VII) earthquake occurred 346.2 miles away from the city center On 8/9/2020 at 12:07:37, a magnitude 5.1 (5.1 MW, Depth: 4.7 mi) earthquake occurred 235.0 miles away from the city center On 4/17/1995 at 13:45:57, a magnitude 3.9 (3.9 LG, Depth: 6.2 mi, Class: Light, Intensity: II - III) earthquake occurred 17.6 miles away from Moncks Corner center Magnitude types: regional Lg-wave magnitude (LG), body-wave magnitude (MB), moment magnitude (MW) Natural disasters: The number of natural disasters in Berkeley County (18) is near the US average (15).Major Disasters (Presidential) Declared: 8Emergencies Declared: 5Hurricanes: 9, Storms: 3, Winter Storms: 3, Floods: 2, Tropical Storms: 2, Tornado: 1, Wind: 1, Other: 1 (Note: some incidents may be assigned to more than one category). Hospitals and medical centers in Moncks Corner: CONIFER I COMM. RES. (110 RESINWOOD DRIVE) CONIFER II (114 RESINWOOD DRIVE) BERKELEY CONVALESCENT CENTER ICF (505 S LIVE OAK DR)
UNIHEALTH POST ACUTE CARE OF MONCKS CORNER (505 SOUTH LIVE OAK DRIVE)
RAI CARE CENTERS MONCKS CORNER (112 MCCORMICK CIRCLE)
Airports located in Moncks Corner: Colleges/universities with over 2000 students nearest to Moncks Corner:
Charleston Southern University (about 16 miles; Charleston, SC ; Full-time enrollment: 3,012)
Trident Technical College (about 19 miles; Charleston, SC ; FT enrollment: 13,125)
Citadel Military College of South Carolina (about 28 miles; Charleston, SC ; FT enrollment: 3,683)
Medical University of South Carolina (about 29 miles; Charleston, SC ; FT enrollment: 2,138)
College of Charleston (about 29 miles; Charleston, SC ; FT enrollment: 10,974)
South Carolina State University (about 54 miles; Orangeburg, SC ; FT enrollment: 3,481)
Orangeburg Calhoun Technical College (about 54 miles; Orangeburg, SC ; FT enrollment: 2,113)
Public high schools in Moncks Corner:
Private high school in Moncks Corner: ST JOHN'S CHRISTIAN ACADEMY Students: 347, Location: 204 W MAIN ST, Grades: PK-12)
Public elementary/middle schools in Moncks Corner: BERKELEY MIDDLE Students: 1,135, Location: 320 NORTH LIVE OAK DRIVE, Grades: 6-8)HENRY E. BONNER ELEMENTARY Students: 805, Location: 171 MACEDONIA FOXES CIRCLE, Grades: PK-5)WHITESVILLE ELEMENTARY Students: 735, Location: 324 GAILLARD ROAD, Grades: PK-5)BERKELEY ELEMENTARY Students: 661, Location: 715 HIGHWAY 6, Grades: PK-2)BERKELEY INTERMEDIATE Students: 618, Location: 777 STONY LANDING ROAD, Grades: 3-5)MACEDONIA MIDDLE Students: 424, Location: 200 MACEDONIA FOXES CIRCLE, Grades: 6-8)See full list of schools located in Moncks Corner Library in Moncks Corner: BERKELEY COUNTY LIBRARY SYSTEM Operating income: $2,980,845; Location: 100 LIBRARY ST.; 228,335 books ; 5,064 audio materials ; 7,364 video materials ; 3 local licensed databases ; 35 state licensed databases ; 430 print serial subscriptions )
Notable locations in Moncks Corner: (A) , Stony Landing Plantation (B) , Berkeley County Courthouse (C) , Berkeley County Library (D) , Berkeley Manor (E) , South Carolina Department of Social Services (F) , Berkeley Museum (G) , Berkeley County Library Monks Corner Branch (H) , Moncks Corner Fire Department (I) , Berkeley County Rescue Squad (J) , Berkeley County Disaster Preparedness Office (K) , Berkeley County Sheriff's Department (L) , South Carolina Highway Patrol (M) , Moncks Corner Police Department (N) , Moncks Corner Town Hall (O) . Display/hide their locations on the map
Shopping Center: (1) . Display/hide its location on the map
Churches in Moncks Corner include: (A) , First Christian Church (B) , Moncks Corner United Methodist Church (C) , Grace Church (D) , Graham Church (E) . Display/hide their locations on the map
Cemetery: (1) . Display/hide its location on the map
Park in Moncks Corner: (1) . Display/hide its location on the map
Hotels:
Courts:
Birthplace of: Larry Grooms - Politician, Robin Kenyatta - Jazz alto saxophonist, Andre Ellington - Football player, J. J. McKelvey - Football player, Kedron Young - College basketball player (The Citadel Bulldogs), Ryan Stewart (American football) - Football player.
Berkeley County has a predicted average indoor radon screening level less than 2 pCi/L (pico curies per liter) - Low Potential Drinking water stations with addresses in Moncks Corner and their reported violations in the past:
BCWSA - EAST COOPER (0820009) (Address: ATTN: ACCOUNTS PAYABLE Population served: 10,942, Purch surface water):
Past monitoring violations:
Failure Submit IDSE/Subpart V Plan Rpt - In JUL-02-2010, Contaminant: DBP STAGE 2. Follow-up actions: St Compliance achieved (FEB-24-2011)
Address: ATTN: ACCOUNTS PAYABLE Population served: 583, Purch surface water):
Past health violations:
MCL, Monthly (TCR) - In OCT-2008, Contaminant: Coliform. Follow-up actions: St Compliance achieved (NOV-01-2008), St Violation/Reminder Notice (DEC-23-2008)
Population served: 71, Groundwater):
Past monitoring violations:
Follow-up Or Routine LCR Tap M/R - In OCT-01-2005, Contaminant: Lead and Copper Rule. Follow-up actions: St Violation/Reminder Notice (DEC-12-2007), St Compliance achieved (JAN-01-2009)
Population served: 41, Groundwater):
Past monitoring violations:
One routine major monitoring violation
Drinking water stations with addresses in Moncks Corner that have no violations reported:
BCWSA/SANGAREE W/D (0820002) (Address: ATTN: ACCOUNTS PAYABLE Population served: 40,196, Primary Water Source Type: Purch surface water)
MONCKS CORNER CITY OF (0810001) (Population served: 5,862, Primary Water Source Type: Purch surface water)
O HAYNES SYSTEM (0850014) (Population served: 205, Primary Water Source Type: Groundwater)
BCWSA/LAKE MOULTRIE ESTATES (0820004) (Address: ATTN: ACCOUNTS PAYABLE Population served: 154, Primary Water Source Type: Purch surface water)
MEPKIN ABBEY (0870972) (Population served: 30, Primary Water Source Type: Groundwater)
BUTLERS MHP (0860063) (Population served: 28, Primary Water Source Type: Groundwater)
WASSAMASSAW REC CENTER (0870945) (Population served: 26, Primary Water Source Type: Groundwater)
SANTEE COOPER REG WATER (0820008) (Population served: 25, Primary Water Source Type: Surface water)
LAKE MARION REGIONAL WATER PLT (3820003) (Population served: 25, Primary Water Source Type: Surface water)
Average household size: This town:
2.6 peopleSouth Carolina:
2.5 people
Percentage of family households: This town:
70.1%Whole state:
67.5%
Percentage of households with unmarried partners: This town:
6.4%Whole state:
6.0%
Likely homosexual households (counted as self-reported same-sex unmarried-partner households)
Lesbian couples: 0.4% of all households Gay men: 0.2% of all households
People in group quarters in Moncks Corner in 2010:
336 people in local jails and other municipal confinement facilities
126 people in nursing facilities/skilled-nursing facilities
12 people in residential treatment centers for adults
People in group quarters in Moncks Corner in 2000:
233 people in local jails and other confinement facilities (including police lockups)
202 people in nursing homes
18 people in homes for the mentally retarded
10 people in other group homes
Banks with branches in Moncks Corner (2011 data):
Farmers and Merchants Bank of South Carolina: Carnes Crossroads Branch at 3751 South Live Oak Drive, branch established on 2000/05/08; Moncks Corner Branch at 221 East Main Street, branch established on 1966/06/02. Info updated 2006/11/03: Bank assets: $303.7 mil, Deposits: $262.3 mil, headquarters in Holly Hill, SC, positive income , 8 total offices , Holding Company: Fmb Of S.C. Bancshares, Inc.
SouthCoast Community Bank: Moncks Corner Branch at 337 East Main Street, branch established on 2000/05/04. Info updated 2006/11/03: Bank assets: $425.3 mil, Deposits: $318.7 mil, headquarters in Mount Pleasant, SC, negative income in the last year , Commercial Lending Specialization, 12 total offices , Holding Company: Southcoast Financial Corporation
SCBT National Association: Moncks Corner Branch at 317 Highway 52, North, branch established on 1973/02/05. Info updated 2011/08/01: Bank assets: $3,893.8 mil, Deposits: $3,257.7 mil, headquarters in Orangeburg, SC, positive income , Commercial Lending Specialization, 79 total offices , Holding Company: Scbt Financial Corporation
Woodforest National Bank: Moncks Corner Branch at 511 North Highway 52, branch established on 2008/06/21. Info updated 2011/05/10: Bank assets: $3,488.9 mil, Deposits: $3,097.6 mil, headquarters in Houston, TX, positive income , Commercial Lending Specialization, 766 total offices , Holding Company: Woodforest Financial Group Employee Stock Ownership Plan (With 401(K) Provisions)
First Federal Savings and Loan Association of Charleston: 206 East Main Street Branch at 206 East Main Street, branch established on 1934/07/01. Info updated 2012/02/24: Bank assets: $3,140.4 mil, Deposits: $2,278.8 mil, headquarters in Charleston, SC, negative income in the last year , Mortgage Lending Specialization, 69 total offices
First Citizens Bank and Trust Company, Inc.: Moncks Corner Branch at 212 East Main Street, branch established on 1934/03/01. Info updated 2011/08/24: Bank assets: $8,104.0 mil, Deposits: $6,880.8 mil, headquarters in Columbia, SC, positive income , 197 total offices , Holding Company: First Citizens Bancorporation, Inc.
Wells Fargo Bank, National Association: Moncks Corner Branch at 237 East Main Street, branch established on 1949/07/18. Info updated 2011/04/05: Bank assets: $1,161,490.0 mil, Deposits: $905,653.0 mil, headquarters in Sioux Falls, SD, positive income , 6395 total offices , Holding Company: Wells Fargo & Company
For population 15 years and over in Moncks Corner:
Never married: 30.4%Now married: 53.5%Separated: 1.5%Widowed: 3.4%Divorced: 11.3% For population 25 years and over in Moncks Corner:
High school or higher: 91.6%Bachelor's degree or higher: 27.6%Graduate or professional degree: 10.0%Unemployed: 5.9%Mean travel time to work (commute): 31.9 minutes
Education Gini index (Inequality in education) Here:
9.8South Carolina average:
11.1
Religion statistics for Moncks Corner, SC (based on Berkeley County data)
Religion Adherents Congregations Evangelical Protestant 28,148 126 Mainline Protestant 10,346 51 Catholic 7,244 4 Black Protestant 6,388 37 Other 2,215 7 None 123,502 -
Source: Clifford Grammich, Kirk Hadaway, Richard Houseal, Dale E.Jones, Alexei Krindatch, Richie Stanley and Richard H.Taylor. 2012. 2010 U.S.Religion Census: Religious Congregations & Membership Study. Association of Statisticians of American Religious Bodies. Jones, Dale E., et al. 2002. Congregations and Membership in the United States 2000. Nashville, TN: Glenmary Research Center. Graphs represent county-level data
Food Environment Statistics: Number of grocery stores : 17Berkeley County :
1.04 / 10,000 pop.South Carolina :
1.99 / 10,000 pop.
Number of supercenters and club stores : 2This county :
0.12 / 10,000 pop.State :
0.15 / 10,000 pop.
Number of convenience stores (no gas) : 12Berkeley County :
0.73 / 10,000 pop.South Carolina :
0.85 / 10,000 pop.
Number of convenience stores (with gas) : 58Here :
3.55 / 10,000 pop.South Carolina :
5.38 / 10,000 pop.
Number of full-service restaurants : 69This county :
4.22 / 10,000 pop.South Carolina :
7.75 / 10,000 pop.
Adult diabetes rate : Berkeley County :
11.3%South Carolina :
10.6%
Adult obesity rate : Berkeley County :
33.5%State :
29.4%
Low-income preschool obesity rate : This county :
11.8%South Carolina :
13.4%
Health and Nutrition: Healthy diet rate : Moncks Corner:
49.7%South Carolina:
49.2%
Average overall health of teeth and gums : This city:
47.8%South Carolina:
46.2%
Average BMI : Here:
29.2South Carolina:
29.0
People feeling badly about themselves : Moncks Corner:
19.5%State:
20.4%
People not drinking alcohol at all : This city:
11.6%South Carolina:
11.0%
Average hours sleeping at night : Moncks Corner:
6.8South Carolina:
6.8
Overweight people : This city:
34.5%State:
34.4%
General health condition : Average condition of hearing : Moncks Corner:
81.2%State:
79.9%
More about Health and Nutrition of Moncks Corner, SC Residents
Local government employment and payroll (March 2022)
Function
Full-time employees
Monthly full-time payroll
Average yearly full-time wage
Part-time employees
Monthly part-time payroll
Police Protection - Officers
24 $108,568 $54,284 0 $0 Firefighters
23 $97,175 $50,700 2 $478 Streets and Highways
17 $55,591 $39,241 0 $0 Parks and Recreation
8 $57,280 $85,920 9 $2,904 Financial Administration
6 $32,290 $64,580 0 $0 Other and Unallocable
4 $17,130 $51,390 0 $0 Other Government Administration
3 $23,567 $94,268 0 $0 Police - Other
3 $9,551 $38,204 1 $756 Natural Resources
3 $10,023 $40,092 0 $0 Judicial and Legal
2 $6,905 $41,430 2 $7,093
Totals for Government
93 $418,079 $53,946 14 $11,231
Moncks Corner government finances - Expenditure in 2017 (per resident):
Construction - Parks and Recreation: $3,841,000 ($251.67)
Current Operations - Police Protection: $2,029,000 ($132.94)
Central Staff Services: $1,565,000 ($102.54)Local Fire Protection: $1,172,000 ($76.79)Public Welfare - Other: $970,000 ($63.56)Parks and Recreation: $448,000 ($29.35)General - Other: $56,000 ($3.67)Regular Highways: $11,000 ($0.72)General - Interest on Debt: $308,000 ($20.18)
Other Capital Outlay - General - Other: $523,000 ($34.27)
Total Salaries and Wages: $2,331,000 ($152.73)
Moncks Corner government finances - Revenue in 2017 (per resident):
Charges - Other: $702,000 ($46.00)
Miscellaneous - Fines and Forfeits: $520,000 ($34.07)
General Revenue - Other: $251,000 ($16.45)Special Assessments: $250,000 ($16.38)Sale of Property: $14,000 ($0.92)State Intergovernmental - General Local Government Support: $357,000 ($23.39)
Other: $88,000 ($5.77)Tax - Property: $3,608,000 ($236.40)
Public Utilities Sales: $2,582,000 ($169.18)
Moncks Corner government finances - Debt in 2017 (per resident):
Long Term Debt - Beginning Outstanding - Unspecified Public Purpose: $7,700,000 ($504.52)
Outstanding Unspecified Public Purpose: $7,517,000 ($492.53)Retired Unspecified Public Purpose: $183,000 ($11.99)
Moncks Corner government finances - Cash and Securities in 2017 (per resident):
Bond Funds - Cash and Securities: $2,746,000 ($179.92)
Other Funds - Cash and Securities: $5,394,000 ($353.43)
Sinking Funds - Cash and Securities: $80,000 ($5.24)
13.27% of this county's 2021 resident taxpayers lived in other counties in 2020 ($69,278 average adjusted gross income )
Here:
13.27%South Carolina average:
8.89%
0.09% of residents moved from foreign countries ($375 average AGI )Berkeley County:
0.09%South Carolina average:
0.04%
Top counties from which taxpayers relocated into this county between 2020 and 2021:
11.39% of this county's 2020 resident taxpayers moved to other counties in 2021 ($61,922 average adjusted gross income )
Here:
11.39%South Carolina average:
7.46%
0.12% of residents moved to foreign countries ($615 average AGI )Berkeley County:
0.12%South Carolina average:
0.03%
Top counties to which taxpayers relocated from this county between 2020 and 2021:
Businesses in Moncks Corner, SC
Name Count Name Count
Advance Auto Parts 1 La-Z-Boy 1 Applebee's 1 Little Caesars Pizza 1 Arby's 1 McDonald's 1 Blockbuster 1 Pizza Hut 1 Burger King 1 SAS Shoes 1 CVS 1 SONIC Drive-In 1 Chevrolet 1 Sears 1 Church's Chicken 2 Subway 4 Curves 1 T-Mobile 2 Domino's Pizza 1 Taco Bell 1 FedEx 4 True Value 1 Ford 1 U-Haul 2 GNC 1 UPS 1 GameStop 1 Verizon Wireless 1 H&R Block 1 Waffle House 1 Hardee's 1 Walgreens 1 Holiday Inn 1 Walmart 1 KFC 1 YMCA 1
Strongest AM radio stations in Moncks Corner:
WQTK (950 AM; 10 kW; MONCKS CORNER, SC; Owner: KIRKMAN BROADCASTING, INC.)
WIQB (1050 AM; 25 kW; CONWAY, SC; Owner: CUMULUS LICENSING CORP.)
WSCC (730 AM; 5 kW; CHARLESTON, SC; Owner: CITICASTERS LICENSES, L.P.)
WCEO (840 AM; daytime; 50 kW; COLUMBIA, SC; Owner: EASTERN BROADCASTING GROUP, INC.)
WBAJ (890 AM; daytime; 50 kW; BLYTHEWOOD, SC; Owner: FAMILY FIRST)
WTMA (1250 AM; 5 kW; CHARLESTON, SC; Owner: CITADEL BROADCASTING COMPANY)
WQIZ (810 AM; daytime; 5 kW; ST. GEORGE, SC; Owner: RADIO PROPERTIES, LLC)
WXTC (1390 AM; 5 kW; CHARLESTON, SC)
WAZS (980 AM; 1 kW; SUMMERVILLE, SC; Owner: THOMAS B. DANIELS)
WDKD (1310 AM; 5 kW; KINGSTREE, SC; Owner: MILLER COMMUNICATIONS, INC.)
WBT (1110 AM; 50 kW; CHARLOTTE, NC; Owner: JEFFERSON-PILOT COMMUNICATNS CO. OF NORTH CAROLINA)
WAGL (1560 AM; daytime; 50 kW; LANCASTER, SC; Owner: PALMETTO BROADCASTING SYSTEM, INC.)
WLFJ (660 AM; daytime; 50 kW; GREENVILLE, SC; Owner: CLEAR CHANNEL BROADCASTING LICENSES, INC.)
Strongest FM radio stations in Moncks Corner:
WCSQ (92.5 FM; MONCKS CORNER, SC; Owner: APEX BROADCASTING, INC.)
WSUY (96.9 FM; CHARLESTON, SC; Owner: CITADEL BROADCASTING COMPANY)
WAVF (96.1 FM; HANAHAN, SC; Owner: APEX BROADCASTING, INC.)
WSCI (89.3 FM; CHARLESTON, SC; Owner: SOUTH CAROLINA EDUCATIONAL TV COMMISSION)
WNKT (107.5 FM; ST. GEORGE, SC; Owner: CITADEL BROADCASTING COMPANY)
WSSP (94.3 FM; GOOSE CREEK, SC; Owner: CLEAR CHANNEL BROADCASTING LICENSES, INC.)
WEZL (103.5 FM; CHARLESTON, SC; Owner: CITICASTERS LICENSES, L.P.)
WSSX-FM (95.1 FM; CHARLESTON, SC; Owner: CITADEL BROADCASTING COMPANY)
WXLY (102.5 FM; NORTH CHARLESTON, SC; Owner: CITICASTERS LICENSES, L.P.)
WKCL (91.5 FM; LADSON, SC; Owner: CHAPEL HOLY SPIRIT CHURCH & BIBLE CO)
WYFH (90.7 FM; NORTH CHARLESTON, SC; Owner: BIBLE BROADCASTING NETWORK, INC.)
WWWZ (93.3 FM; SUMMERVILLE, SC; Owner: CITADEL BROADCASTING COMPANY)
WRFQ (104.5 FM; MOUNT PLEASANT, SC; Owner: CITICASTERS LICENSES, L.P.)
WWBZ (98.9 FM; MCCLELLANVILLE, SC; Owner: 98.9, INC.)
WJNI (106.3 FM; LADSON, SC; Owner: THOMAS B. DANIELS)
WTUA (106.1 FM; ST. STEPHEN, SC; Owner: JEREMIAH RAVENELL)
WPAL-FM (100.9 FM; RIDGEVILLE, SC; Owner: GRESHAM COMMUNICATIONS, INC.)
WMGL (101.7 FM; RAVENEL, SC; Owner: CITADEL BROADCASTING COMPANY)
WALC (100.5 FM; CHARLESTON, SC; Owner: CITICASTERS LICENSES, L.P.)
W205BJ (88.9 FM; CHARLESTON, SC; Owner: CALVARY CHAPEL OF TWIN FALLS, INC.)
TV broadcast stations around Moncks Corner:
WCSC-TV (Channel 5; CHARLESTON, SC; Owner: WCSC, INC.)
WITV (Channel 7; CHARLESTON, SC; Owner: SOUTH CAROLINA EDUCATIONAL TV COMMISSION)
WCBD-TV (Channel 2; CHARLESTON, SC; Owner: MEDIA GENERAL COMMUNICATIONS, INC.)
WCIV (Channel 4; CHARLESTON, SC; Owner: WCIV, LLC)
WMMP (Channel 36; CHARLESTON, SC; Owner: WMMP LICENSEE L.P.)
WTAT-TV (Channel 24; CHARLESTON, SC; Owner: WTAT LICENSEE, LLC)
W26CF (Channel 26; SUMMERVILLE, SC; Owner: DOVE BROADCASTING, INC.)
W21BX (Channel 21; CHARLESTON, SC; Owner: TRINITY BROADCASTING NETWORK)
WJRB-LP (Channel 18; CHARLESTON, SC; Owner: RAUL INFANTE, JR.)
WJNI-LP (Channel 57; NORTH CHARLESTON, SC; Owner: THOMAS B. DANIELS)
WTBD-LP (Channel 22; NORTH CHARLESTON, SC; Owner: THOMAS B. DANIELS)
WJEA-LP (Channel 12; CHARLESTON, SC; Owner: CHARLES S. NAMEY)
National Bridge Inventory (NBI) Statistics 27 Number of bridges249ft / 75.7m Total length $6,796,000 Total costs187,050 Total average daily traffic10,941 Total average daily truck traffic312,916 Total future (year 2040) average daily traffic
New bridges - historical statistics
3 1920-1929 1 1930-1939 2 1940-1949 6 1960-1969 7 1970-1979 1 1980-1989 3 1990-1999 2 2000-2009 1 2010-2019 1 2020-2022
See full National Bridge Inventory statistics for Moncks Corner, SC
Home Mortgage Disclosure Act Aggregated Statistics For Year 2009(Based on 1 partial tract) A) FHA, FSA/RHS & VA B) Conventional C) Refinancings D) Home Improvement Loans F) Non-occupant Loans on G) Loans On Manufactured Number Average Value Number Average Value Number Average Value Number Average Value Number Average Value Number Average Value
LOANS ORIGINATED 21 $152,518 6 $139,125 48 $166,404 6 $21,243 5 $133,756 2 $40,140 APPLICATIONS APPROVED, NOT ACCEPTED 1 $52,880 1 $37,700 6 $158,878 1 $68,610 0 $0 1 $40,140 APPLICATIONS DENIED 4 $129,498 6 $76,207 23 $164,571 1 $20,340 2 $85,430 4 $52,275 APPLICATIONS WITHDRAWN 2 $141,430 1 $133,430 14 $172,890 1 $26,040 1 $120,680 0 $0 FILES CLOSED FOR INCOMPLETENESS 0 $0 0 $0 2 $210,585 0 $0 0 $0 0 $0
Aggregated Statistics For Year 2008(Based on 1 partial tract) A) FHA, FSA/RHS & VA B) Conventional C) Refinancings D) Home Improvement Loans F) Non-occupant Loans on G) Loans On Manufactured Number Average Value Number Average Value Number Average Value Number Average Value Number Average Value Number Average Value
LOANS ORIGINATED 20 $155,588 14 $134,399 27 $159,375 6 $28,973 4 $54,985 2 $58,170 APPLICATIONS APPROVED, NOT ACCEPTED 0 $0 2 $103,870 2 $190,110 0 $0 1 $59,940 0 $0 APPLICATIONS DENIED 2 $146,855 7 $126,109 27 $151,872 5 $90,526 1 $113,090 3 $53,787 APPLICATIONS WITHDRAWN 4 $179,670 1 $144,820 8 $144,176 1 $144,280 1 $47,460 1 $43,390 FILES CLOSED FOR INCOMPLETENESS 1 $80,550 1 $103,600 2 $169,230 0 $0 0 $0 0 $0
Aggregated Statistics For Year 2007(Based on 1 partial tract) A) FHA, FSA/RHS & VA B) Conventional C) Refinancings D) Home Improvement Loans E) Loans on Dwellings For 5+ Families F) Non-occupant Loans on G) Loans On Manufactured Number Average Value Number Average Value Number Average Value Number Average Value Number Average Value Number Average Value Number Average Value
LOANS ORIGINATED 7 $187,787 33 $141,690 40 $129,891 8 $46,816 1 $268,490 11 $129,806 2 $50,985 APPLICATIONS APPROVED, NOT ACCEPTED 1 $91,670 2 $159,330 8 $115,022 1 $75,120 0 $0 1 $80,550 1 $82,990 APPLICATIONS DENIED 2 $176,145 8 $103,971 36 $128,481 8 $92,140 0 $0 3 $132,347 2 $50,310 APPLICATIONS WITHDRAWN 3 $189,207 8 $170,449 12 $133,543 2 $96,820 0 $0 1 $223,740 0 $0 FILES CLOSED FOR INCOMPLETENESS 0 $0 1 $232,420 5 $147,912 0 $0 0 $0 1 $62,650 0 $0
Aggregated Statistics For Year 2006(Based on 1 partial tract) A) FHA, FSA/RHS & VA B) Conventional C) Refinancings D) Home Improvement Loans F) Non-occupant Loans on G) Loans On Manufactured Number Average Value Number Average Value Number Average Value Number Average Value Number Average Value Number Average Value
LOANS ORIGINATED 4 $128,345 44 $120,943 38 $119,057 9 $48,454 9 $106,310 2 $54,105 APPLICATIONS APPROVED, NOT ACCEPTED 1 $139,400 7 $139,010 7 $138,119 1 $22,240 1 $289,910 1 $54,240 APPLICATIONS DENIED 2 $76,750 17 $86,449 27 $113,994 6 $78,197 4 $149,362 6 $59,845 APPLICATIONS WITHDRAWN 3 $193,727 11 $146,990 15 $126,253 1 $110,650 1 $130,720 1 $72,680 FILES CLOSED FOR INCOMPLETENESS 0 $0 1 $153,230 7 $169,616 0 $0 1 $54,780 0 $0
Aggregated Statistics For Year 2005(Based on 1 partial tract) A) FHA, FSA/RHS & VA B) Conventional C) Refinancings D) Home Improvement Loans E) Loans on Dwellings For 5+ Families F) Non-occupant Loans on G) Loans On Manufactured Number Average Value Number Average Value Number Average Value Number Average Value Number Average Value Number Average Value Number Average Value
LOANS ORIGINATED 12 $149,273 47 $110,205 46 $111,717 8 $51,189 1 $234,590 11 $113,657 4 $46,715 APPLICATIONS APPROVED, NOT ACCEPTED 1 $193,370 6 $91,440 11 $115,728 0 $0 0 $0 2 $110,785 1 $49,630 APPLICATIONS DENIED 1 $84,070 14 $101,274 31 $106,214 4 $37,560 0 $0 2 $102,105 8 $53,630 APPLICATIONS WITHDRAWN 0 $0 5 $105,388 20 $112,548 2 $87,055 0 $0 2 $95,190 2 $59,120 FILES CLOSED FOR INCOMPLETENESS 0 $0 2 $127,600 11 $113,386 0 $0 0 $0 0 $0 0 $0
Aggregated Statistics For Year 2004(Based on 1 partial tract) A) FHA, FSA/RHS & VA B) Conventional C) Refinancings D) Home Improvement Loans F) Non-occupant Loans on G) Loans On Manufactured Number Average Value Number Average Value Number Average Value Number Average Value Number Average Value Number Average Value
LOANS ORIGINATED 19 $139,225 39 $117,972 31 $118,409 7 $43,121 6 $84,117 2 $32,135 APPLICATIONS APPROVED, NOT ACCEPTED 1 $121,770 5 $96,818 7 $81,980 1 $97,900 1 $86,780 2 $53,560 APPLICATIONS DENIED 3 $94,920 11 $80,571 36 $89,925 7 $39,130 1 $117,430 9 $61,080 APPLICATIONS WITHDRAWN 0 $0 4 $121,770 14 $104,451 2 $66,310 0 $0 0 $0 FILES CLOSED FOR INCOMPLETENESS 0 $0 0 $0 5 $101,916 0 $0 0 $0 0 $0
Aggregated Statistics For Year 2003(Based on 1 partial tract) A) FHA, FSA/RHS & VA B) Conventional C) Refinancings D) Home Improvement Loans F) Non-occupant Loans on Number Average Value Number Average Value Number Average Value Number Average Value Number Average Value
LOANS ORIGINATED 10 $109,646 17 $131,500 63 $108,910 7 $9,491 6 $71,325 APPLICATIONS APPROVED, NOT ACCEPTED 1 $76,750 3 $79,190 9 $89,044 1 $16,270 1 $16,540 APPLICATIONS DENIED 0 $0 8 $59,596 34 $85,954 2 $22,105 1 $56,950 APPLICATIONS WITHDRAWN 0 $0 1 $95,190 11 $79,806 0 $0 0 $0 FILES CLOSED FOR INCOMPLETENESS 1 $68,610 1 $46,650 2 $110,515 0 $0 0 $0
Aggregated Statistics For Year 2002(Based on 1 partial tract) A) FHA, FSA/RHS & VA B) Conventional C) Refinancings D) Home Improvement Loans F) Non-occupant Loans on Number Average Value Number Average Value Number Average Value Number Average Value Number Average Value
LOANS ORIGINATED 3 $84,977 18 $96,080 45 $101,827 5 $9,166 8 $44,171 APPLICATIONS APPROVED, NOT ACCEPTED 0 $0 2 $67,120 8 $83,190 0 $0 1 $49,360 APPLICATIONS DENIED 0 $0 9 $49,750 24 $85,857 2 $28,070 1 $32,820 APPLICATIONS WITHDRAWN 1 $49,900 1 $74,850 8 $95,292 0 $0 0 $0 FILES CLOSED FOR INCOMPLETENESS 0 $0 0 $0 3 $70,420 0 $0 0 $0
Aggregated Statistics For Year 2001(Based on 1 partial tract) A) FHA, FSA/RHS & VA B) Conventional C) Refinancings D) Home Improvement Loans F) Non-occupant Loans on Number Average Value Number Average Value Number Average Value Number Average Value Number Average Value
LOANS ORIGINATED 6 $71,100 21 $86,048 41 $91,646 6 $13,333 8 $59,121 APPLICATIONS APPROVED, NOT ACCEPTED 0 $0 5 $58,200 5 $77,564 1 $48,820 1 $32,540 APPLICATIONS DENIED 0 $0 15 $50,533 25 $69,828 2 $42,985 1 $37,700 APPLICATIONS WITHDRAWN 0 $0 1 $175,200 8 $88,716 1 $7,590 0 $0 FILES CLOSED FOR INCOMPLETENESS 1 $44,750 1 $61,830 2 $73,630 1 $6,240 0 $0
Aggregated Statistics For Year 2000(Based on 1 partial tract) A) FHA, FSA/RHS & VA B) Conventional C) Refinancings D) Home Improvement Loans F) Non-occupant Loans on Number Average Value Number Average Value Number Average Value Number Average Value Number Average Value
LOANS ORIGINATED 6 $83,485 22 $81,409 18 $70,542 11 $8,654 4 $52,815 APPLICATIONS APPROVED, NOT ACCEPTED 2 $49,085 7 $44,129 5 $83,042 1 $20,340 1 $23,870 APPLICATIONS DENIED 3 $49,810 53 $42,937 26 $53,948 4 $20,205 1 $34,170 APPLICATIONS WITHDRAWN 1 $39,600 2 $74,850 7 $67,257 1 $33,630 1 $62,920 FILES CLOSED FOR INCOMPLETENESS 0 $0 2 $86,785 4 $84,885 0 $0 0 $0
Aggregated Statistics For Year 1999(Based on 1 partial tract) A) FHA, FSA/RHS & VA B) Conventional C) Refinancings D) Home Improvement Loans F) Non-occupant Loans on Number Average Value Number Average Value Number Average Value Number Average Value Number Average Value
LOANS ORIGINATED 6 $75,755 25 $75,183 28 $71,556 13 $12,845 6 $42,428 APPLICATIONS APPROVED, NOT ACCEPTED 0 $0 11 $51,154 12 $66,478 2 $18,335 0 $0 APPLICATIONS DENIED 2 $54,080 37 $50,528 27 $67,738 6 $14,025 3 $56,453 APPLICATIONS WITHDRAWN 0 $0 3 $70,787 12 $63,334 1 $2,640 0 $0 FILES CLOSED FOR INCOMPLETENESS 0 $0 1 $66,480 4 $82,768 0 $0 0 $0
Detailed HMDA statistics for the following Tracts:
0205.02
Private Mortgage Insurance Companies Aggregated Statistics For Year 2008(Based on 1 partial tract) A) Conventional B) Refinancings C) Non-occupant Loans on Number Average Value Number Average Value Number Average Value
LOANS ORIGINATED 5 $175,412 4 $148,278 1 $65,090 APPLICATIONS APPROVED, NOT ACCEPTED 2 $216,010 1 $164,080 0 $0 APPLICATIONS DENIED 0 $0 0 $0 0 $0 APPLICATIONS WITHDRAWN 1 $144,550 0 $0 0 $0 FILES CLOSED FOR INCOMPLETENESS 0 $0 0 $0 0 $0
Aggregated Statistics For Year 2007(Based on 1 partial tract) A) Conventional B) Refinancings C) Non-occupant Loans on Number Average Value Number Average Value Number Average Value
LOANS ORIGINATED 10 $151,601 4 $157,365 2 $141,700 APPLICATIONS APPROVED, NOT ACCEPTED 1 $145,630 1 $110,380 0 $0 APPLICATIONS DENIED 0 $0 0 $0 0 $0 APPLICATIONS WITHDRAWN 0 $0 1 $265,500 0 $0 FILES CLOSED FOR INCOMPLETENESS 0 $0 0 $0 0 $0
Aggregated Statistics For Year 2006(Based on 1 partial tract) A) Conventional B) Refinancings C) Non-occupant Loans on Number Average Value Number Average Value Number Average Value
LOANS ORIGINATED 5 $184,796 3 $128,097 1 $187,130 APPLICATIONS APPROVED, NOT ACCEPTED 0 $0 1 $200,960 0 $0 APPLICATIONS DENIED 0 $0 0 $0 0 $0 APPLICATIONS WITHDRAWN 1 $129,090 1 $119,600 0 $0 FILES CLOSED FOR INCOMPLETENESS 0 $0 0 $0 0 $0
Aggregated Statistics For Year 2005(Based on 1 partial tract) A) Conventional B) Refinancings C) Non-occupant Loans on Number Average Value Number Average Value Number Average Value
LOANS ORIGINATED 14 $137,014 4 $153,025 2 $96,410 APPLICATIONS APPROVED, NOT ACCEPTED 1 $124,750 1 $160,010 0 $0 APPLICATIONS DENIED 0 $0 0 $0 0 $0 APPLICATIONS WITHDRAWN 2 $185,635 0 $0 0 $0 FILES CLOSED FOR INCOMPLETENESS 0 $0 0 $0 0 $0
Aggregated Statistics For Year 2004(Based on 1 partial tract) A) Conventional B) Refinancings C) Non-occupant Loans on Number Average Value Number Average Value Number Average Value
LOANS ORIGINATED 10 $133,891 3 $136,503 1 $124,210 APPLICATIONS APPROVED, NOT ACCEPTED 1 $157,840 1 $189,300 0 $0 APPLICATIONS DENIED 0 $0 0 $0 0 $0 APPLICATIONS WITHDRAWN 2 $107,530 0 $0 1 $68,070 FILES CLOSED FOR INCOMPLETENESS 0 $0 0 $0 0 $0
Aggregated Statistics For Year 2003(Based on 1 partial tract) A) Conventional B) Refinancings C) Non-occupant Loans on Number Average Value Number Average Value Number Average Value
LOANS ORIGINATED 7 $127,347 9 $151,721 1 $89,220 APPLICATIONS APPROVED, NOT ACCEPTED 0 $0 2 $161,635 0 $0 APPLICATIONS DENIED 0 $0 0 $0 0 $0 APPLICATIONS WITHDRAWN 1 $119,330 0 $0 0 $0 FILES CLOSED FOR INCOMPLETENESS 0 $0 0 $0 0 $0
Aggregated Statistics For Year 2002(Based on 1 partial tract) A) Conventional B) Refinancings C) Non-occupant Loans on Number Average Value Number Average Value Number Average Value
LOANS ORIGINATED 5 $127,356 5 $127,844 1 $27,660 APPLICATIONS APPROVED, NOT ACCEPTED 2 $73,360 3 $122,310 0 $0 APPLICATIONS DENIED 0 $0 0 $0 0 $0 APPLICATIONS WITHDRAWN 0 $0 0 $0 0 $0 FILES CLOSED FOR INCOMPLETENESS 0 $0 0 $0 0 $0
Aggregated Statistics For Year 2001(Based on 1 partial tract) A) Conventional B) Refinancings C) Non-occupant Loans on Number Average Value Number Average Value Number Average Value
LOANS ORIGINATED 7 $123,744 5 $92,696 1 $61,020 APPLICATIONS APPROVED, NOT ACCEPTED 1 $73,500 1 $125,290 0 $0 APPLICATIONS DENIED 0 $0 0 $0 0 $0 APPLICATIONS WITHDRAWN 0 $0 0 $0 0 $0 FILES CLOSED FOR INCOMPLETENESS 0 $0 0 $0 0 $0
Aggregated Statistics For Year 2000(Based on 1 partial tract) A) Conventional B) Refinancings Number Average Value Number Average Value
LOANS ORIGINATED 4 $125,972 1 $105,770 APPLICATIONS APPROVED, NOT ACCEPTED 0 $0 0 $0 APPLICATIONS DENIED 0 $0 0 $0 APPLICATIONS WITHDRAWN 0 $0 0 $0 FILES CLOSED FOR INCOMPLETENESS 0 $0 0 $0
Aggregated Statistics For Year 1999(Based on 1 partial tract) A) Conventional B) Refinancings Number Average Value Number Average Value
LOANS ORIGINATED 4 $109,410 3 $101,740 APPLICATIONS APPROVED, NOT ACCEPTED 0 $0 0 $0 APPLICATIONS DENIED 0 $0 1 $26,380 APPLICATIONS WITHDRAWN 1 $65,690 0 $0 FILES CLOSED FOR INCOMPLETENESS 0 $0 0 $0
Detailed PMIC statistics for the following Tracts:
0205.02
Most common first names in Moncks Corner, SC among deceased individuals Name Count Lived (average)
William 135 71.6 years James 134 69.9 years John 104 71.1 years Mary 101 74.3 years Robert 77 68.3 years Charles 58 66.2 years Henry 52 73.3 years George 51 72.1 years Willie 50 74.6 years Edward 46 71.2 years
Most common last names in Moncks Corner, SC among deceased individuals Last name Count Lived (average)
Brown 76 72.5 years Simmons 58 69.3 years Williams 56 70.7 years Smith 55 73.9 years Clark 49 68.3 years Reid 48 68.5 years Driggers 41 71.5 years Wilson 37 68.6 years Johnson 36 69.4 years Davis 34 71.3 years
Moncks Corner compared to South Carolina state average:
Unemployed percentage below state average. Black race population percentage significantly above state average. Median age below state average. Length of stay since moving in above state average. House age below state average. Institutionalized population percentage significantly above state average. Number of college students above state average. Moncks Corner on our top lists :
#44 on the list of "Top 101 cities with largest percentage of males in occupations: fire fighting and prevention workers including supervisors (population 5,000+)"
#78 on the list of "Top 101 cities with largest percentage of males in occupations: installation, maintenance, and repair occupations (population 5,000+)"
#93 on the list of "Top 101 cities with largest percentage of females in industries: administrative and support and waste management services (population 5,000+)"
#23 on the list of "Top 101 counties with the highest percentage of residents relocating from other counties between 2010 and 2011 (pop. 50,000+)"
#38 on the list of "Top 101 counties with the lowest percentage of residents that visited a dentist within the past year"
#38 on the list of "Top 101 counties with the highest average weight of females"
#42 on the list of "Top 101 counties with the smallest number of people without health insurance coverage in 2000 (pop. 50,000+)"
#43 on the list of "Top 101 counties with the highest percentage of residents relocating to other counties in 2011 (pop. 50,000+)"
Top Patent Applicants
Roger Dalton (3)
David Michael Strickland (2)
Addison C. Kierspe (2)
Brian P. Hollon (2)
Peter Evans Myers, Iv (1)
Nicholas Gourdine (1)
Michael Mitas (1)
Leshaun Swinton (1)
Victoria Lorane Dy (1)
Ian Capstick (1)
Total of 22 patent applications in 2008-2024.
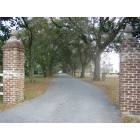
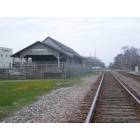
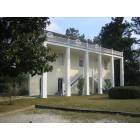
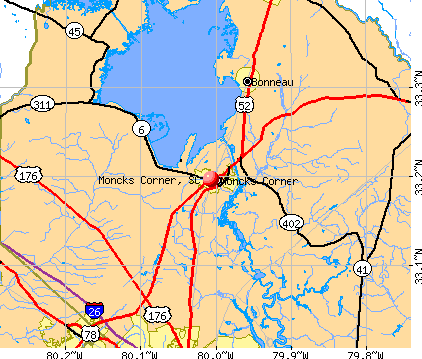


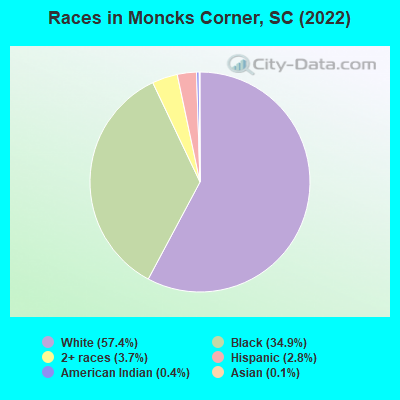
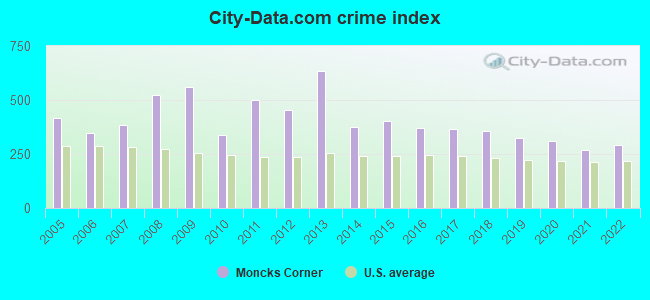
 Recent articles from our blog. Our writers, many of them Ph.D. graduates or candidates, create easy-to-read articles on a wide variety of topics.

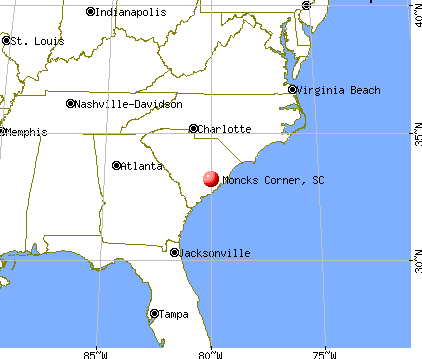
 (21.5 miles
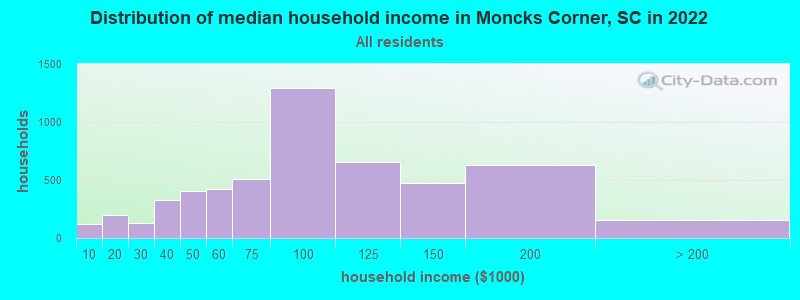
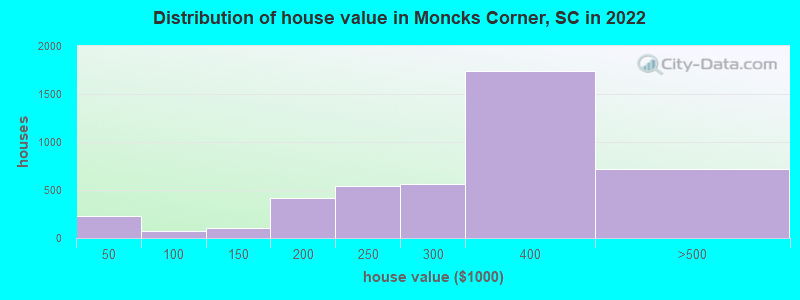

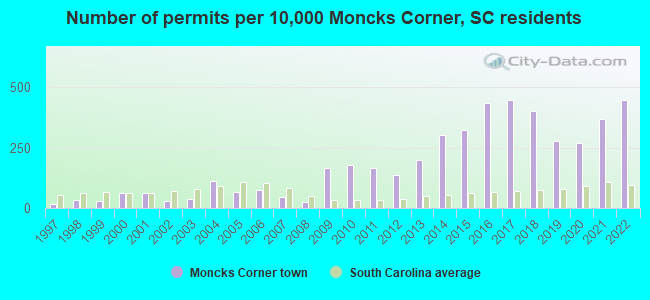
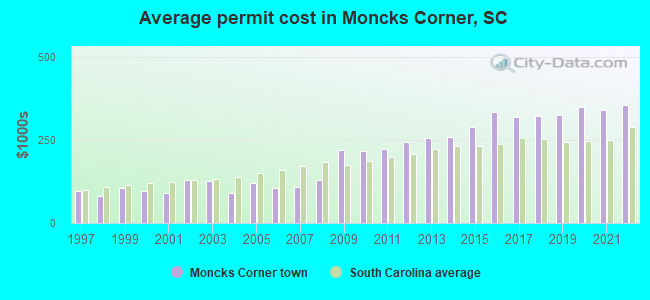
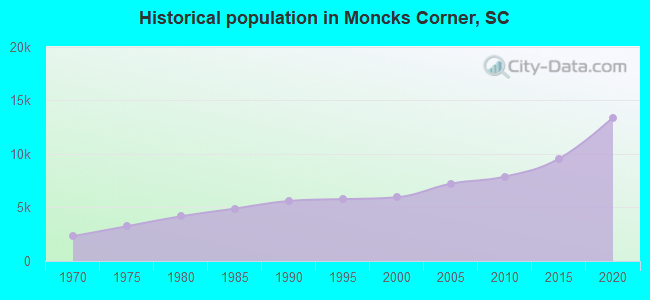
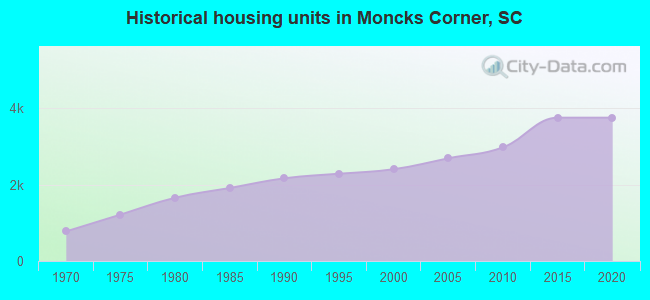
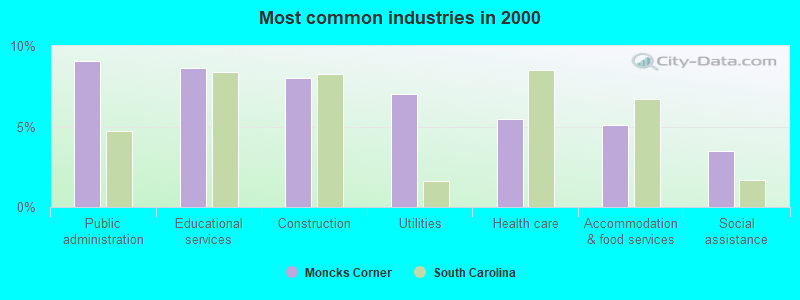
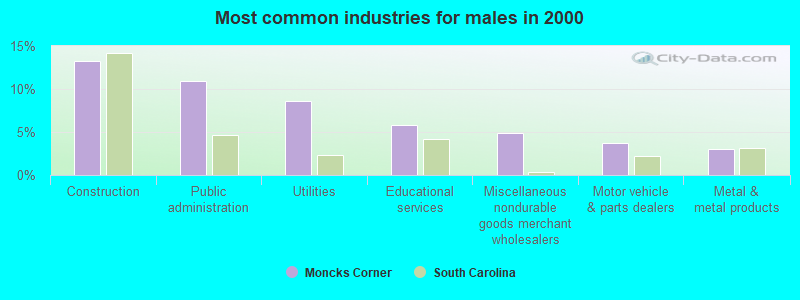
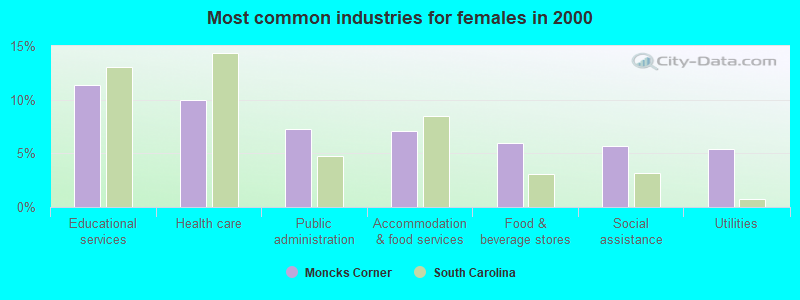
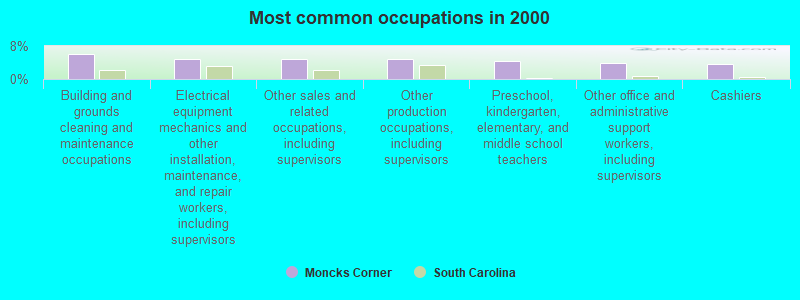
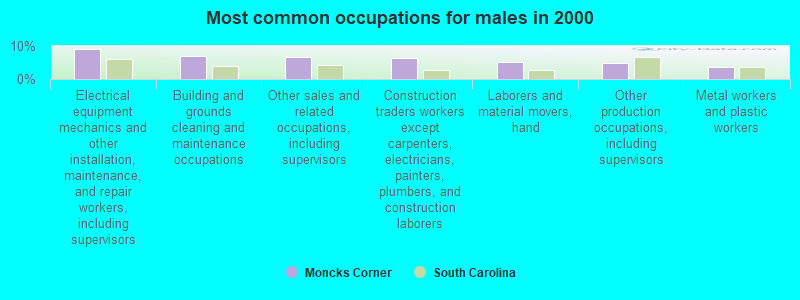
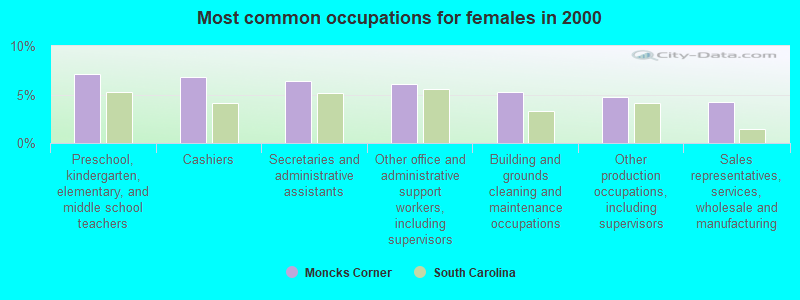
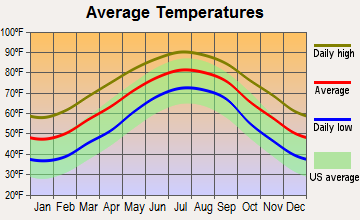


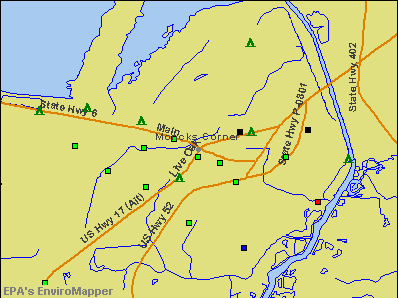

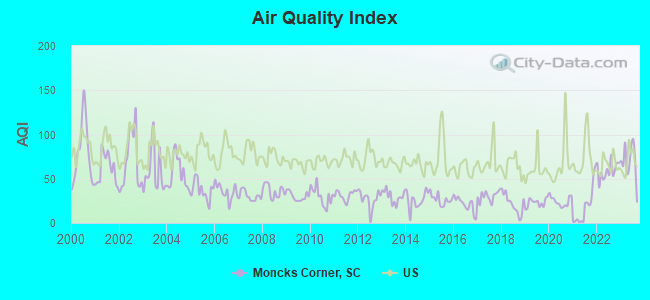
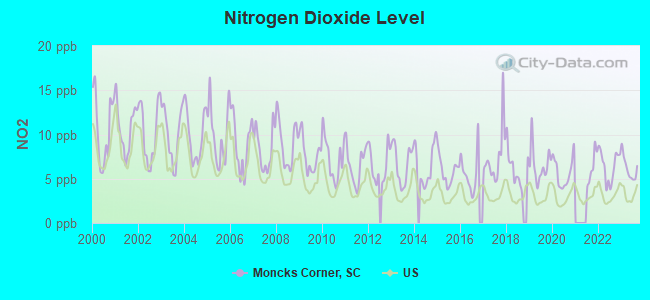
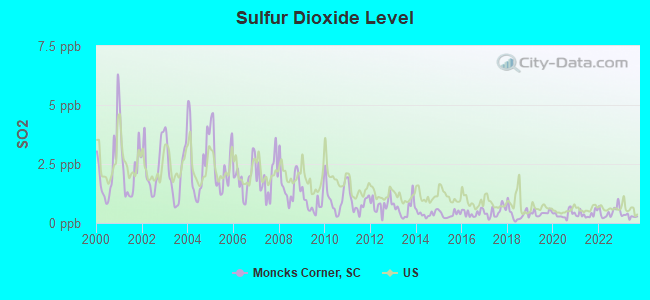
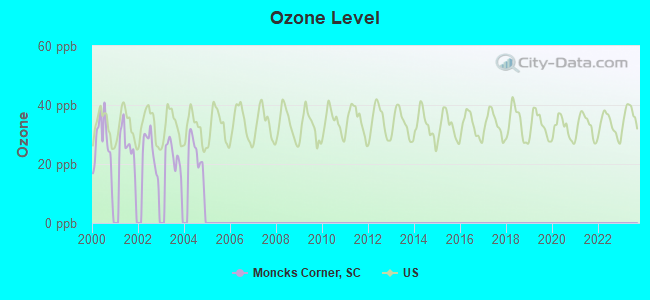
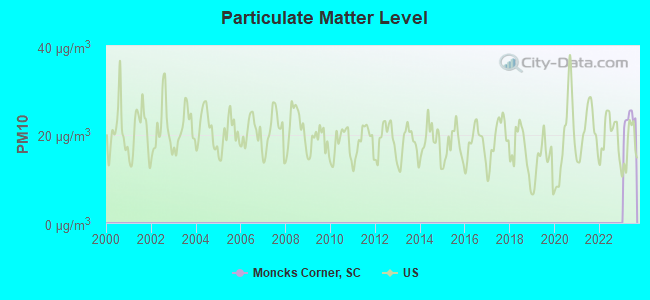
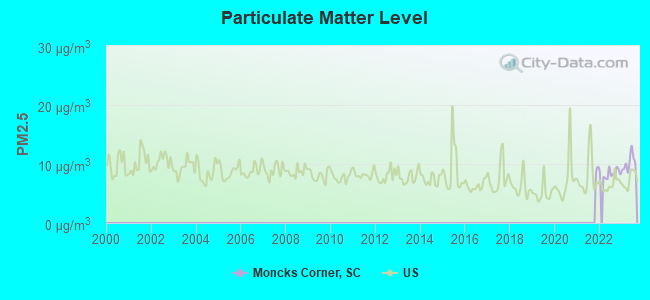
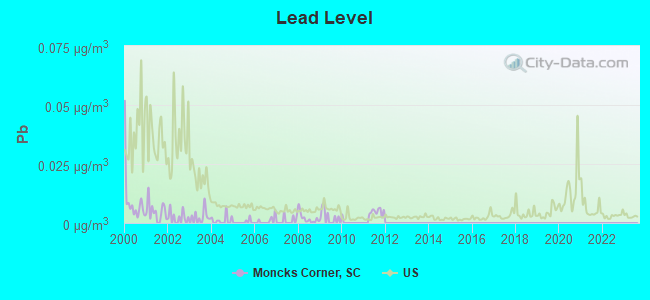

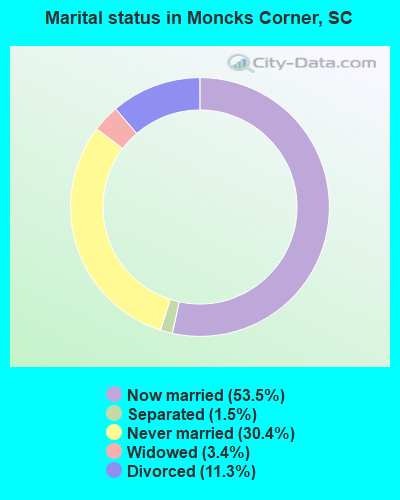
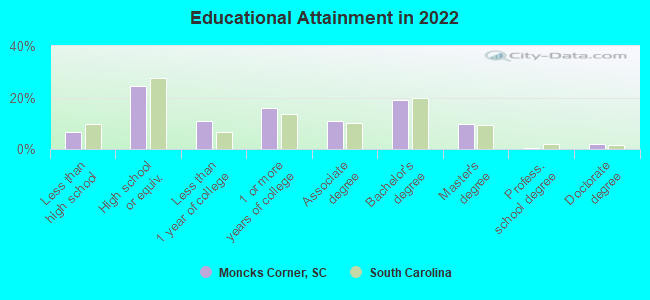
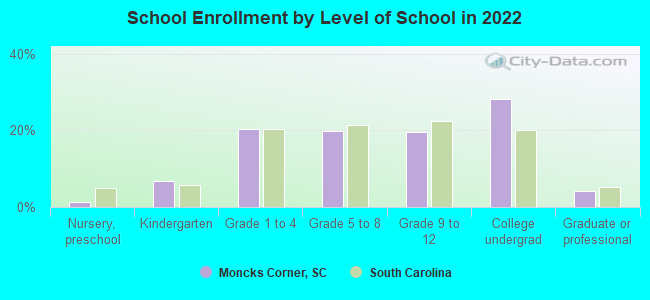
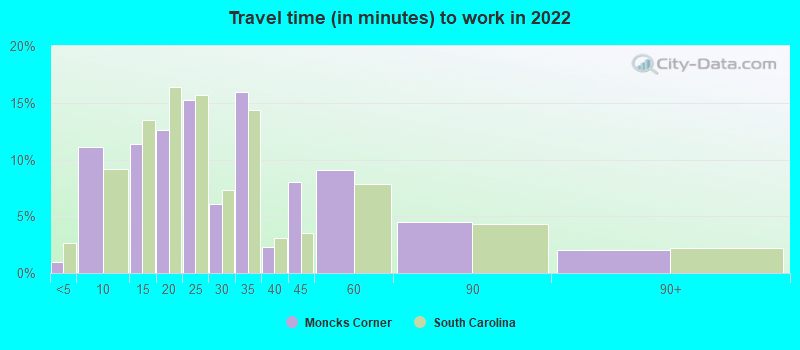
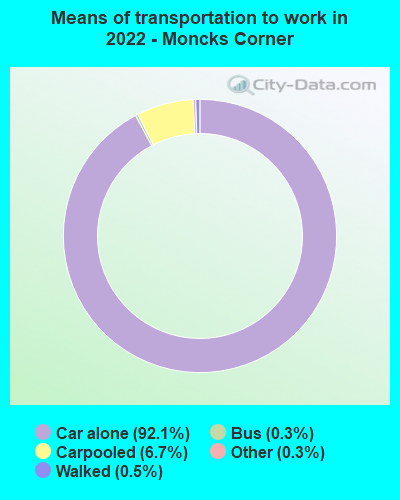
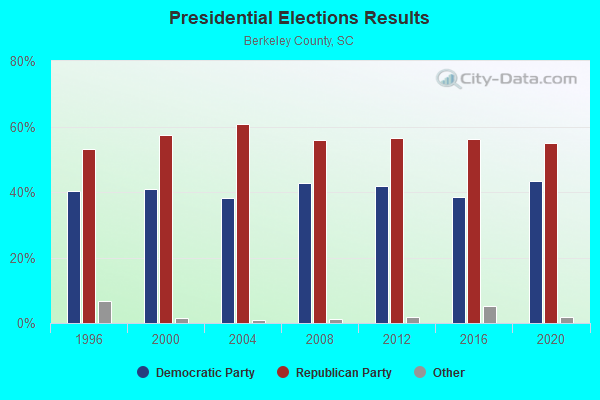
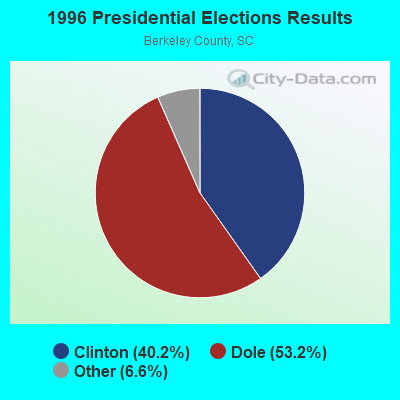
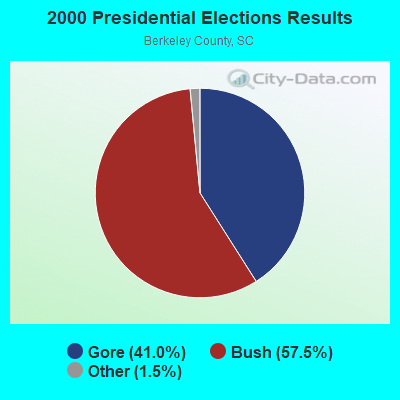
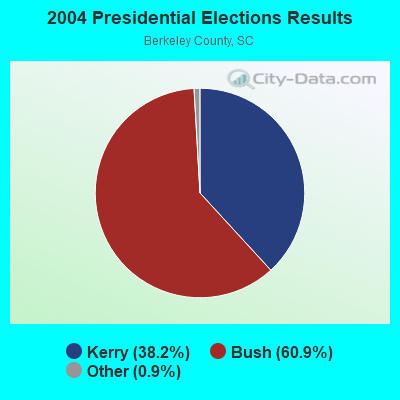
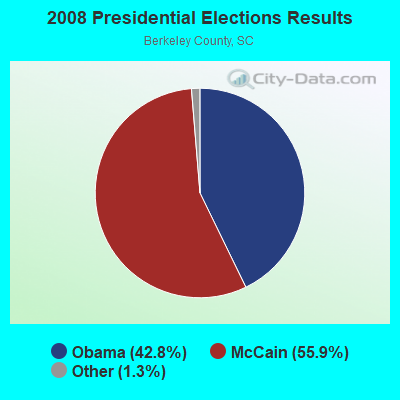
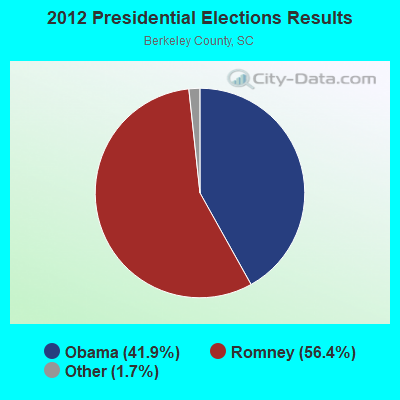
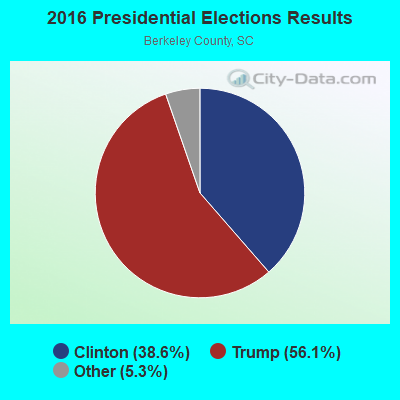
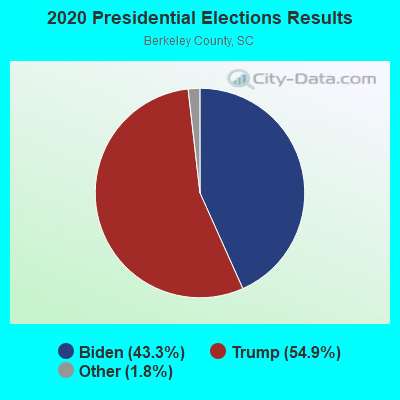
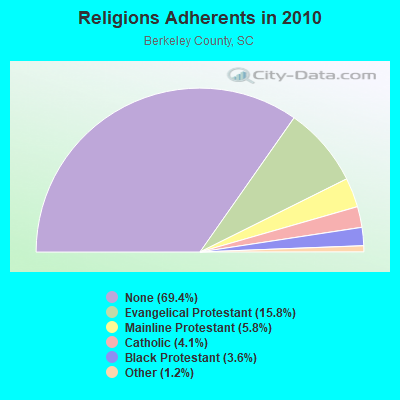
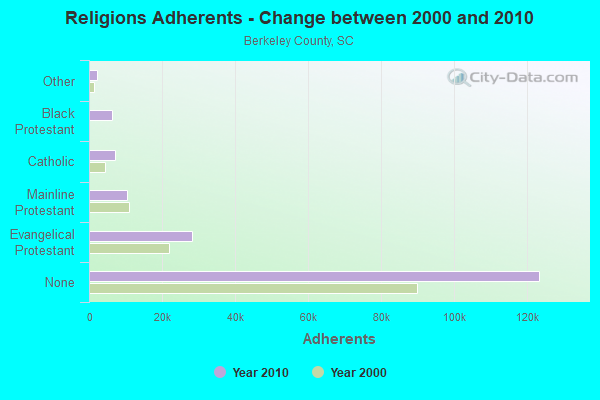
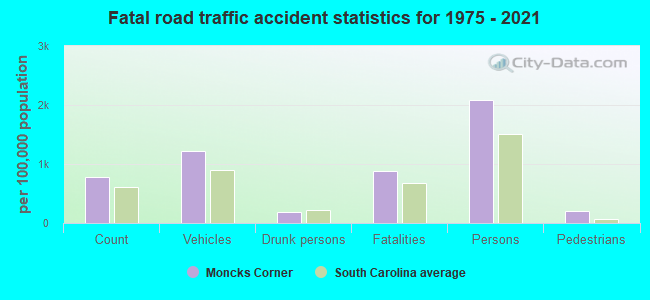
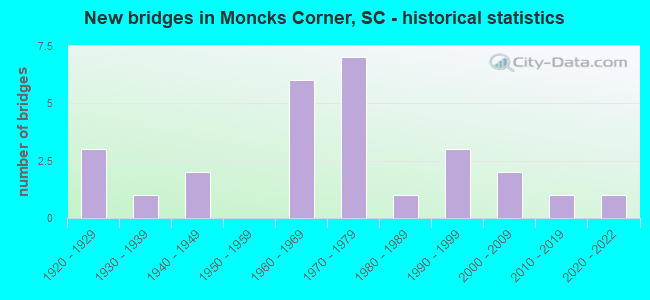
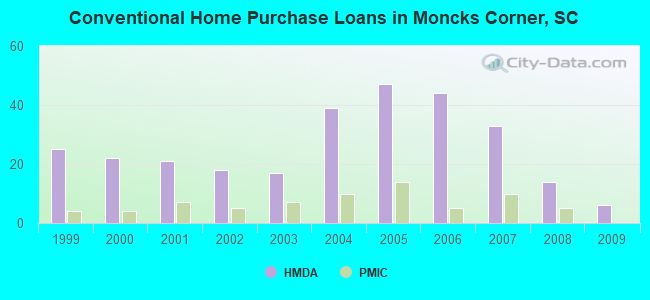
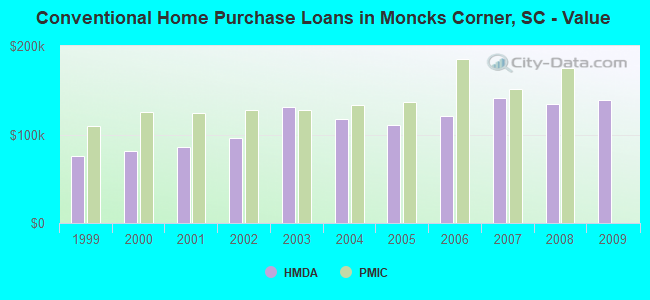
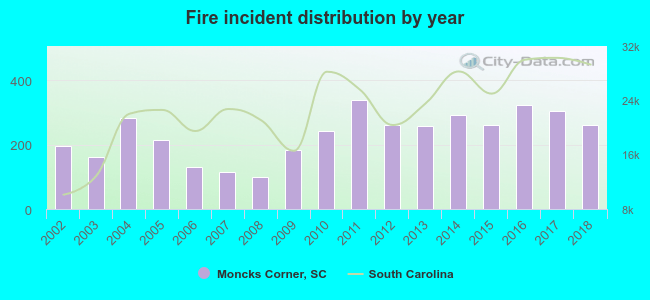 According to the data from the years 2002 - 2018 the average number of fire incidents per year is 231. The highest number of reported fires - 338 took place in 2011, and the least - 99 in 2008. The data has a growing trend.
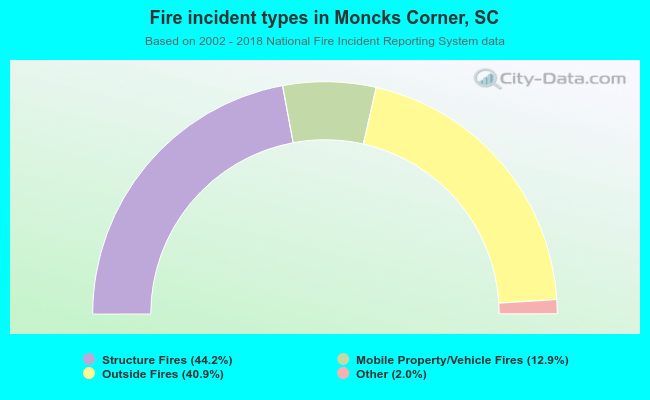 When looking into fire subcategories, the most incidents belonged to: Structure Fires (44.2%), and Outside Fires (40.9%).