Layton, Utah Submit your own pictures of this city and show them to the world
OSM Map
General Map
Google Map
MSN Map
OSM Map
General Map
Google Map
MSN Map
OSM Map
General Map
Google Map
MSN Map
OSM Map
General Map
Google Map
MSN Map
Please wait while loading the map...
Population in 2022: 82,601 (100% urban, 0% rural). Population change since 2000: +41.3%Males: 42,538 Females: 40,063
March 2022 cost of living index in Layton: 88.9 (less than average, U.S. average is 100) Percentage of residents living in poverty in 2022: 5.9%for White Non-Hispanic residents , 4.5% for Black residents , 10.4% for Hispanic or Latino residents , 2.2% for American Indian residents , 0.3% for Native Hawaiian and other Pacific Islander residents , 12.6% for other race residents , 3.2% for two or more races residents )
Profiles of local businesses
Business Search - 14 Million verified businesses
Data:
Median household income ($)
Median household income (% change since 2000)
Household income diversity
Ratio of average income to average house value (%)
Ratio of average income to average rent
Median household income ($) - White
Median household income ($) - Black or African American
Median household income ($) - Asian
Median household income ($) - Hispanic or Latino
Median household income ($) - American Indian and Alaska Native
Median household income ($) - Multirace
Median household income ($) - Other Race
Median household income for houses/condos with a mortgage ($)
Median household income for apartments without a mortgage ($)
Races - White alone (%)
Races - White alone (% change since 2000)
Races - Black alone (%)
Races - Black alone (% change since 2000)
Races - American Indian alone (%)
Races - American Indian alone (% change since 2000)
Races - Asian alone (%)
Races - Asian alone (% change since 2000)
Races - Hispanic (%)
Races - Hispanic (% change since 2000)
Races - Native Hawaiian and Other Pacific Islander alone (%)
Races - Native Hawaiian and Other Pacific Islander alone (% change since 2000)
Races - Two or more races (%)
Races - Two or more races (% change since 2000)
Races - Other race alone (%)
Races - Other race alone (% change since 2000)
Racial diversity
Unemployment (%)
Unemployment (% change since 2000)
Unemployment (%) - White
Unemployment (%) - Black or African American
Unemployment (%) - Asian
Unemployment (%) - Hispanic or Latino
Unemployment (%) - American Indian and Alaska Native
Unemployment (%) - Multirace
Unemployment (%) - Other Race
Population density (people per square mile)
Population - Males (%)
Population - Females (%)
Population - Males (%) - White
Population - Males (%) - Black or African American
Population - Males (%) - Asian
Population - Males (%) - Hispanic or Latino
Population - Males (%) - American Indian and Alaska Native
Population - Males (%) - Multirace
Population - Males (%) - Other Race
Population - Females (%) - White
Population - Females (%) - Black or African American
Population - Females (%) - Asian
Population - Females (%) - Hispanic or Latino
Population - Females (%) - American Indian and Alaska Native
Population - Females (%) - Multirace
Population - Females (%) - Other Race
Coronavirus confirmed cases (May 23, 2024)
Deaths caused by coronavirus (May 23, 2024)
Coronavirus confirmed cases (per 100k population) (May 23, 2024)
Deaths caused by coronavirus (per 100k population) (May 23, 2024)
Daily increase in number of cases (May 23, 2024)
Weekly increase in number of cases (May 23, 2024)
Cases doubled (in days) (May 23, 2024)
Hospitalized patients (Apr 18, 2022)
Negative test results (Apr 18, 2022)
Total test results (Apr 18, 2022)
COVID Vaccine doses distributed (per 100k population) (Sep 19, 2023)
COVID Vaccine doses administered (per 100k population) (Sep 19, 2023)
COVID Vaccine doses distributed (Sep 19, 2023)
COVID Vaccine doses administered (Sep 19, 2023)
Likely homosexual households (%)
Likely homosexual households (% change since 2000)
Likely homosexual households - Lesbian couples (%)
Likely homosexual households - Lesbian couples (% change since 2000)
Likely homosexual households - Gay men (%)
Likely homosexual households - Gay men (% change since 2000)
Cost of living index
Median gross rent ($)
Median contract rent ($)
Median monthly housing costs ($)
Median house or condo value ($)
Median house or condo value ($ change since 2000)
Mean house or condo value by units in structure - 1, detached ($)
Mean house or condo value by units in structure - 1, attached ($)
Mean house or condo value by units in structure - 2 ($)
Mean house or condo value by units in structure by units in structure - 3 or 4 ($)
Mean house or condo value by units in structure - 5 or more ($)
Mean house or condo value by units in structure - Boat, RV, van, etc. ($)
Mean house or condo value by units in structure - Mobile home ($)
Median house or condo value ($) - White
Median house or condo value ($) - Black or African American
Median house or condo value ($) - Asian
Median house or condo value ($) - Hispanic or Latino
Median house or condo value ($) - American Indian and Alaska Native
Median house or condo value ($) - Multirace
Median house or condo value ($) - Other Race
Median resident age
Resident age diversity
Median resident age - Males
Median resident age - Females
Median resident age - White
Median resident age - Black or African American
Median resident age - Asian
Median resident age - Hispanic or Latino
Median resident age - American Indian and Alaska Native
Median resident age - Multirace
Median resident age - Other Race
Median resident age - Males - White
Median resident age - Males - Black or African American
Median resident age - Males - Asian
Median resident age - Males - Hispanic or Latino
Median resident age - Males - American Indian and Alaska Native
Median resident age - Males - Multirace
Median resident age - Males - Other Race
Median resident age - Females - White
Median resident age - Females - Black or African American
Median resident age - Females - Asian
Median resident age - Females - Hispanic or Latino
Median resident age - Females - American Indian and Alaska Native
Median resident age - Females - Multirace
Median resident age - Females - Other Race
Commute - mean travel time to work (minutes)
Travel time to work - Less than 5 minutes (%)
Travel time to work - Less than 5 minutes (% change since 2000)
Travel time to work - 5 to 9 minutes (%)
Travel time to work - 5 to 9 minutes (% change since 2000)
Travel time to work - 10 to 19 minutes (%)
Travel time to work - 10 to 19 minutes (% change since 2000)
Travel time to work - 20 to 29 minutes (%)
Travel time to work - 20 to 29 minutes (% change since 2000)
Travel time to work - 30 to 39 minutes (%)
Travel time to work - 30 to 39 minutes (% change since 2000)
Travel time to work - 40 to 59 minutes (%)
Travel time to work - 40 to 59 minutes (% change since 2000)
Travel time to work - 60 to 89 minutes (%)
Travel time to work - 60 to 89 minutes (% change since 2000)
Travel time to work - 90 or more minutes (%)
Travel time to work - 90 or more minutes (% change since 2000)
Marital status - Never married (%)
Marital status - Now married (%)
Marital status - Separated (%)
Marital status - Widowed (%)
Marital status - Divorced (%)
Median family income ($)
Median family income (% change since 2000)
Median non-family income ($)
Median non-family income (% change since 2000)
Median per capita income ($)
Median per capita income (% change since 2000)
Median family income ($) - White
Median family income ($) - Black or African American
Median family income ($) - Asian
Median family income ($) - Hispanic or Latino
Median family income ($) - American Indian and Alaska Native
Median family income ($) - Multirace
Median family income ($) - Other Race
Median year house/condo built
Median year apartment built
Year house built - Built 2005 or later (%)
Year house built - Built 2000 to 2004 (%)
Year house built - Built 1990 to 1999 (%)
Year house built - Built 1980 to 1989 (%)
Year house built - Built 1970 to 1979 (%)
Year house built - Built 1960 to 1969 (%)
Year house built - Built 1950 to 1959 (%)
Year house built - Built 1940 to 1949 (%)
Year house built - Built 1939 or earlier (%)
Average household size
Household density (households per square mile)
Average household size - White
Average household size - Black or African American
Average household size - Asian
Average household size - Hispanic or Latino
Average household size - American Indian and Alaska Native
Average household size - Multirace
Average household size - Other Race
Occupied housing units (%)
Vacant housing units (%)
Owner occupied housing units (%)
Renter occupied housing units (%)
Vacancy status - For rent (%)
Vacancy status - For sale only (%)
Vacancy status - Rented or sold, not occupied (%)
Vacancy status - For seasonal, recreational, or occasional use (%)
Vacancy status - For migrant workers (%)
Vacancy status - Other vacant (%)
Residents with income below the poverty level (%)
Residents with income below 50% of the poverty level (%)
Children below poverty level (%)
Poor families by family type - Married-couple family (%)
Poor families by family type - Male, no wife present (%)
Poor families by family type - Female, no husband present (%)
Poverty status for native-born residents (%)
Poverty status for foreign-born residents (%)
Poverty among high school graduates not in families (%)
Poverty among people who did not graduate high school not in families (%)
Residents with income below the poverty level (%) - White
Residents with income below the poverty level (%) - Black or African American
Residents with income below the poverty level (%) - Asian
Residents with income below the poverty level (%) - Hispanic or Latino
Residents with income below the poverty level (%) - American Indian and Alaska Native
Residents with income below the poverty level (%) - Multirace
Residents with income below the poverty level (%) - Other Race
Air pollution - Air Quality Index (AQI)
Air pollution - CO
Air pollution - NO2
Air pollution - SO2
Air pollution - Ozone
Air pollution - PM10
Air pollution - PM25
Air pollution - Pb
Crime - Murders per 100,000 population
Crime - Rapes per 100,000 population
Crime - Robberies per 100,000 population
Crime - Assaults per 100,000 population
Crime - Burglaries per 100,000 population
Crime - Thefts per 100,000 population
Crime - Auto thefts per 100,000 population
Crime - Arson per 100,000 population
Crime - City-data.com crime index
Crime - Violent crime index
Crime - Property crime index
Crime - Murders per 100,000 population (5 year average)
Crime - Rapes per 100,000 population (5 year average)
Crime - Robberies per 100,000 population (5 year average)
Crime - Assaults per 100,000 population (5 year average)
Crime - Burglaries per 100,000 population (5 year average)
Crime - Thefts per 100,000 population (5 year average)
Crime - Auto thefts per 100,000 population (5 year average)
Crime - Arson per 100,000 population (5 year average)
Crime - City-data.com crime index (5 year average)
Crime - Violent crime index (5 year average)
Crime - Property crime index (5 year average)
1996 Presidential Elections Results (%) - Democratic Party (Clinton)
1996 Presidential Elections Results (%) - Republican Party (Dole)
1996 Presidential Elections Results (%) - Other
2000 Presidential Elections Results (%) - Democratic Party (Gore)
2000 Presidential Elections Results (%) - Republican Party (Bush)
2000 Presidential Elections Results (%) - Other
2004 Presidential Elections Results (%) - Democratic Party (Kerry)
2004 Presidential Elections Results (%) - Republican Party (Bush)
2004 Presidential Elections Results (%) - Other
2008 Presidential Elections Results (%) - Democratic Party (Obama)
2008 Presidential Elections Results (%) - Republican Party (McCain)
2008 Presidential Elections Results (%) - Other
2012 Presidential Elections Results (%) - Democratic Party (Obama)
2012 Presidential Elections Results (%) - Republican Party (Romney)
2012 Presidential Elections Results (%) - Other
2016 Presidential Elections Results (%) - Democratic Party (Clinton)
2016 Presidential Elections Results (%) - Republican Party (Trump)
2016 Presidential Elections Results (%) - Other
2020 Presidential Elections Results (%) - Democratic Party (Biden)
2020 Presidential Elections Results (%) - Republican Party (Trump)
2020 Presidential Elections Results (%) - Other
Ancestries Reported - Arab (%)
Ancestries Reported - Czech (%)
Ancestries Reported - Danish (%)
Ancestries Reported - Dutch (%)
Ancestries Reported - English (%)
Ancestries Reported - French (%)
Ancestries Reported - French Canadian (%)
Ancestries Reported - German (%)
Ancestries Reported - Greek (%)
Ancestries Reported - Hungarian (%)
Ancestries Reported - Irish (%)
Ancestries Reported - Italian (%)
Ancestries Reported - Lithuanian (%)
Ancestries Reported - Norwegian (%)
Ancestries Reported - Polish (%)
Ancestries Reported - Portuguese (%)
Ancestries Reported - Russian (%)
Ancestries Reported - Scotch-Irish (%)
Ancestries Reported - Scottish (%)
Ancestries Reported - Slovak (%)
Ancestries Reported - Subsaharan African (%)
Ancestries Reported - Swedish (%)
Ancestries Reported - Swiss (%)
Ancestries Reported - Ukrainian (%)
Ancestries Reported - United States (%)
Ancestries Reported - Welsh (%)
Ancestries Reported - West Indian (%)
Ancestries Reported - Other (%)
Educational Attainment - No schooling completed (%)
Educational Attainment - Less than high school (%)
Educational Attainment - High school or equivalent (%)
Educational Attainment - Less than 1 year of college (%)
Educational Attainment - 1 or more years of college (%)
Educational Attainment - Associate degree (%)
Educational Attainment - Bachelor's degree (%)
Educational Attainment - Master's degree (%)
Educational Attainment - Professional school degree (%)
Educational Attainment - Doctorate degree (%)
School Enrollment - Nursery, preschool (%)
School Enrollment - Kindergarten (%)
School Enrollment - Grade 1 to 4 (%)
School Enrollment - Grade 5 to 8 (%)
School Enrollment - Grade 9 to 12 (%)
School Enrollment - College undergrad (%)
School Enrollment - Graduate or professional (%)
School Enrollment - Not enrolled in school (%)
School enrollment - Public schools (%)
School enrollment - Private schools (%)
School enrollment - Not enrolled (%)
Median number of rooms in houses and condos
Median number of rooms in apartments
Housing units lacking complete plumbing facilities (%)
Housing units lacking complete kitchen facilities (%)
Density of houses
Urban houses (%)
Rural houses (%)
Households with people 60 years and over (%)
Households with people 65 years and over (%)
Households with people 75 years and over (%)
Households with one or more nonrelatives (%)
Households with no nonrelatives (%)
Population in households (%)
Family households (%)
Nonfamily households (%)
Population in families (%)
Family households with own children (%)
Median number of bedrooms in owner occupied houses
Mean number of bedrooms in owner occupied houses
Median number of bedrooms in renter occupied houses
Mean number of bedrooms in renter occupied houses
Median number of vehichles in owner occupied houses
Mean number of vehichles in owner occupied houses
Median number of vehichles in renter occupied houses
Mean number of vehichles in renter occupied houses
Mortgage status - with mortgage (%)
Mortgage status - with second mortgage (%)
Mortgage status - with home equity loan (%)
Mortgage status - with both second mortgage and home equity loan (%)
Mortgage status - without a mortgage (%)
Average family size
Average family size - White
Average family size - Black or African American
Average family size - Asian
Average family size - Hispanic or Latino
Average family size - American Indian and Alaska Native
Average family size - Multirace
Average family size - Other Race
Geographical mobility - Same house 1 year ago (%)
Geographical mobility - Moved within same county (%)
Geographical mobility - Moved from different county within same state (%)
Geographical mobility - Moved from different state (%)
Geographical mobility - Moved from abroad (%)
Place of birth - Born in state of residence (%)
Place of birth - Born in other state (%)
Place of birth - Native, outside of US (%)
Place of birth - Foreign born (%)
Housing units in structures - 1, detached (%)
Housing units in structures - 1, attached (%)
Housing units in structures - 2 (%)
Housing units in structures - 3 or 4 (%)
Housing units in structures - 5 to 9 (%)
Housing units in structures - 10 to 19 (%)
Housing units in structures - 20 to 49 (%)
Housing units in structures - 50 or more (%)
Housing units in structures - Mobile home (%)
Housing units in structures - Boat, RV, van, etc. (%)
House/condo owner moved in on average (years ago)
Renter moved in on average (years ago)
Year householder moved into unit - Moved in 1999 to March 2000 (%)
Year householder moved into unit - Moved in 1995 to 1998 (%)
Year householder moved into unit - Moved in 1990 to 1994 (%)
Year householder moved into unit - Moved in 1980 to 1989 (%)
Year householder moved into unit - Moved in 1970 to 1979 (%)
Year householder moved into unit - Moved in 1969 or earlier (%)
Means of transportation to work - Drove car alone (%)
Means of transportation to work - Carpooled (%)
Means of transportation to work - Public transportation (%)
Means of transportation to work - Bus or trolley bus (%)
Means of transportation to work - Streetcar or trolley car (%)
Means of transportation to work - Subway or elevated (%)
Means of transportation to work - Railroad (%)
Means of transportation to work - Ferryboat (%)
Means of transportation to work - Taxicab (%)
Means of transportation to work - Motorcycle (%)
Means of transportation to work - Bicycle (%)
Means of transportation to work - Walked (%)
Means of transportation to work - Other means (%)
Working at home (%)
Industry diversity
Most Common Industries - Agriculture, forestry, fishing and hunting, and mining (%)
Most Common Industries - Agriculture, forestry, fishing and hunting (%)
Most Common Industries - Mining, quarrying, and oil and gas extraction (%)
Most Common Industries - Construction (%)
Most Common Industries - Manufacturing (%)
Most Common Industries - Wholesale trade (%)
Most Common Industries - Retail trade (%)
Most Common Industries - Transportation and warehousing, and utilities (%)
Most Common Industries - Transportation and warehousing (%)
Most Common Industries - Utilities (%)
Most Common Industries - Information (%)
Most Common Industries - Finance and insurance, and real estate and rental and leasing (%)
Most Common Industries - Finance and insurance (%)
Most Common Industries - Real estate and rental and leasing (%)
Most Common Industries - Professional, scientific, and management, and administrative and waste management services (%)
Most Common Industries - Professional, scientific, and technical services (%)
Most Common Industries - Management of companies and enterprises (%)
Most Common Industries - Administrative and support and waste management services (%)
Most Common Industries - Educational services, and health care and social assistance (%)
Most Common Industries - Educational services (%)
Most Common Industries - Health care and social assistance (%)
Most Common Industries - Arts, entertainment, and recreation, and accommodation and food services (%)
Most Common Industries - Arts, entertainment, and recreation (%)
Most Common Industries - Accommodation and food services (%)
Most Common Industries - Other services, except public administration (%)
Most Common Industries - Public administration (%)
Occupation diversity
Most Common Occupations - Management, business, science, and arts occupations (%)
Most Common Occupations - Management, business, and financial occupations (%)
Most Common Occupations - Management occupations (%)
Most Common Occupations - Business and financial operations occupations (%)
Most Common Occupations - Computer, engineering, and science occupations (%)
Most Common Occupations - Computer and mathematical occupations (%)
Most Common Occupations - Architecture and engineering occupations (%)
Most Common Occupations - Life, physical, and social science occupations (%)
Most Common Occupations - Education, legal, community service, arts, and media occupations (%)
Most Common Occupations - Community and social service occupations (%)
Most Common Occupations - Legal occupations (%)
Most Common Occupations - Education, training, and library occupations (%)
Most Common Occupations - Arts, design, entertainment, sports, and media occupations (%)
Most Common Occupations - Healthcare practitioners and technical occupations (%)
Most Common Occupations - Health diagnosing and treating practitioners and other technical occupations (%)
Most Common Occupations - Health technologists and technicians (%)
Most Common Occupations - Service occupations (%)
Most Common Occupations - Healthcare support occupations (%)
Most Common Occupations - Protective service occupations (%)
Most Common Occupations - Fire fighting and prevention, and other protective service workers including supervisors (%)
Most Common Occupations - Law enforcement workers including supervisors (%)
Most Common Occupations - Food preparation and serving related occupations (%)
Most Common Occupations - Building and grounds cleaning and maintenance occupations (%)
Most Common Occupations - Personal care and service occupations (%)
Most Common Occupations - Sales and office occupations (%)
Most Common Occupations - Sales and related occupations (%)
Most Common Occupations - Office and administrative support occupations (%)
Most Common Occupations - Natural resources, construction, and maintenance occupations (%)
Most Common Occupations - Farming, fishing, and forestry occupations (%)
Most Common Occupations - Construction and extraction occupations (%)
Most Common Occupations - Installation, maintenance, and repair occupations (%)
Most Common Occupations - Production, transportation, and material moving occupations (%)
Most Common Occupations - Production occupations (%)
Most Common Occupations - Transportation occupations (%)
Most Common Occupations - Material moving occupations (%)
People in Group quarters - Institutionalized population (%)
People in Group quarters - Correctional institutions (%)
People in Group quarters - Federal prisons and detention centers (%)
People in Group quarters - Halfway houses (%)
People in Group quarters - Local jails and other confinement facilities (including police lockups) (%)
People in Group quarters - Military disciplinary barracks (%)
People in Group quarters - State prisons (%)
People in Group quarters - Other types of correctional institutions (%)
People in Group quarters - Nursing homes (%)
People in Group quarters - Hospitals/wards, hospices, and schools for the handicapped (%)
People in Group quarters - Hospitals/wards and hospices for chronically ill (%)
People in Group quarters - Hospices or homes for chronically ill (%)
People in Group quarters - Military hospitals or wards for chronically ill (%)
People in Group quarters - Other hospitals or wards for chronically ill (%)
People in Group quarters - Hospitals or wards for drug/alcohol abuse (%)
People in Group quarters - Mental (Psychiatric) hospitals or wards (%)
People in Group quarters - Schools, hospitals, or wards for the mentally retarded (%)
People in Group quarters - Schools, hospitals, or wards for the physically handicapped (%)
People in Group quarters - Institutions for the deaf (%)
People in Group quarters - Institutions for the blind (%)
People in Group quarters - Orthopedic wards and institutions for the physically handicapped (%)
People in Group quarters - Wards in general hospitals for patients who have no usual home elsewhere (%)
People in Group quarters - Wards in military hospitals for patients who have no usual home elsewhere (%)
People in Group quarters - Juvenile institutions (%)
People in Group quarters - Long-term care (%)
People in Group quarters - Homes for abused, dependent, and neglected children (%)
People in Group quarters - Residential treatment centers for emotionally disturbed children (%)
People in Group quarters - Training schools for juvenile delinquents (%)
People in Group quarters - Short-term care, detention or diagnostic centers for delinquent children (%)
People in Group quarters - Type of juvenile institution unknown (%)
People in Group quarters - Noninstitutionalized population (%)
People in Group quarters - College dormitories (includes college quarters off campus) (%)
People in Group quarters - Military quarters (%)
People in Group quarters - On base (%)
People in Group quarters - Barracks, unaccompanied personnel housing (UPH), (Enlisted/Officer), ;and similar group living quarters for military personnel (%)
People in Group quarters - Transient quarters for temporary residents (%)
People in Group quarters - Military ships (%)
People in Group quarters - Group homes (%)
People in Group quarters - Homes or halfway houses for drug/alcohol abuse (%)
People in Group quarters - Homes for the mentally ill (%)
People in Group quarters - Homes for the mentally retarded (%)
People in Group quarters - Homes for the physically handicapped (%)
People in Group quarters - Other group homes (%)
People in Group quarters - Religious group quarters (%)
People in Group quarters - Dormitories (%)
People in Group quarters - Agriculture workers' dormitories on farms (%)
People in Group quarters - Job Corps and vocational training facilities (%)
People in Group quarters - Other workers' dormitories (%)
People in Group quarters - Crews of maritime vessels (%)
People in Group quarters - Other nonhousehold living situations (%)
People in Group quarters - Other noninstitutional group quarters (%)
Residents speaking English at home (%)
Residents speaking English at home - Born in the United States (%)
Residents speaking English at home - Native, born elsewhere (%)
Residents speaking English at home - Foreign born (%)
Residents speaking Spanish at home (%)
Residents speaking Spanish at home - Born in the United States (%)
Residents speaking Spanish at home - Native, born elsewhere (%)
Residents speaking Spanish at home - Foreign born (%)
Residents speaking other language at home (%)
Residents speaking other language at home - Born in the United States (%)
Residents speaking other language at home - Native, born elsewhere (%)
Residents speaking other language at home - Foreign born (%)
Class of Workers - Employee of private company (%)
Class of Workers - Self-employed in own incorporated business (%)
Class of Workers - Private not-for-profit wage and salary workers (%)
Class of Workers - Local government workers (%)
Class of Workers - State government workers (%)
Class of Workers - Federal government workers (%)
Class of Workers - Self-employed workers in own not incorporated business and Unpaid family workers (%)
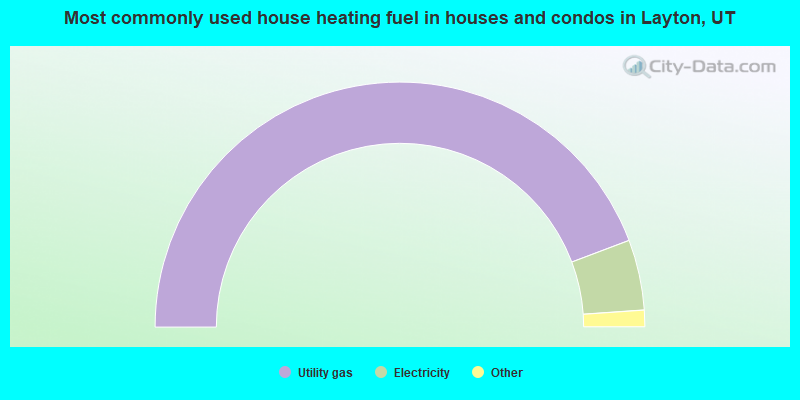
House heating fuel used in houses and condos - Utility gas (%)
House heating fuel used in houses and condos - Bottled, tank, or LP gas (%)
House heating fuel used in houses and condos - Electricity (%)
House heating fuel used in houses and condos - Fuel oil, kerosene, etc. (%)
House heating fuel used in houses and condos - Coal or coke (%)
House heating fuel used in houses and condos - Wood (%)
House heating fuel used in houses and condos - Solar energy (%)
House heating fuel used in houses and condos - Other fuel (%)
House heating fuel used in houses and condos - No fuel used (%)
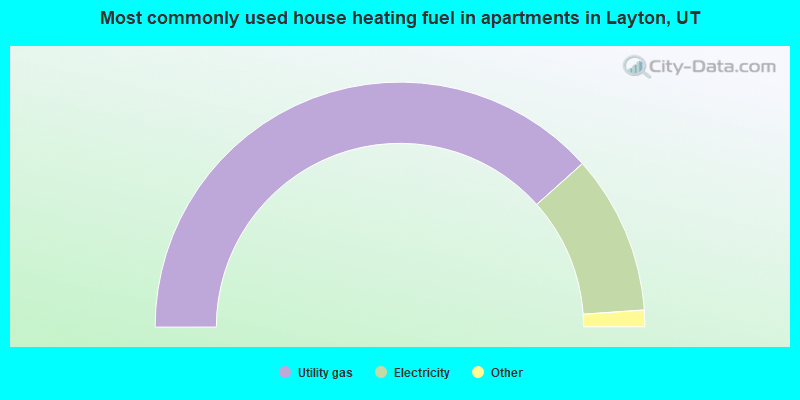
House heating fuel used in apartments - Utility gas (%)
House heating fuel used in apartments - Bottled, tank, or LP gas (%)
House heating fuel used in apartments - Electricity (%)
House heating fuel used in apartments - Fuel oil, kerosene, etc. (%)
House heating fuel used in apartments - Coal or coke (%)
House heating fuel used in apartments - Wood (%)
House heating fuel used in apartments - Solar energy (%)
House heating fuel used in apartments - Other fuel (%)
House heating fuel used in apartments - No fuel used (%)
Armed forces status - In Armed Forces (%)
Armed forces status - Civilian (%)
Armed forces status - Civilian - Veteran (%)
Armed forces status - Civilian - Nonveteran (%)
Fatal accidents locations in years 2005-2021
Fatal accidents locations in 2005
Fatal accidents locations in 2006
Fatal accidents locations in 2007
Fatal accidents locations in 2008
Fatal accidents locations in 2009
Fatal accidents locations in 2010
Fatal accidents locations in 2011
Fatal accidents locations in 2012
Fatal accidents locations in 2013
Fatal accidents locations in 2014
Fatal accidents locations in 2015
Fatal accidents locations in 2016
Fatal accidents locations in 2017
Fatal accidents locations in 2018
Fatal accidents locations in 2019
Fatal accidents locations in 2020
Fatal accidents locations in 2021
Alcohol use - People drinking some alcohol every month (%)
Alcohol use - People not drinking at all (%)
Alcohol use - Average days/month drinking alcohol
Alcohol use - Average drinks/week
Alcohol use - Average days/year people drink much
Audiometry - Average condition of hearing (%)
Audiometry - People that can hear a whisper from across a quiet room (%)
Audiometry - People that can hear normal voice from across a quiet room (%)
Audiometry - Ears ringing, roaring, buzzing (%)
Audiometry - Had a job exposure to loud noise (%)
Audiometry - Had off-work exposure to loud noise (%)
Blood Pressure & Cholesterol - Has high blood pressure (%)
Blood Pressure & Cholesterol - Checking blood pressure at home (%)
Blood Pressure & Cholesterol - Frequently checking blood cholesterol (%)
Blood Pressure & Cholesterol - Has high cholesterol level (%)
Consumer Behavior - Money monthly spent on food at supermarket/grocery store
Consumer Behavior - Money monthly spent on food at other stores
Consumer Behavior - Money monthly spent on eating out
Consumer Behavior - Money monthly spent on carryout/delivered foods
Consumer Behavior - Income spent on food at supermarket/grocery store (%)
Consumer Behavior - Income spent on food at other stores (%)
Consumer Behavior - Income spent on eating out (%)
Consumer Behavior - Income spent on carryout/delivered foods (%)
Current Health Status - General health condition (%)
Current Health Status - Blood donors (%)
Current Health Status - Has blood ever tested for HIV virus (%)
Current Health Status - Left-handed people (%)
Dermatology - People using sunscreen (%)
Diabetes - Diabetics (%)
Diabetes - Had a blood test for high blood sugar (%)
Diabetes - People taking insulin (%)
Diet Behavior & Nutrition - Diet health (%)
Diet Behavior & Nutrition - Milk product consumption (# of products/month)
Diet Behavior & Nutrition - Meals not home prepared (#/week)
Diet Behavior & Nutrition - Meals from fast food or pizza place (#/week)
Diet Behavior & Nutrition - Ready-to-eat foods (#/month)
Diet Behavior & Nutrition - Frozen meals/pizza (#/month)
Drug Use - People that ever used marijuana or hashish (%)
Drug Use - Ever used hard drugs (%)
Drug Use - Ever used any form of cocaine (%)
Drug Use - Ever used heroin (%)
Drug Use - Ever used methamphetamine (%)
Health Insurance - People covered by health insurance (%)
Kidney Conditions-Urology - Avg. # of times urinating at night
Medical Conditions - People with asthma (%)
Medical Conditions - People with anemia (%)
Medical Conditions - People with psoriasis (%)
Medical Conditions - People with overweight (%)
Medical Conditions - Elderly people having difficulties in thinking or remembering (%)
Medical Conditions - People who ever received blood transfusion (%)
Medical Conditions - People having trouble seeing even with glass/contacts (%)
Medical Conditions - People with arthritis (%)
Medical Conditions - People with gout (%)
Medical Conditions - People with congestive heart failure (%)
Medical Conditions - People with coronary heart disease (%)
Medical Conditions - People with angina pectoris (%)
Medical Conditions - People who ever had heart attack (%)
Medical Conditions - People who ever had stroke (%)
Medical Conditions - People with emphysema (%)
Medical Conditions - People with thyroid problem (%)
Medical Conditions - People with chronic bronchitis (%)
Medical Conditions - People with any liver condition (%)
Medical Conditions - People who ever had cancer or malignancy (%)
Mental Health - People who have little interest in doing things (%)
Mental Health - People feeling down, depressed, or hopeless (%)
Mental Health - People who have trouble sleeping or sleeping too much (%)
Mental Health - People feeling tired or having little energy (%)
Mental Health - People with poor appetite or overeating (%)
Mental Health - People feeling bad about themself (%)
Mental Health - People who have trouble concentrating on things (%)
Mental Health - People moving or speaking slowly or too fast (%)
Mental Health - People having thoughts they would be better off dead (%)
Oral Health - Average years since last visit a dentist
Oral Health - People embarrassed because of mouth (%)
Oral Health - People with gum disease (%)
Oral Health - General health of teeth and gums (%)
Oral Health - Average days a week using dental floss/device
Oral Health - Average days a week using mouthwash for dental problem
Oral Health - Average number of teeth
Pesticide Use - Households using pesticides to control insects (%)
Pesticide Use - Households using pesticides to kill weeds (%)
Physical Activity - People doing vigorous-intensity work activities (%)
Physical Activity - People doing moderate-intensity work activities (%)
Physical Activity - People walking or bicycling (%)
Physical Activity - People doing vigorous-intensity recreational activities (%)
Physical Activity - People doing moderate-intensity recreational activities (%)
Physical Activity - Average hours a day doing sedentary activities
Physical Activity - Average hours a day watching TV or videos
Physical Activity - Average hours a day using computer
Physical Functioning - People having limitations keeping them from working (%)
Physical Functioning - People limited in amount of work they can do (%)
Physical Functioning - People that need special equipment to walk (%)
Physical Functioning - People experiencing confusion/memory problems (%)
Physical Functioning - People requiring special healthcare equipment (%)
Prescription Medications - Average number of prescription medicines taking
Preventive Aspirin Use - Adults 40+ taking low-dose aspirin (%)
Reproductive Health - Vaginal deliveries (%)
Reproductive Health - Cesarean deliveries (%)
Reproductive Health - Deliveries resulted in a live birth (%)
Reproductive Health - Pregnancies resulted in a delivery (%)
Reproductive Health - Women breastfeeding newborns (%)
Reproductive Health - Women that had a hysterectomy (%)
Reproductive Health - Women that had both ovaries removed (%)
Reproductive Health - Women that have ever taken birth control pills (%)
Reproductive Health - Women taking birth control pills (%)
Reproductive Health - Women that have ever used Depo-Provera or injectables (%)
Reproductive Health - Women that have ever used female hormones (%)
Sexual Behavior - People 18+ that ever had sex (vaginal, anal, or oral) (%)
Sexual Behavior - Males 18+ that ever had vaginal sex with a woman (%)
Sexual Behavior - Males 18+ that ever performed oral sex on a woman (%)
Sexual Behavior - Males 18+ that ever had anal sex with a woman (%)
Sexual Behavior - Males 18+ that ever had any sex with a man (%)
Sexual Behavior - Females 18+ that ever had vaginal sex with a man (%)
Sexual Behavior - Females 18+ that ever performed oral sex on a man (%)
Sexual Behavior - Females 18+ that ever had anal sex with a man (%)
Sexual Behavior - Females 18+ that ever had any kind of sex with a woman (%)
Sexual Behavior - Average age people first had sex
Sexual Behavior - Average number of female sex partners in lifetime (males 18+)
Sexual Behavior - Average number of female vaginal sex partners in lifetime (males 18+)
Sexual Behavior - Average age people first performed oral sex on a woman (18+)
Sexual Behavior - Average number of woman performed oral sex on in lifetime (18+)
Sexual Behavior - Average number of male sex partners in lifetime (males 18+)
Sexual Behavior - Average number of male anal sex partners in lifetime (males 18+)
Sexual Behavior - Average age people first performed oral sex on a man (18+)
Sexual Behavior - Average number of male oral sex partners in lifetime (18+)
Sexual Behavior - People using protection when performing oral sex (%)
Sexual Behavior - Average number of times people have vaginal or anal sex a year
Sexual Behavior - People having sex without condom (%)
Sexual Behavior - Average number of male sex partners in lifetime (females 18+)
Sexual Behavior - Average number of male vaginal sex partners in lifetime (females 18+)
Sexual Behavior - Average number of female sex partners in lifetime (females 18+)
Sexual Behavior - Circumcised males 18+ (%)
Sleep Disorders - Average hours sleeping at night
Sleep Disorders - People that has trouble sleeping (%)
Smoking-Cigarette Use - People smoking cigarettes (%)
Taste & Smell - People 40+ having problems with smell (%)
Taste & Smell - People 40+ having problems with taste (%)
Taste & Smell - People 40+ that ever had wisdom teeth removed (%)
Taste & Smell - People 40+ that ever had tonsils teeth removed (%)
Taste & Smell - People 40+ that ever had a loss of consciousness because of a head injury (%)
Taste & Smell - People 40+ that ever had a broken nose or other serious injury to face or skull (%)
Taste & Smell - People 40+ that ever had two or more sinus infections (%)
Weight - Average height (inches)
Weight - Average weight (pounds)
Weight - Average BMI
Weight - People that are obese (%)
Weight - People that ever were obese (%)
Weight - People trying to lose weight (%)
According to our research of Utah and other state lists, there were 124 registered sex offenders living in Layton, Utah as of May 23, 2024 . The ratio of all residents to sex offenders in Layton is 610 to 1.The ratio of registered sex offenders to all residents in this city is lower than the state average.
The City-Data.com crime index weighs serious crimes and violent crimes more heavily. Higher means more crime, U.S. average is 246.1. It adjusts for the number of visitors and daily workers commuting into cities.
- means the value is smaller than the state average.
- means the value is about the same as the state average.
- means the value is bigger than the state average.
Crime rate in Layton detailed stats: murders, rapes, robberies, assaults, burglaries, thefts, arson Officers per 1,000 residents here:
0.88Utah average:
1.67
Latest news from Layton, UT collected exclusively by city-data.com from local newspapers, TV, and radio stations
Ancestries: English (23.7%), German (7.7%), American (6.7%), European (6.3%), Irish (3.6%), Scottish (2.4%).
Current Local Time:
Land area: 20.7 square miles.
Population density: 3,989 people per square mile (average).
5,344 residents are foreign born (3.8% Latin America , 1.1% Asia ).
Median real estate property taxes paid for housing units with mortgages in 2022: $2,343 (0.5%)Median real estate property taxes paid for housing units with no mortgage in 2022: $2,475 (0.6%)
Nearest city with pop. 200,000+: Northeast Jefferson, CO (372.1 miles
Nearest city with pop. 1,000,000+: Phoenix, AZ
Nearest cities:
Latitude: 41.08 N, Longitude: 111.96 W
Daytime population change due to commuting: -9,457 (-11.4%)Workers who live and work in this city: 19,998 (43.7%)
Area code commonly used in this area: 801
Layton tourist attractions:
Single-family new house construction building permits:
2022: 241 buildings , average cost: $272,3002021: 430 buildings , average cost: $302,9002020: 580 buildings , average cost: $273,0002019: 446 buildings , average cost: $202,3002018: 427 buildings , average cost: $204,3002017: 220 buildings , average cost: $265,3002016: 242 buildings , average cost: $255,0002015: 264 buildings , average cost: $228,3002014: 258 buildings , average cost: $225,5002013: 291 buildings , average cost: $216,5002012: 279 buildings , average cost: $206,8002011: 159 buildings , average cost: $208,6002010: 148 buildings , average cost: $210,0002009: 129 buildings , average cost: $171,3002008: 94 buildings , average cost: $148,7002007: 250 buildings , average cost: $164,8002006: 404 buildings , average cost: $154,0002005: 398 buildings , average cost: $150,4002004: 299 buildings , average cost: $148,0002003: 358 buildings , average cost: $135,5002002: 327 buildings , average cost: $112,5002001: 299 buildings , average cost: $112,5002000: 326 buildings , average cost: $102,8001999: 536 buildings , average cost: $86,5001998: 695 buildings , average cost: $96,7001997: 537 buildings , average cost: $82,300Unemployment in December 2023:
Population change in the 1990s: +16,293 (+38.6%).
Most common occupations in Layton, UT (%)
Both Males Females
Other sales and related occupations, including supervisors (5.6%)
Computer specialists (4.2%)
Other management occupations, except farmers and farm managers (3.9%)
Other office and administrative support workers, including supervisors (3.8%)
Retail sales workers, except cashiers (3.7%)
Electrical equipment mechanics and other installation, maintenance, and repair workers, including supervisors (3.4%)
Other production occupations, including supervisors (3.2%)
Other sales and related occupations, including supervisors (5.7%)
Computer specialists (5.6%)
Electrical equipment mechanics and other installation, maintenance, and repair workers, including supervisors (5.5%)
Other management occupations, except farmers and farm managers (4.6%)
Other production occupations, including supervisors (4.0%)
Engineers (3.9%)
Material recording, scheduling, dispatching, and distributing workers (3.5%)
Other office and administrative support workers, including supervisors (6.5%)
Information and record clerks, except customer service representatives (5.9%)
Other sales and related occupations, including supervisors (5.4%)
Secretaries and administrative assistants (5.0%)
Preschool, kindergarten, elementary, and middle school teachers (4.3%)
Retail sales workers, except cashiers (4.3%)
Customer service representatives (3.4%)
Earthquake activity:
Layton-area historical earthquake activity is significantly above Utah state average. It is 2126% greater than the overall U.S. average. On 8/18/1959 at 06:37:13, a magnitude 7.7 (7.7 UK, Class: Major, Intensity: VIII - XII) earthquake occurred 250.1 miles away from Layton center, causing $26,000,000 total damage On 10/3/1915 at 06:52:48, a magnitude 7.6 (7.6 UK) earthquake occurred 293.1 miles away from the city center On 10/28/1983 at 14:06:06, a magnitude 7.3 (6.2 MB, 7.3 MS, 7.0 MW) earthquake occurred 227.7 miles away from Layton center, causing 2 deaths ( 2 shaking deaths) and 3 injuries, causing $15,000,000 total damage On 3/28/1975 at 02:31:05, a magnitude 6.2 (6.1 MB, 6.0 MS, 6.2 ML, Class: Strong, Intensity: VII - IX) earthquake occurred 70.0 miles away from Layton center On 3/18/2020 at 13:09:31, a magnitude 5.7 (5.7 MW, Depth: 7.4 mi, Class: Moderate, Intensity: VI - VII) earthquake occurred 23.5 miles away from Layton center On 12/21/1932 at 06:10:09, a magnitude 7.2 (7.2 UK) earthquake occurred 370.9 miles away from Layton center Magnitude types: body-wave magnitude (MB), local magnitude (ML), surface-wave magnitude (MS), moment magnitude (MW) Natural disasters: The number of natural disasters in Davis County (7) is smaller than the US average (15).Major Disasters (Presidential) Declared: 3Emergencies Declared: 2Storms: 3, Floods: 2, Landslides: 2, Drought: 1, Earthquake: 1, Hurricane: 1, Mudslide: 1, Other: 1 (Note: some incidents may be assigned to more than one category). Hospitals in Layton: CARING HANDS HOSPICE (3579 NORTH 2175 EAST) COMFORT HOSPICE CARE (1133 NORTH MAIN) DAVIS HOSPITAL AND MEDICAL CENTER (Proprietary, provides emergency services, 1600 WEST ANTELOPE DRIVE) HORIZON HOSPICE LLC (1133 NORTH MAIN SUITE 100) Nursing Homes in Layton: LEGACY VILLAGE OF LAYTON (1203 NORTH FAIRFIELD ROAD) Dialysis Facilities in Layton: FARMINGTON BAY DIALYSIS CENTER (942 S MAIN ST) LIBERTY DIALYSIS - LAYTON (2132 N 1700 W STE 120) Home Health Centers in Layton: LEGACY HEALTHCARE, INC (3135 NORTH FAIRFIELD ROAD, SUITE A) PARACELSUS HOME CARE-DAVIS HOSPITAL (1600 WEST ANTELOPE DRIVE) ROCKY MOUNTAIN HOME CARE (523 WEST HERITAGE PARK BOULEVARD) SUMMIT HOME HEALTH - LAYTON (2086 ROBINS DRIVE) Heliports located in Layton:
Colleges/Universities in Layton: Eagle Gate College-Layton Full-time enrollment: 514; Location: 915 N 400 W; Private, for-profit; Website: www.eaglegatecollege.edu)
Avalon School of Cosmetology-Layton Full-time enrollment: 262; Location: 1992 W Antelope Dr; Private, for-profit; Website: www.avalon.edu/)
Broadview University-Layton Full-time enrollment: 182; Location: 869 West Hill Field Road; Private, for-profit; Website: www.broadviewuniversity.edu/)
Colleges/universities with over 2000 students nearest to Layton:
Weber State University (about 8 miles; Ogden, UT ; Full-time enrollment: 17,655)
Latter-day Saints Business College (about 22 miles; Salt Lake City, UT ; FT enrollment: 2,059)
University of Utah (about 23 miles; Salt Lake City, UT ; FT enrollment: 28,454)
Westminster College (about 25 miles; Salt Lake City, UT ; FT enrollment: 2,870)
Western Governors University (about 28 miles; Salt Lake City, UT ; FT enrollment: 31,481)
Salt Lake Community College (about 29 miles; Salt Lake City, UT ; FT enrollment: 20,797)
Stevens-Henager College-Murray (about 30 miles; Murray, UT ; FT enrollment: 6,395)
Public high schools in Layton: NORTHRIDGE HIGH Students: 1,809, Location: 2430 N HILLFIELD RD, Grades: 10-12)LAYTON HIGH Students: 1,705, Location: 440 LANCER LN, Grades: 10-12)NORTH LAYTON JR HIGH Students: 976, Location: 1100 W 2000 N, Grades: 7-9)LEGACY JR HIGH Students: 966, Location: 411 N 3200 W, Grades: 7-9)CENTRAL DAVIS JR HIGH Students: 909, Location: 663 CHURCH ST, Grades: 7-9)NO UT ACAD FOR MATH ENGINEERING & SCIENCE (NUAMES) Location: 2750 N UNIVERSITY PARK BLVD, Grades: 10-12, Charter school )
NORTH DAVIS PREPARATORY ACADEMY Location: 1765 W HILLFIELD RD, Grades: KG-9, Charter school )
Private high schools in Layton: LAYTON CHRISTIAN ACADEMY Students: 497, Location: 2352 E HIGHWAY 193, Grades: PK-12)
ACADEMY AT SOLSTICE Students: 33, Location: 1904 W GORDON AVE, Grades: 9-12, Girls only )
DORIUS ACADEMY Students: 20, Location: 2405 N HILL FIELD RD, Grades: 8-12, Boys only )
Biggest public elementary/middle schools in Layton: SAND SPRINGS SCHOOL Students: 912, Location: 242 N 3200 W, Grades: KG-6)HERITAGE SCHOOL Students: 824, Location: 1354 W WEAVER LN, Grades: KG-6)ELLISON PARK SCHOOL Students: 814, Location: 800 N COLDCREEK WAY, Grades: KG-6)LINCOLN SCHOOL Students: 802, Location: 591 W 2000 N, Grades: PK-6)MOUNTAIN VIEW SCHOOL Students: 725, Location: 2025 E 3100 N, Grades: PK-6)VAE VIEW SCHOOL Students: 681, Location: 1750 W 1600 N, Grades: PK-6)LAYTON SCHOOL Students: 612, Location: 369 W GENTILE, Grades: KG-6)KING SCHOOL Students: 608, Location: 601 E 1000 N, Grades: PK-6)WHITESIDES SCHOOL Students: 454, Location: 233 N COLONIAL AVE, Grades: PK-6)ADAMS SCHOOL Students: 407, Location: 2200 E 2500 N, Grades: KG-6)Private elementary/middle school in Layton: FAITH BAPTIST ACADEMY Students: 41, Location: 2430 N FAIRFIELD RD, Grades: PK-6)
See full list of schools located in Layton User-submitted facts and corrections:
Layton Christian Academy now offers preK - 12th grade.
Notable locations in Layton: (A) , Circle L Mobile Home Park (B) , Layton Station (C) , Layton City Fire Department Station 51 (D) , Layton City Fire Department Station 52 (E) , Layton City Fire Department Station 53 (F) . Display/hide their locations on the map
Shopping Centers: (1) , Layton Hills Mall Shopping Center (2) , Antelope Square Shopping Center (3) , Layton Hills Mall Convenience Center (4) , Hillgate Shopping Center (5) , Fort Lane Shopping Center (6) . Display/hide their locations on the map
Churches in Layton include: (A) , Calvery Chapel Agape Fellowship (B) , Faith Baptist Church (C) , First Assembly of God Church (D) , Hillfield Catholic Chapel (E) , Hillfield Protestant Chapel (F) , Layton Community Church (G) , Layton Hills Baptist Church (H) , Rosewood Lane Nazarene Chapel (I) . Display/hide their locations on the map
Cemeteries: (1) , Lindquist Cemetery (2) . Display/hide their locations on the map
Reservoirs: (A) , Holmes Reservoir (B) , Hobbs Reservoir (C) . Display/hide their locations on the map
Creeks: (A) , North Fork Kays Creek (B) , Middle Fork Kays Creek (C) , South Fork Kays Creek (D) . Display/hide their locations on the map
Parks in Layton include: (1) , Oak Forest Park (2) , Vae View Park (3) , Layton Heritage Museum Ed Kenly Centennial Amphitheater (4) . Display/hide their locations on the map
Tourist attractions: (1) , Stu's (Amusement & Theme Parks; 1540 West Gordon Avenue) (2) , Sky Coaster (Amusement & Theme Parks; 2985 North 935 East) (3) , Classic Fun Center (Amusement & Theme Parks; 867 North 1200 West) (4) , Amazing Vacations (Tours & Charters; 358 W 425 S) (5) . Display/hide their approximate locations on the map
Hotels: (1) , Outwest Lodge (1904 West Gordon Avenue) (2) , LA Quinta (1965 North 1200 West) (3) , TownePlace Suites Layton (1743 Woodland Park Boulevard) (4) , Desert Moon Center (1904 West Gordon Avenue) (5) , Comfort Inn (877 North 400 West) (6) , Hilton Garden Inn (762 Heritage Park Boulevard) (7) , Fairfield Inn Layton (1740 Heritage Park Boulevard) (8) , Fairfield Inn by Marriott - Layton (1740 North 1200 West) (9) . Display/hide their approximate locations on the map
Court: (1) . Display/hide its approximate location on the map
Birthplace of: Court McGee - Martial artist, Bradon Godfrey - Football player, Chris Anderson - College basketball player (Wyoming Cowboys), Daniel Coats (American football) - Football player, Matt Emadi - College basketball player (Weber State Wildcats), Ryan Larsen - College football player (Southern Utah Thunderbirds), Spencer Adams - Baseball player, Troy Goodell - College basketball player (Weber State Wildcats).
Davis County has a predicted average indoor radon screening level between 2 and 4 pCi/L (pico curies per liter) - Moderate Potential Drinking water stations with addresses in Layton and their reported violations in the past:
LAYTON CITY WATER SYSTEM (Population served: 67,311, Purch surface water):
Past monitoring violations:
7 regular monitoring violations
Population served: 2,000, Groundwater):
Past health violations:
MCL, Monthly (TCR) - In JUL-2013, Contaminant: Coliform. Follow-up actions: St Formal NOV issued (SEP-14-2013), St Public Notif requested (SEP-14-2013)
Past monitoring violations:
Monitoring, Source Water (GWR) - In AUG-01-2013, Contaminant: E. COLI. Follow-up actions: St Formal NOV issued (OCT-04-2013), St Public Notif requested (OCT-04-2013)
Monitoring, Source Water (GWR) - In NOV-01-2010, Contaminant: E. COLI. Follow-up actions: St Formal NOV issued (JAN-08-2011), St Public Notif requested (JAN-08-2011)
Follow-up Or Routine LCR Tap M/R - In OCT-01-2010, Contaminant: Lead and Copper Rule. Follow-up actions: St Compliance achieved (AUG-04-2011)
Failure To Address Deficiency - In APR-02-2010, Contaminant: GROUNDWATER RULE. Follow-up actions: St Formal NOV issued (3 times from APR-24-2012 to APR-24-2012), St Public Notif requested (3 times from APR-24-2012 to APR-24-2013)
Failure To Address Deficiency - In APR-02-2010, Contaminant: GROUNDWATER RULE. Follow-up actions: St Formal NOV issued (3 times from APR-24-2012 to APR-24-2012), St Public Notif requested (3 times from APR-24-2012 to APR-24-2013)
One minor monitoring violation
29 regular monitoring violations
2 other older monitoring violations
Population served: 450, Groundwater):
Past monitoring violations:
One routine major monitoring violation
Serves ID, Population served: 32, Groundwater):
Past health violations:
MCL, Monthly (TCR) - In JUN-2011, Contaminant: Coliform. Follow-up actions: St Violation/Reminder Notice (AUG-01-2011), St Public Notif requested (AUG-04-2011)
MCL, Monthly (TCR) - Between APR-2010 and JUN-2010, Contaminant: Coliform. Follow-up actions: St Violation/Reminder Notice (AUG-02-2010), St Public Notif requested (AUG-05-2010)
Past monitoring violations:
One routine major monitoring violation
Population served: 0, Surface water):
Past monitoring violations:
5 regular monitoring violations
Population served: 0, Groundwater):
Past monitoring violations:
Monitoring and Reporting (DBP) - Between JUL-2013 and SEP-2013, Contaminant: TTHM. Follow-up actions: St Formal NOV issued (JAN-24-2014), St Public Notif requested (JAN-24-2014)
Monitoring and Reporting (DBP) - Between JUL-2013 and SEP-2013, Contaminant: Total Haloacetic Acids (HAA5). Follow-up actions: St Formal NOV issued (JAN-24-2014), St Public Notif requested (JAN-24-2014)
22 regular monitoring violations
Population served: 0, Surface water):
Past monitoring violations:
Monitoring and Reporting (DBP) - Between JUL-2010 and SEP-2010, Contaminant: Total Haloacetic Acids (HAA5). Follow-up actions: St Public Notif requested (DEC-04-2010), St Compliance achieved (DEC-04-2010), St Formal NOV issued (DEC-04-2010)
Monitoring and Reporting (DBP) - Between JUL-2010 and SEP-2010, Contaminant: TTHM. Follow-up actions: St Public Notif requested (DEC-04-2010), St Compliance achieved (DEC-04-2010), St Formal NOV issued (DEC-04-2010)
Drinking water stations with addresses in Layton that have no violations reported:
WANSHIP WELL WATER SYSTEM (Population served: 100, Primary Water Source Type: Groundwater)
Average household size: This city:
3.1 peopleUtah:
3.1 people
Percentage of family households: This city:
79.5%Whole state:
75.2%
Percentage of households with unmarried partners: This city:
4.2%Whole state:
4.6%
Likely homosexual households (counted as self-reported same-sex unmarried-partner households)
Lesbian couples: 0.3% of all households Gay men: 0.3% of all households
People in group quarters in Layton in 2010:
26 people in residential treatment centers for juveniles (non-correctional)
15 people in group homes intended for adults
3 people in other noninstitutional facilities
People in group quarters in Layton in 2000:
77 people in other noninstitutional group quarters
9 people in homes for the mentally retarded
7 people in other group homes
4 people in nursing homes
2 people in mental (psychiatric) hospitals or wards
Banks with most branches in Layton (2011 data):
Wells Fargo Bank, National Association: Layton Hills Branch, Fresh Market Rainbow Plaza Branch, Layton Branch, North Layton Branch. Info updated 2011/04/05: Bank assets: $1,161,490.0 mil, Deposits: $905,653.0 mil, headquarters in Sioux Falls, SD, positive income , 6395 total offices , Holding Company: Wells Fargo & Company
The First National Bank of Layton: Layton Hills Branch, The First National Bank Of Layton, Messenger Branch Service, Fairfield Branch. Info updated 2006/11/03: Bank assets: $255.2 mil, Deposits: $217.3 mil, local headquarters , positive income , Commercial Lending Specialization, 8 total offices , Holding Company: Fnb Bancorp
Cache Valley Bank: - Layton Branch at 476 West Heritage Park Boulevard, Suite 100, branch established on 2000/05/18; Layton Courier Service Branch at 1010 N Hill Field Road, branch established on 2001/09/05. Info updated 2011/11/07: Bank assets: $488.0 mil, Deposits: $426.6 mil, headquarters in Logan, UT, positive income , Commercial Lending Specialization, 7 total offices , Holding Company: Cache Valley Banking Company
JPMorgan Chase Bank, National Association: Layton Branch at 1275 North Hillfield Road, branch established on 1955/01/01; North Layton Branch at 1376 E Hwy 193, branch established on 2008/11/04. Info updated 2011/11/10: Bank assets: $1,811,678.0 mil, Deposits: $1,190,738.0 mil, headquarters in Columbus, OH, positive income , International Specialization, 5577 total offices , Holding Company: Jpmorgan Chase & Co.
Zions First National Bank: Layton Office at 166 South Fort Lane, branch established on 1988/10/05; Layton Antelope Drive Branch at 1781 West Antelope Drive, branch established on 1994/05/11. Info updated 2006/11/03: Bank assets: $17,531.3 mil, Deposits: $14,905.3 mil, headquarters in Salt Lake City, UT, positive income , Commercial Lending Specialization, 151 total offices , Holding Company: Zions Bancorporation
U.S. Bank National Association: Layton Smith's Branch at 1170 East Gentile Street, branch established on 2009/02/17; Layton Branch at 849 West Hill Field Road, branch established on 2010/10/25. Info updated 2012/01/30: Bank assets: $330,470.8 mil, Deposits: $236,091.5 mil, headquarters in Cincinnati, OH, positive income , 3121 total offices , Holding Company: U.S. Bancorp
Bank of the West: Layton Branch at 683 West Antelope Drive, branch established on 1995/06/26. Info updated 2009/11/16: Bank assets: $62,408.3 mil, Deposits: $43,995.2 mil, headquarters in San Francisco, CA, positive income , 647 total offices , Holding Company: Bnp Paribas
KeyBank National Association: Layton Hills Office Branch at 999 Northhill Field Road, branch established on 1991/06/01. Info updated 2008/03/03: Bank assets: $86,198.8 mil, Deposits: $64,214.8 mil, headquarters in Cleveland, OH, positive income , Commercial Lending Specialization, 1067 total offices , Holding Company: Keycorp
Washington Federal: Layton Branch at 1597 North Woodland Park Drive, branch established on 1995/11/06. Info updated 2011/12/19: Bank assets: $13,653.0 mil, Deposits: $8,905.8 mil, headquarters in Seattle, WA, positive income , Mortgage Lending Specialization, 174 total offices
For population 15 years and over in Layton:
Never married: 28.4%Now married: 58.8%Separated: 1.1%Widowed: 2.8%Divorced: 8.9% For population 25 years and over in Layton:
High school or higher: 96.8%Bachelor's degree or higher: 40.4%Graduate or professional degree: 15.7%Unemployed: 4.5%Mean travel time to work (commute): 18.6 minutes
Education Gini index (Inequality in education) Here:
9.1Utah average:
10.9
Religion statistics for Layton, UT (based on Davis County data)
Religion Adherents Congregations Other 230,405 556 Catholic 12,782 1 Evangelical Protestant 7,928 34 Mainline Protestant 1,135 7 Black Protestant 200 1 None 54,029 -
Source: Clifford Grammich, Kirk Hadaway, Richard Houseal, Dale E.Jones, Alexei Krindatch, Richie Stanley and Richard H.Taylor. 2012. 2010 U.S.Religion Census: Religious Congregations & Membership Study. Association of Statisticians of American Religious Bodies. Jones, Dale E., et al. 2002. Congregations and Membership in the United States 2000. Nashville, TN: Glenmary Research Center. Graphs represent county-level data
Food Environment Statistics: Number of grocery stores : 25Davis County :
0.87 / 10,000 pop.Utah :
1.37 / 10,000 pop.
Number of supercenters and club stores : 6Davis County :
0.21 / 10,000 pop.Utah :
0.18 / 10,000 pop.
Number of convenience stores (no gas) : 6This county :
0.21 / 10,000 pop.Utah :
0.41 / 10,000 pop.
Number of convenience stores (with gas) : 56Davis County :
1.95 / 10,000 pop.Utah :
2.82 / 10,000 pop.
Number of full-service restaurants : 106This county :
3.68 / 10,000 pop.Utah :
5.09 / 10,000 pop.
Adult obesity rate : Davis County :
23.4%State :
23.6%
Health and Nutrition: Healthy diet rate : This city:
49.0%Utah:
48.9%
Average overall health of teeth and gums : This city:
47.3%Utah:
47.0%
People feeling badly about themselves : People not drinking alcohol at all : Average hours sleeping at night : Overweight people : This city:
32.7%Utah:
31.9%
General health condition : Average condition of hearing : This city:
80.8%Utah:
80.1%
More about Health and Nutrition of Layton, UT Residents
Local government employment and payroll (March 2022)
Function
Full-time employees
Monthly full-time payroll
Average yearly full-time wage
Part-time employees
Monthly part-time payroll
Police Protection - Officers
79 $476,982 $72,453 0 $0 Firefighters
73 $452,996 $74,465 1 $1,634 Parks and Recreation
34 $144,500 $51,000 59 $34,496 Police - Other
34 $155,837 $55,001 32 $22,719 Streets and Highways
33 $182,568 $66,388 4 $11,654 Other Government Administration
21 $130,466 $74,552 10 $16,663 Financial Administration
20 $111,844 $67,106 0 $0 Water Supply
18 $73,698 $49,132 0 $0 Judicial and Legal
10 $64,287 $77,144 1 $1,825 Other and Unallocable
8 $35,517 $53,276 5 $4,158 Sewerage
5 $26,509 $63,622 0 $0 Housing and Community Development (Local)
2 $10,153 $60,918 0 $0 Fire - Other
2 $7,132 $42,792 3 $6,446
Totals for Government
339 $1,872,489 $66,283 115 $99,594
Layton government finances - Expenditure in 2021 (per resident):
Construction - General - Other: $8,057,000 ($97.54)
Water Utilities: $1,418,000 ($17.17)Transit Utilities: $1,068,000 ($12.93)Natural Resources - Other: $981,000 ($11.88)Sewerage: $727,000 ($8.80)Parks and Recreation: $619,000 ($7.49)Regular Highways: $134,000 ($1.62)Housing and Community Development: $118,000 ($1.43)Police Protection: $11,000 ($0.13)Current Operations - Police Protection: $20,373,000 ($246.64)
General - Other: $12,736,000 ($154.19)Sewerage: $10,424,000 ($126.20)Parks and Recreation: $8,344,000 ($101.02)Local Fire Protection: $8,166,000 ($98.86)Health - Other: $6,502,000 ($78.72)Regular Highways: $5,684,000 ($68.81)Housing and Community Development: $5,317,000 ($64.37)Water Utilities: $5,265,000 ($63.74)Solid Waste Management: $4,555,000 ($55.14)Central Staff Services: $3,006,000 ($36.39)Judicial and Legal Services: $2,076,000 ($25.13)Natural Resources - Other: $1,673,000 ($20.25)Financial Administration: $1,054,000 ($12.76)General Public Buildings: $899,000 ($10.88)General - Interest on Debt: $100,000 ($1.21)
Intergovernmental to Local - Other - Water Utilities: $2,128,000 ($25.76)
Other - Housing and Community Development: $25,000 ($0.30)Intergovernmental to State - General - Other: $94,000 ($1.14)
Other Capital Outlay - Water Utilities: $540,000 ($6.54)
Police Protection: $474,000 ($5.74)Natural Resources - Other: $457,000 ($5.53)Health - Other: $426,000 ($5.16)General - Other: $407,000 ($4.93)Parks and Recreation: $201,000 ($2.43)Financial Administration: $107,000 ($1.30)Regular Highways: $81,000 ($0.98)Local Fire Protection: $55,000 ($0.67)Central Staff Services: $40,000 ($0.48)Housing and Community Development: $27,000 ($0.33)General Public Building: $3,000 ($0.04)Total Salaries and Wages: $46,686,000 ($565.20)
Layton government finances - Revenue in 2021 (per resident):
Charges - Sewerage: $12,009,000 ($145.39)
Other: $11,675,000 ($141.34)Solid Waste Management: $4,621,000 ($55.94)Parks and Recreation: $1,484,000 ($17.97)Federal Intergovernmental - Other: $12,119,000 ($146.72)
Transit Utilities: $1,297,000 ($15.70)Housing and Community Development: $396,000 ($4.79)Natural Resources: $265,000 ($3.21)General Local Government Support: $14,000 ($0.17)Local Intergovernmental - Housing and Community Development: $1,756,000 ($21.26)
General Local Government Support: $1,731,000 ($20.96)Other: $130,000 ($1.57)Miscellaneous - General Revenue - Other: $2,327,000 ($28.17)
Rents: $1,136,000 ($13.75)Interest Earnings: $790,000 ($9.56)Fines and Forfeits: $359,000 ($4.35)Sale of Property: $125,000 ($1.51)Revenue - Water Utilities: $16,120,000 ($195.16)
State Intergovernmental - Highways: $1,543,000 ($18.68)
Other: $303,000 ($3.67)Tax - General Sales and Gross Receipts: $20,029,000 ($242.48)
Property: $13,131,000 ($158.97)Public Utilities Sales: $4,652,000 ($56.32)Other License: $2,087,000 ($25.27)Occupation and Business License - Other: $311,000 ($3.77)Other Selective Sales: $185,000 ($2.24)
Layton government finances - Debt in 2021 (per resident):
Long Term Debt - Beginning Outstanding - Unspecified Public Purpose: $2,497,000 ($30.23)
Outstanding Unspecified Public Purpose: $1,477,000 ($17.88)Retired Unspecified Public Purpose: $1,020,000 ($12.35)
Layton government finances - Cash and Securities in 2021 (per resident):
Bond Funds - Cash and Securities: $14,158,000 ($171.40)
Other Funds - Cash and Securities: $78,399,000 ($949.13)
Sinking Funds - Cash and Securities: $1,059,000 ($12.82)
9.07% of this county's 2021 resident taxpayers lived in other counties in 2020 ($67,737 average adjusted gross income )
Here:
9.07%Utah average:
7.95%
0.10% of residents moved from foreign countries ($694 average AGI )Davis County:
0.10%Utah average:
0.02%
Top counties from which taxpayers relocated into this county between 2020 and 2021:
8.88% of this county's 2020 resident taxpayers moved to other counties in 2021 ($65,750 average adjusted gross income )
Here:
8.88%Utah average:
7.39%
0.08% of residents moved to foreign countries ($598 average AGI )Davis County:
0.08%Utah average:
0.02%
Top counties to which taxpayers relocated from this county between 2020 and 2021:
Businesses in Layton, UT
Name Count Name Count
7-Eleven 2 Kohl's 1 AT&T 5 Kroger 1 Ace Hardware 1 La Quinta 1 Aeropostale 1 Lane Bryant 1 American Eagle Outfitters 1 Little Caesars Pizza 1 Applebee's 1 Lowe's 1 Arby's 2 Macy's 2 Ashley Furniture 1 Marriott 3 Audi 1 MasterBrand Cabinets 5 AutoZone 1 Maurices 1 Barnes & Noble 1 McDonald's 4 Baskin-Robbins 1 Men's Wearhouse 1 Bath & Body Works 1 Motherhood Maternity 2 Bed Bath & Beyond 1 New Balance 1 Big O Tires 2 New York & Co 1 Blockbuster 2 Nike 15 Burger King 2 Office Depot 1 Carl\s Jr. 1 OfficeMax 1 Charlotte Russe 1 Old Navy 1 Chevrolet 1 Olive Garden 1 Chick-Fil-A 1 Outback 1 Chuck E. Cheese's 1 Outback Steakhouse 1 Cold Stone Creamery 1 Pac Sun 1 Comfort Inn 1 Panda Express 1 Cracker Barrel 1 Papa John's Pizza 1 Cricket Wireless 2 Payless 2 Curves 1 Penske 1 DHL 1 PetSmart 1 Dairy Queen 3 Pizza Hut 1 Dennys 1 Plato's Closet 1 Discount Tire 2 Quiznos 1 Domino's Pizza 1 RadioShack 2 Dressbarn 1 Red Lobster 1 Famous Footwear 2 Red Robin 1 FedEx 9 Rite Aid 1 Foot Locker 1 SONIC Drive-In 1 Ford 1 Sam's Club 1 GNC 1 Spencer Gifts 1 GameStop 2 Sprint Nextel 3 Gymboree 1 Staples 1 H&R Block 2 Starbucks 2 Hilton 2 T-Mobile 3 Hobby Lobby 1 Taco Bell 1 Holiday Inn 1 Target 1 Hollister Co. 1 Toys"R"Us 1 Home Depot 1 U-Haul 3 Hot Topic 1 UPS 7 IHOP 1 Vans 3 JCPenney 1 Verizon Wireless 2 Jamba Juice 1 Victoria's Secret 1 Jimmy John's 1 Volkswagen 1 Jones New York 1 Walgreens 1 Journeys 1 Walmart 2 Justice 1 Wendy's 2 KFC 1 Wet Seal 1 Kmart 1
Strongest AM radio stations in Layton:
KALL (700 AM; 50 kW; NORTH SALT LAKE CITY, UT; Owner: CITICASTERS LICENSES, L.P.)
KLO (1430 AM; 10 kW; OGDEN, UT; Owner: KLO BROADCASTING CO.)
KANN (1120 AM; 10 kW; ROY, UT; Owner: FAITH COMMUNICATIONS CORPORATION)
KIQN (1010 AM; 50 kW; TOOELE, UT)
KSL (1160 AM; 50 kW; SALT LAKE CITY, UT; Owner: BONNEVILLE HOLDING COMPANY)
KZNS (1280 AM; 10 kW; SALT LAKE CITY, UT; Owner: SIMMONS-SLC, LS, LLC)
KNRS (570 AM; 5 kW; SALT LAKE CITY, UT; Owner: CITICASTERS LICENSES, L.P.)
KSGO (1600 AM; 5 kW; CENTERVILLE, UT; Owner: UTAH SPANISH RADIO CORP)
KTKK (630 AM; 10 kW; SANDY, UT; Owner: UNITED BROADCASTING COMPANY)
KXOL (1660 AM; 10 kW; BRIGHAM CITY, UT; Owner: SIMMONS-SLC, LS, LLC)
KBEE (860 AM; 10 kW; SALT LAKE CITY, UT; Owner: CITADEL BROADCASTING COMPANY)
KSOS (800 AM; 10 kW; BRIGHAM CITY, UT; Owner: SIMMONS-SLC, LS, LLC)
KSVN (730 AM; 1 kW; OGDEN, UT; Owner: AZTECA BROADCASTING CORPORATION)
Strongest FM radio stations in Layton:
KCPX (105.7 FM; CENTERVILLE, UT; Owner: MERCURY BROADCASTING COMPANY, INC.)
KYFO-FM (95.5 FM; OGDEN, UT; Owner: BIBLE BROADCASTING NETWORK, INC.)
KSOP-FM (104.3 FM; SALT LAKE CITY, UT; Owner: KSOP, INC.)
K272DP (102.3 FM; TOOELE, UT; Owner: FAMILY STATIONS, INC.)
KBZN (97.9 FM; OGDEN, UT; Owner: CAPITOL BROADCASTING, INC.)
KRCL (90.9 FM; SALT LAKE CITY, UT; Owner: LISTENERS COMMUNITY RADIO OF UTAH)
KBER (101.1 FM; OGDEN, UT; Owner: CITADEL BROADCASTING COMPANY)
KISN-FM (97.1 FM; SALT LAKE CITY, UT; Owner: CLEAR CHANNEL BROADCASTING LICENSES, INC.)
KKAT (101.9 FM; OGDEN, UT; Owner: CITICASTERS LICENSES, L.P.)
KSFI (100.3 FM; SALT LAKE CITY, UT; Owner: SIMMONS-SLC, LS, LLC)
KUBL-FM (93.3 FM; SALT LAKE CITY, UT; Owner: CITADEL BROADCASTING COMPANY)
KOSY-FM (106.5 FM; SPANISH FORK, UT; Owner: MERCURY BROADCASTING COMPANY, INC.)
KRSP-FM (103.5 FM; SALT LAKE CITY, UT; Owner: SIMMONS-SLC, LS, LLC)
KBZN-FM1 (97.9 FM; PARK CITY, UT; Owner: CAPITOL BROADCASTING INC.)
K201AE (88.1 FM; COALVILLE, ETC., UT; Owner: COMMUNITY WIRELESS OF PARK CITY, INC)
KZHT-FM1 (94.9 FM; PARK CITY, UT; Owner: CITICASTERS LICENSES, L.P.)
KUDD (107.9 FM; ROY, UT; Owner: MILLCREEK BROADCASTING, L.L.C.)
KODJ (94.1 FM; SALT LAKE CITY, UT; Owner: CITICASTERS LICENSES, L.P.)
KCUA (92.5 FM; COALVILLE, UT; Owner: COMMUNITY WIRELESS OF PARK CITY, INC)
KUER-FM (90.1 FM; SALT LAKE CITY, UT; Owner: UNIVERSITY OF UTAH)
TV broadcast stations around Layton:
KULX-CA (Channel 51; OGDEN, UT; Owner: AIRWAVES, INC.)
KSVN-CA (Channel 49; OGDEN, UT; Owner: AZTECA BROADCASTING CORPORATION)
KUTV (Channel 2; SALT LAKE CITY, UT; Owner: KUTV HOLDINGS, INC.)
K59BV (Channel 59; LAVA HOT SPRINGS, ID; Owner: STATE BOARD OF EDUCATION (IEPBS))
K56GR (Channel 56; OGDEN, UT; Owner: TRINITY BROADCASTING NETWORK)
K59GS (Channel 59; SALT LAKE CITY, UT; Owner: ALPHA & OMEGA COMMUNICATIONS, LLC)
KPNZ (Channel 24; OGDEN, UT; Owner: UTAH COMMUNICATIONS, LLC)
K58FT (Channel 58; HUNTSVILLE, UT; Owner: ALPHA & OMEGA COMMUNICATIONS, L.L.C.)
National Bridge Inventory (NBI) Statistics 16 Number of bridges207ft / 63.1m Total length1,010,046 Total average daily traffic161,473 Total average daily truck traffic
New bridges - historical statistics
4 1960-1969 2 1990-1999 8 2010-2019 2 2020-2022
See full National Bridge Inventory statistics for Layton, UT
Home Mortgage Disclosure Act Aggregated Statistics For Year 2009(Based on 4 full and 7 partial tracts) A) FHA, FSA/RHS & VA B) Conventional C) Refinancings D) Home Improvement Loans E) Loans on Dwellings For 5+ Families F) Non-occupant Loans on G) Loans On Manufactured Number Average Value Number Average Value Number Average Value Number Average Value Number Average Value Number Average Value Number Average Value
LOANS ORIGINATED 464 $194,856 235 $192,326 2,327 $182,445 75 $68,364 2 $1,803,845 67 $144,959 8 $50,740 APPLICATIONS APPROVED, NOT ACCEPTED 22 $157,470 13 $214,205 244 $193,636 14 $67,792 0 $0 2 $82,510 4 $47,265 APPLICATIONS DENIED 45 $179,062 46 $177,180 536 $195,262 37 $50,054 1 $1,802,640 29 $169,224 16 $35,582 APPLICATIONS WITHDRAWN 47 $185,880 29 $166,390 351 $192,507 14 $96,431 1 $3,605,280 11 $162,196 4 $60,468 FILES CLOSED FOR INCOMPLETENESS 7 $177,926 3 $143,417 94 $187,218 11 $57,775 0 $0 5 $151,334 1 $8,380
Aggregated Statistics For Year 2008(Based on 4 full and 7 partial tracts) A) FHA, FSA/RHS & VA B) Conventional C) Refinancings D) Home Improvement Loans E) Loans on Dwellings For 5+ Families F) Non-occupant Loans on G) Loans On Manufactured Number Average Value Number Average Value Number Average Value Number Average Value Number Average Value Number Average Value Number Average Value
LOANS ORIGINATED 345 $189,757 371 $191,563 1,369 $177,900 101 $68,722 1 $3,807,500 95 $148,958 13 $36,855 APPLICATIONS APPROVED, NOT ACCEPTED 16 $211,338 46 $230,382 189 $179,245 42 $79,880 0 $0 19 $182,867 5 $60,766 APPLICATIONS DENIED 38 $189,826 85 $179,196 532 $194,226 94 $69,208 3 $701,767 50 $182,778 23 $34,997 APPLICATIONS WITHDRAWN 39 $186,176 49 $190,404 256 $181,759 27 $124,168 0 $0 27 $150,469 2 $30,460 FILES CLOSED FOR INCOMPLETENESS 2 $301,350 8 $144,581 42 $181,038 8 $99,550 0 $0 3 $139,193 0 $0
Aggregated Statistics For Year 2007(Based on 4 full and 7 partial tracts) A) FHA, FSA/RHS & VA B) Conventional C) Refinancings D) Home Improvement Loans E) Loans on Dwellings For 5+ Families F) Non-occupant Loans on G) Loans On Manufactured Number Average Value Number Average Value Number Average Value Number Average Value Number Average Value Number Average Value Number Average Value
LOANS ORIGINATED 219 $179,167 1,142 $174,000 1,490 $156,499 198 $68,824 2 $6,186,845 221 $161,162 14 $38,122 APPLICATIONS APPROVED, NOT ACCEPTED 4 $276,385 130 $173,882 229 $149,669 37 $62,578 0 $0 32 $140,807 6 $42,987 APPLICATIONS DENIED 21 $183,560 285 $180,135 688 $164,945 132 $64,831 0 $0 100 $193,779 27 $42,140 APPLICATIONS WITHDRAWN 18 $164,735 103 $163,618 266 $163,632 29 $101,801 0 $0 28 $158,531 0 $0 FILES CLOSED FOR INCOMPLETENESS 1 $327,180 26 $208,082 58 $173,154 6 $59,997 0 $0 9 $164,712 0 $0
Aggregated Statistics For Year 2006(Based on 4 full and 7 partial tracts) A) FHA, FSA/RHS & VA B) Conventional C) Refinancings D) Home Improvement Loans E) Loans on Dwellings For 5+ Families F) Non-occupant Loans on G) Loans On Manufactured Number Average Value Number Average Value Number Average Value Number Average Value Number Average Value Number Average Value Number Average Value
LOANS ORIGINATED 225 $175,700 1,771 $128,256 1,395 $130,523 188 $48,561 4 $1,927,062 387 $126,261 7 $326,079 APPLICATIONS APPROVED, NOT ACCEPTED 10 $160,898 165 $121,488 244 $135,619 41 $45,902 0 $0 36 $139,568 6 $31,717 APPLICATIONS DENIED 18 $150,400 377 $133,911 658 $138,720 142 $43,397 1 $1,520 103 $155,811 23 $65,715 APPLICATIONS WITHDRAWN 25 $160,934 244 $122,682 414 $139,966 21 $81,675 0 $0 57 $133,928 0 $0 FILES CLOSED FOR INCOMPLETENESS 2 $90,700 43 $123,720 109 $153,337 4 $92,030 0 $0 8 $138,939 0 $0
Aggregated Statistics For Year 2005(Based on 4 full and 7 partial tracts) A) FHA, FSA/RHS & VA B) Conventional C) Refinancings D) Home Improvement Loans E) Loans on Dwellings For 5+ Families F) Non-occupant Loans on G) Loans On Manufactured Number Average Value Number Average Value Number Average Value Number Average Value Number Average Value Number Average Value Number Average Value
LOANS ORIGINATED 250 $145,954 1,637 $113,365 1,307 $123,722 117 $55,516 4 $831,385 269 $108,077 11 $34,910 APPLICATIONS APPROVED, NOT ACCEPTED 5 $146,472 163 $107,925 246 $113,126 24 $44,356 0 $0 32 $101,741 9 $48,162 APPLICATIONS DENIED 28 $134,809 352 $97,077 697 $127,944 109 $42,927 1 $9,740 71 $104,664 33 $44,556 APPLICATIONS WITHDRAWN 22 $134,686 339 $112,350 453 $131,201 42 $143,625 0 $0 44 $125,412 4 $110,548 FILES CLOSED FOR INCOMPLETENESS 2 $194,655 58 $98,751 203 $150,864 7 $51,954 0 $0 10 $113,985 0 $0
Aggregated Statistics For Year 2004(Based on 4 full and 7 partial tracts) A) FHA, FSA/RHS & VA B) Conventional C) Refinancings D) Home Improvement Loans E) Loans on Dwellings For 5+ Families F) Non-occupant Loans on G) Loans On Manufactured Number Average Value Number Average Value Number Average Value Number Average Value Number Average Value Number Average Value Number Average Value
LOANS ORIGINATED 299 $132,808 1,061 $113,553 1,555 $130,375 104 $36,485 5 $2,859,228 191 $109,995 11 $40,201 APPLICATIONS APPROVED, NOT ACCEPTED 10 $142,133 161 $111,655 259 $118,061 20 $34,428 0 $0 31 $97,577 12 $48,833 APPLICATIONS DENIED 30 $123,863 264 $104,975 674 $126,128 86 $39,092 1 $1,911,720 61 $102,611 22 $31,191 APPLICATIONS WITHDRAWN 26 $126,140 136 $119,297 453 $133,486 17 $71,974 0 $0 29 $114,626 1 $125,000 FILES CLOSED FOR INCOMPLETENESS 4 $113,690 34 $100,677 146 $140,834 4 $24,822 0 $0 2 $102,000 1 $47,300
Aggregated Statistics For Year 2003(Based on 4 full and 7 partial tracts) A) FHA, FSA/RHS & VA B) Conventional C) Refinancings D) Home Improvement Loans E) Loans on Dwellings For 5+ Families F) Non-occupant Loans on Number Average Value Number Average Value Number Average Value Number Average Value Number Average Value Number Average Value
LOANS ORIGINATED 419 $135,826 815 $126,883 3,743 $128,747 82 $24,372 3 $643,940 197 $111,107 APPLICATIONS APPROVED, NOT ACCEPTED 9 $144,534 85 $124,173 405 $129,084 18 $28,091 0 $0 23 $144,137 APPLICATIONS DENIED 27 $134,467 155 $113,628 680 $128,293 58 $28,262 0 $0 40 $129,288 APPLICATIONS WITHDRAWN 23 $129,237 87 $124,256 483 $138,514 7 $20,046 0 $0 30 $106,102 FILES CLOSED FOR INCOMPLETENESS 3 $105,020 39 $124,705 102 $143,790 5 $27,852 0 $0 13 $136,513
Aggregated Statistics For Year 2002(Based on 2 full and 2 partial tracts) A) FHA, FSA/RHS & VA B) Conventional C) Refinancings D) Home Improvement Loans E) Loans on Dwellings For 5+ Families F) Non-occupant Loans on Number Average Value Number Average Value Number Average Value Number Average Value Number Average Value Number Average Value
LOANS ORIGINATED 153 $130,343 298 $126,701 1,264 $130,566 46 $26,233 2 $1,006,095 60 $98,993 APPLICATIONS APPROVED, NOT ACCEPTED 3 $135,913 46 $132,975 140 $127,688 12 $16,227 1 $487,200 16 $139,244 APPLICATIONS DENIED 11 $119,557 79 $110,470 285 $121,732 24 $16,598 0 $0 17 $134,812 APPLICATIONS WITHDRAWN 13 $129,945 42 $131,450 342 $139,120 7 $57,286 0 $0 6 $111,283 FILES CLOSED FOR INCOMPLETENESS 8 $139,046 16 $98,521 70 $156,565 2 $49,040 0 $0 6 $94,977
Aggregated Statistics For Year 2001(Based on 2 full and 2 partial tracts) A) FHA, FSA/RHS & VA B) Conventional C) Refinancings D) Home Improvement Loans F) Non-occupant Loans on Number Average Value Number Average Value Number Average Value Number Average Value Number Average Value
LOANS ORIGINATED 170 $125,550 259 $135,486 1,107 $125,111 66 $20,990 61 $112,599 APPLICATIONS APPROVED, NOT ACCEPTED 7 $114,004 31 $99,448 111 $117,124 11 $23,043 4 $113,452 APPLICATIONS DENIED 12 $118,401 92 $90,093 305 $116,794 23 $20,739 14 $118,230 APPLICATIONS WITHDRAWN 10 $127,861 27 $105,482 225 $132,508 7 $26,344 9 $140,899 FILES CLOSED FOR INCOMPLETENESS 3 $122,990 17 $122,755 75 $131,039 0 $0 4 $136,000
Aggregated Statistics For Year 2000(Based on 2 full and 2 partial tracts) A) FHA, FSA/RHS & VA B) Conventional C) Refinancings D) Home Improvement Loans E) Loans on Dwellings For 5+ Families F) Non-occupant Loans on Number Average Value Number Average Value Number Average Value Number Average Value Number Average Value Number Average Value
LOANS ORIGINATED 144 $124,248 321 $122,676 340 $109,435 82 $19,729 0 $0 32 $128,887 APPLICATIONS APPROVED, NOT ACCEPTED 4 $131,090 52 $73,963 99 $109,170 21 $30,288 0 $0 7 $125,497 APPLICATIONS DENIED 12 $116,427 135 $68,043 225 $93,580 57 $27,444 2 $569,840 16 $142,629 APPLICATIONS WITHDRAWN 11 $110,068 40 $126,964 121 $110,867 6 $30,740 0 $0 1 $158,170 FILES CLOSED FOR INCOMPLETENESS 3 $99,810 13 $107,766 83 $124,774 1 $14,000 0 $0 2 $178,850
Aggregated Statistics For Year 1999(Based on 2 full and 6 partial tracts) A) FHA, FSA/RHS & VA B) Conventional C) Refinancings D) Home Improvement Loans E) Loans on Dwellings For 5+ Families F) Non-occupant Loans on Number Average Value Number Average Value Number Average Value Number Average Value Number Average Value Number Average Value
LOANS ORIGINATED 356 $124,331 631 $127,494 1,294 $99,920 132 $18,635 4 $232,368 87 $97,176 APPLICATIONS APPROVED, NOT ACCEPTED 11 $112,547 105 $96,733 252 $103,361 34 $20,707 0 $0 8 $104,928 APPLICATIONS DENIED 30 $121,018 307 $82,543 466 $96,507 64 $19,909 0 $0 24 $99,049 APPLICATIONS WITHDRAWN 26 $128,273 102 $132,503 340 $115,066 26 $81,174 0 $0 20 $127,138 FILES CLOSED FOR INCOMPLETENESS 12 $127,901 22 $135,496 173 $113,038 4 $32,328 0 $0 5 $92,258
Detailed mortgage data for all 10 tracts in Layton, UT
Private Mortgage Insurance Companies Aggregated Statistics For Year 2009(Based on 4 full and 7 partial tracts) A) Conventional B) Refinancings C) Non-occupant Loans on Number Average Value Number Average Value Number Average Value
LOANS ORIGINATED 65 $219,398 124 $214,038 2 $165,575 APPLICATIONS APPROVED, NOT ACCEPTED 21 $232,147 58 $223,711 0 $0 APPLICATIONS DENIED 12 $212,262 20 $215,434 0 $0 APPLICATIONS WITHDRAWN 7 $227,551 23 $203,921 0 $0 FILES CLOSED FOR INCOMPLETENESS 0 $0 2 $216,950 0 $0
Aggregated Statistics For Year 2008(Based on 4 full and 7 partial tracts) A) Conventional B) Refinancings C) Non-occupant Loans on Number Average Value Number Average Value Number Average Value
LOANS ORIGINATED 174 $220,984 150 $215,289 19 $174,175 APPLICATIONS APPROVED, NOT ACCEPTED 63 $223,506 62 $241,758 8 $151,886 APPLICATIONS DENIED 6 $210,193 11 $211,023 8 $161,120 APPLICATIONS WITHDRAWN 6 $273,492 7 $189,229 3 $179,360 FILES CLOSED FOR INCOMPLETENESS 10 $240,158 0 $0 4 $192,445
Aggregated Statistics For Year 2007(Based on 4 full and 7 partial tracts) A) Conventional B) Refinancings C) Non-occupant Loans on Number Average Value Number Average Value Number Average Value
LOANS ORIGINATED 346 $197,442 147 $211,282 48 $173,234 APPLICATIONS APPROVED, NOT ACCEPTED 42 $181,593 31 $267,422 6 $147,205 APPLICATIONS DENIED 7 $176,803 1 $298,410 1 $149,000 APPLICATIONS WITHDRAWN 13 $203,855 12 $284,975 3 $159,443 FILES CLOSED FOR INCOMPLETENESS 0 $0 0 $0 0 $0
Aggregated Statistics For Year 2006(Based on 4 full and 7 partial tracts) A) Conventional B) Refinancings C) Non-occupant Loans on Number Average Value Number Average Value Number Average Value
LOANS ORIGINATED 176 $168,743 90 $172,706 23 $164,637 APPLICATIONS APPROVED, NOT ACCEPTED 18 $168,182 20 $193,338 3 $157,260 APPLICATIONS DENIED 3 $167,420 0 $0 0 $0 APPLICATIONS WITHDRAWN 6 $160,155 9 $187,956 2 $236,820 FILES CLOSED FOR INCOMPLETENESS 1 $216,000 0 $0 1 $216,000
Aggregated Statistics For Year 2005(Based on 4 full and 7 partial tracts) A) Conventional B) Refinancings C) Non-occupant Loans on Number Average Value Number Average Value Number Average Value
LOANS ORIGINATED 147 $160,042 111 $166,924 20 $150,257 APPLICATIONS APPROVED, NOT ACCEPTED 17 $199,169 22 $166,972 4 $120,690 APPLICATIONS DENIED 2 $108,735 3 $174,803 0 $0 APPLICATIONS WITHDRAWN 6 $233,513 7 $275,073 1 $90,000 FILES CLOSED FOR INCOMPLETENESS 2 $114,825 0 $0 0 $0
Aggregated Statistics For Year 2004(Based on 4 full and 7 partial tracts) A) Conventional B) Refinancings C) Non-occupant Loans on Number Average Value Number Average Value Number Average Value
LOANS ORIGINATED 151 $146,215 172 $154,007 19 $109,407 APPLICATIONS APPROVED, NOT ACCEPTED 22 $165,414 41 $165,869 5 $134,492 APPLICATIONS DENIED 6 $141,523 5 $132,472 2 $124,460 APPLICATIONS WITHDRAWN 13 $145,753 22 $180,424 3 $82,243 FILES CLOSED FOR INCOMPLETENESS 1 $125,830 1 $104,500 1 $125,830
Aggregated Statistics For Year 2003(Based on 4 full and 7 partial tracts) A) Conventional B) Refinancings C) Non-occupant Loans on Number Average Value Number Average Value Number Average Value
LOANS ORIGINATED 208 $153,055 495 $150,106 34 $125,899 APPLICATIONS APPROVED, NOT ACCEPTED 28 $151,295 126 $155,024 11 $127,154 APPLICATIONS DENIED 4 $142,345 6 $139,237 1 $168,630 APPLICATIONS WITHDRAWN 2 $210,560 28 $154,194 2 $158,630 FILES CLOSED FOR INCOMPLETENESS 0 $0 0 $0 0 $0
Aggregated Statistics For Year 2002(Based on 2 full and 2 partial tracts) A) Conventional B) Refinancings C) Non-occupant Loans on Number Average Value Number Average Value Number Average Value
LOANS ORIGINATED 76 $154,062 152 $153,187 8 $96,122 APPLICATIONS APPROVED, NOT ACCEPTED 16 $147,108 33 $169,883 2 $165,715 APPLICATIONS DENIED 3 $140,950 4 $166,520 0 $0 APPLICATIONS WITHDRAWN 3 $203,867 11 $121,948 1 $215,820 FILES CLOSED FOR INCOMPLETENESS 3 $142,263 1 $110,130 0 $0
Aggregated Statistics For Year 2001(Based on 2 full and 2 partial tracts) A) Conventional B) Refinancings C) Non-occupant Loans on Number Average Value Number Average Value Number Average Value
LOANS ORIGINATED 80 $158,078 155 $152,782 5 $127,160 APPLICATIONS APPROVED, NOT ACCEPTED 15 $142,061 26 $146,555 3 $92,940 APPLICATIONS DENIED 3 $174,923 8 $124,509 1 $120,830 APPLICATIONS WITHDRAWN 2 $127,100 8 $205,599 1 $272,000 FILES CLOSED FOR INCOMPLETENESS 0 $0 1 $115,950 0 $0
Aggregated Statistics For Year 2000(Based on 2 full and 2 partial tracts) A) Conventional B) Refinancings C) Non-occupant Loans on Number Average Value Number Average Value Number Average Value
LOANS ORIGINATED 98 $155,656 54 $144,924 8 $174,779 APPLICATIONS APPROVED, NOT ACCEPTED 17 $176,704 14 $139,074 4 $170,808 APPLICATIONS DENIED 1 $99,780 3 $113,520 0 $0 APPLICATIONS WITHDRAWN 4 $118,995 2 $154,925 0 $0 FILES CLOSED FOR INCOMPLETENESS 1 $108,650 0 $0 0 $0
Aggregated Statistics For Year 1999(Based on 2 full and 6 partial tracts) A) Conventional B) Refinancings C) Non-occupant Loans on Number Average Value Number Average Value Number Average Value
LOANS ORIGINATED 303 $147,067 180 $131,981 12 $110,914 APPLICATIONS APPROVED, NOT ACCEPTED 13 $136,828 38 $137,749 2 $87,725 APPLICATIONS DENIED 17 $141,232 19 $131,211 0 $0 APPLICATIONS WITHDRAWN 7 $112,727 10 $143,132 0 $0 FILES CLOSED FOR INCOMPLETENESS 2 $100,460 6 $159,007 1 $128,000
Fire-safe hotels and motels in Layton, Utah:
La Quinta Inn #686, 1965 N 1200 W, Layton, Utah 84041 Phone: (801) 776-6700, Fax: (801) 776-2677
Comfort Inn, 877 N 400 W, Layton, Utah 84041 Phone: (801) 544-5577, Fax: (801) 544-7377
Hampton Inn, 1700 Woodland Park Dr, Layton, Utah 84041 Phone: (801) 775-8800
Towneplace Suites Layton, 1743 Woodland Park Blvd, Layton, Utah 84041 Phone: (801) 779-2422, Fax: (801) 779-2522
Courtyard By Marriott, 1803 Woodland Park Dr, Layton, Utah 84041 Phone: (844) 264-7869, Fax: (801) 217-2301
Hilton Garden Inn Layton, 762 W Heritage Park Blvd, Layton, Utah 84041 Phone: (801) 416-8899, Fax: (801) 416-8877
Home2 Suites Layton, Utah, 803 W Heritage Park Blvd, Layton, Utah 84041 Phone: (801) 820-9222, Fax: (801) 820-9220
Best Western Plus Layton Park Hotel, 798 W 1425 N, Layton, Utah 84041 Phone: (801) 896-0271, Fax: (801) 896-0398
All 8 fire-safe hotels and motels in Layton, Utah
Most common first names in Layton, UT among deceased individuals Name Count Lived (average)
Mary 79 79.0 years Robert 78 70.3 years John 75 73.1 years William 70 69.6 years James 70 72.1 years George 46 74.1 years Dorothy 45 80.9 years Charles 43 70.8 years Ruth 39 77.1 years Helen 38 81.6 years
Most common last names in Layton, UT among deceased individuals Last name Count Lived (average)
Adams 52 78.0 years Smith 45 72.1 years Johnson 34 75.0 years Jones 33 70.5 years Martinez 29 77.0 years Christensen 27 71.3 years Taylor 27 75.9 years Williams 26 70.4 years Green 24 81.5 years Davis 23 71.1 years
Layton compared to Utah state average:
Unemployed percentage below state average. Percentage of population with a bachelor's degree or higher above state average.
#12 on the list of "Top 101 cities with the most cars per house, population 50,000+"
#12 on the list of "Top 101 cities with the lowest number of robberies per 100,000 residents (population 50,000+)"
#19 on the list of "Top 101 cities with the smallest percentage of high school students in private schools (3,000+ students)"
#32 on the list of "Top 100 cities with biggest houses (pop. 50,000+)"
#39 on the list of "Top 101 cities with largest percentage of males in industries: public administration (population 50,000+)"
#41 on the list of "Top 100 highest located cities (pop. 50,000+)"
#42 on the list of "Top 101 cities with largest percentage of females in industries: transportation and warehousing (population 50,000+)"
#47 on the list of "Top 101 cities with largest percentage of females in industries: public administration (population 50,000+)"
#48 on the list of "Top 101 cities with the highest ratio of rapes to murders between 2002 and 2012 (population 50,000+)"
#58 on the list of "Top 101 cities with the lowest minimum monthly morning or afternoon humidity (population 50,000+)"
#62 on the list of "Top 101 cities with largest percentage of workers with very short commute times (9 minutes or less) (population 50,000+)"
#64 on the list of "Top 101 cities with the lowest average wind speeds (population 50,000+)"
#72 on the list of "Top 101 cities with the smallest percentage of unmarried partner households (population 50,000+)"
#72 on the list of "Top 100 cities with highest median household income and median resident age less than 35 (pop. 50,000+)"
#72 on the list of "Top 100 high-educated but low-earning cities (pop. 50,000+)"
#73 on the list of "Top 101 cities with largest percentage of males in occupations: life, physical, and social science occupations (population 50,000+)"
#77 on the list of "Top 101 cities with the lowest average humidity (population 50,000+)"
#79 on the list of "Top 101 cities with largest percentage of females in occupations: carpenters (population 50,000+)"
#79 on the list of "Top 101 cities with largest percentage of females in occupations: construction trades workers except carpenters, electricians, painters, plumbers, and construction laborers (population 50,000+)"
#79 on the list of "Top 101 cities with largest percentage of females in occupations: motor vehicle operators except bus and truck drivers (population 50,000+)"
#55 (84040) on the list of "Top 101 zip codes with the largest percentage of Danish first ancestries (pop 5,000+)"
#73 (84040) on the list of "Top 101 zip codes with the largest charity contributions deductions as a percentage of AGI in 2012 (pop 5,000+)"
#2 on the list of "Top 101 counties with the lowest percentage of residents that smoked 100+ cigarettes in their lives"
#5 on the list of "Top 101 counties with the most Other congregations"
#7 on the list of "Top 101 counties with the highest number of births per 1000 residents 2007-2013"
#7 on the list of "Top 101 counties with the most Other adherents"
#12 on the list of "Top 101 counties with highest percentage of residents voting for Romney (Republican) in the 2012 Presidential Election (pop. 50,000+)"
Top Patent Applicants
Jason R. Stats (38)
Yiping Ma (32)
David C. Winter (26)
S. Ray Isaacson (11)
Kent Beck (10)
Lynn Vandyke (9)
Robert Lowe (8)
Kent F. Beck (8)
Piotr Czernichowski (7)
Chad Lewis (7)
Total of 466 patent applications in 2008-2024.
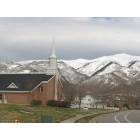

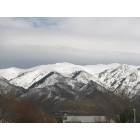
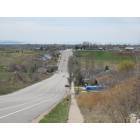
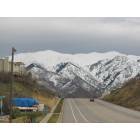
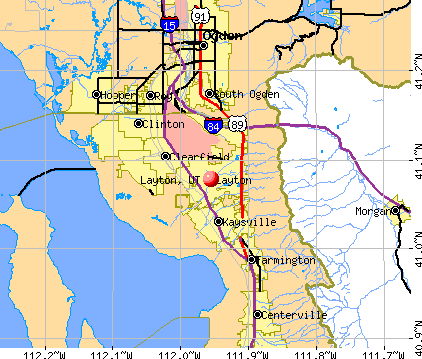


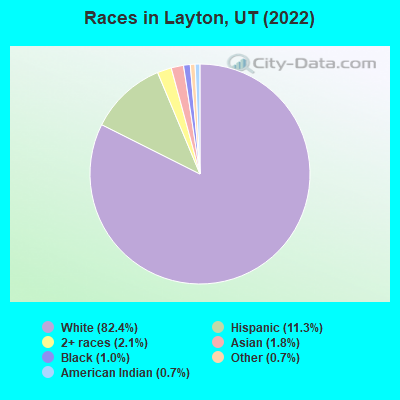
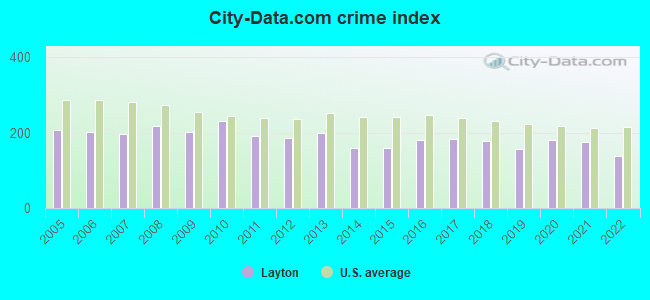
 Recent articles from our blog. Our writers, many of them Ph.D. graduates or candidates, create easy-to-read articles on a wide variety of topics.

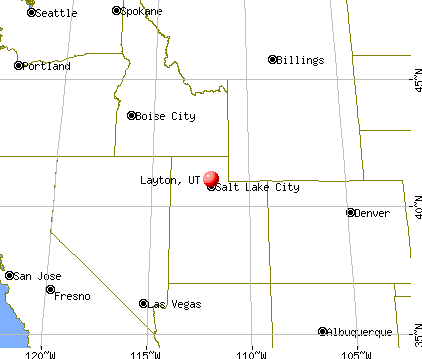
 , pop. 450,166).
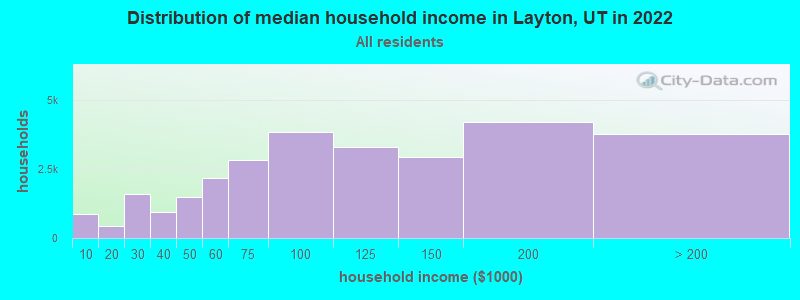
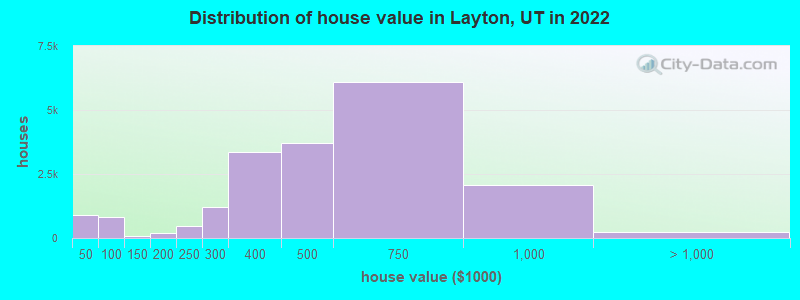

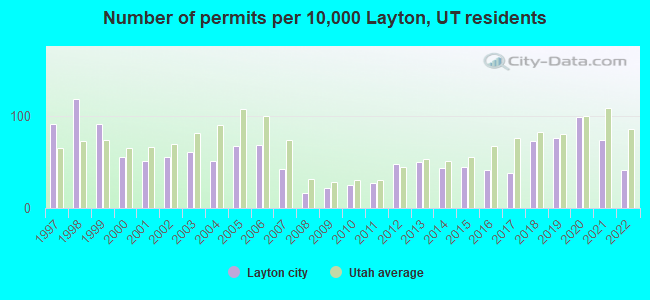
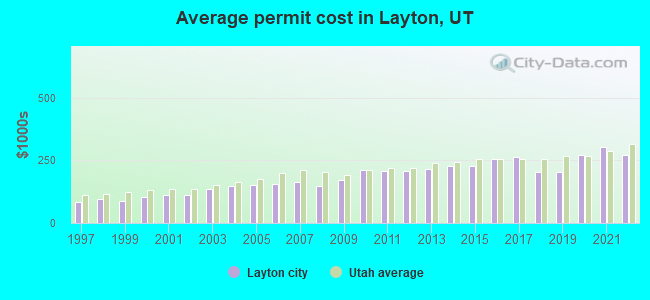
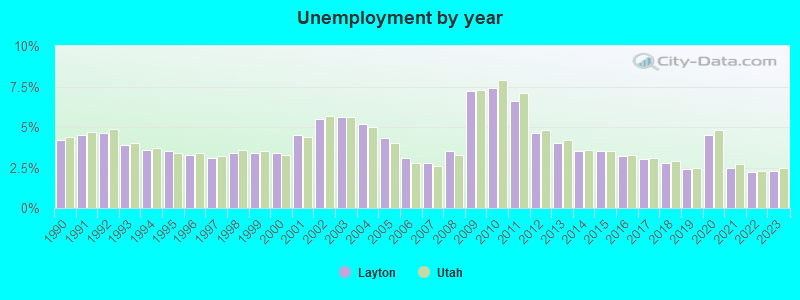
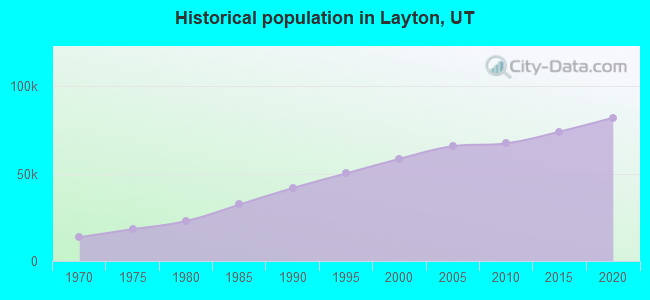
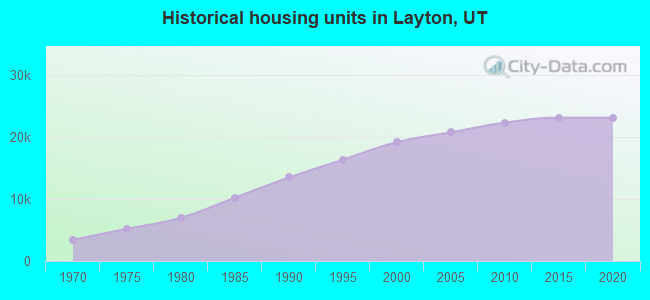
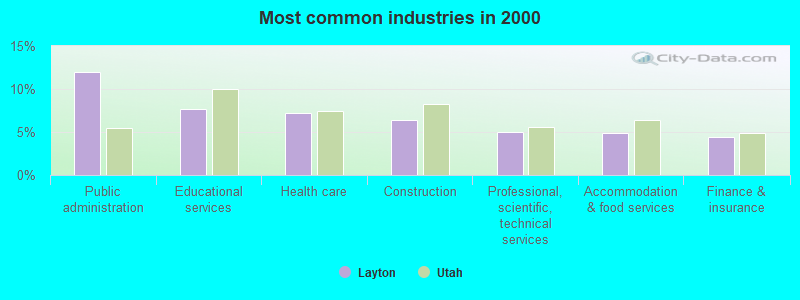
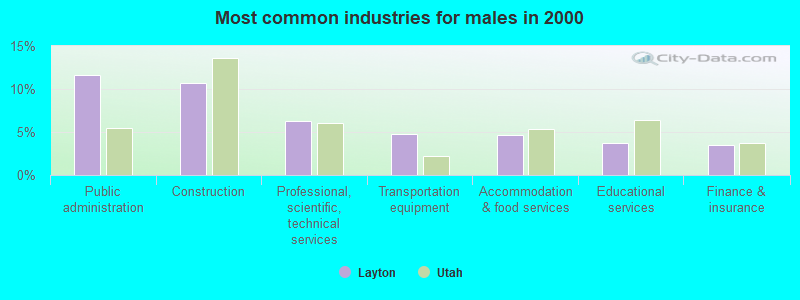
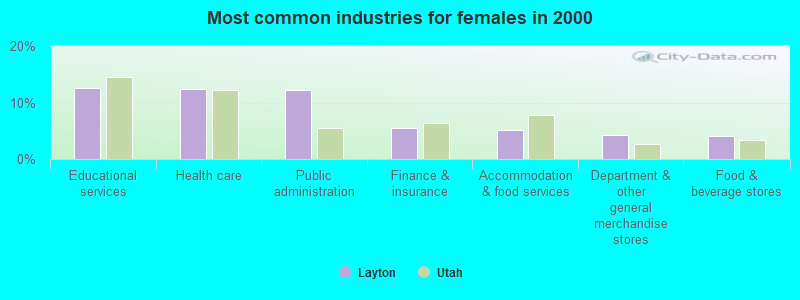
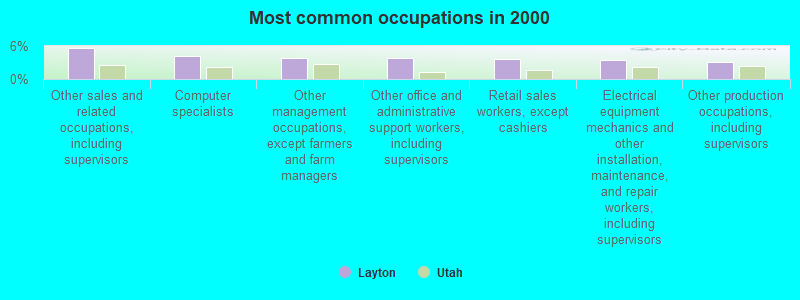
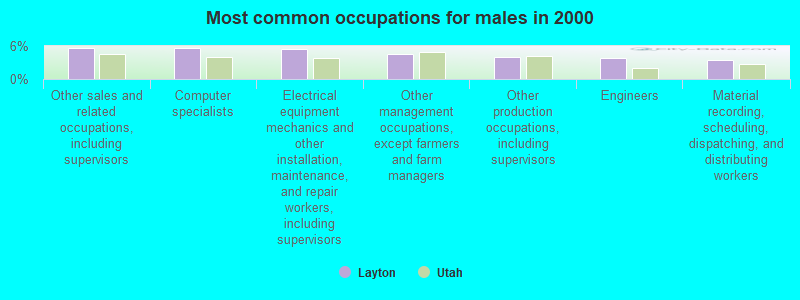
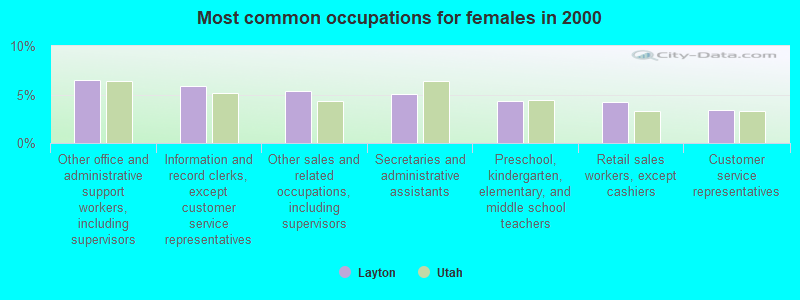


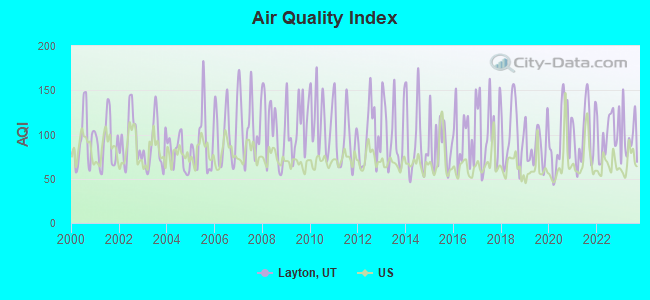
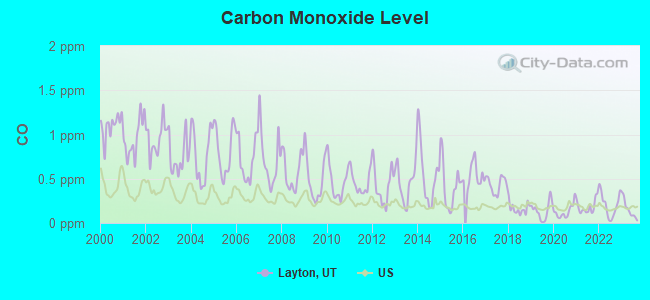
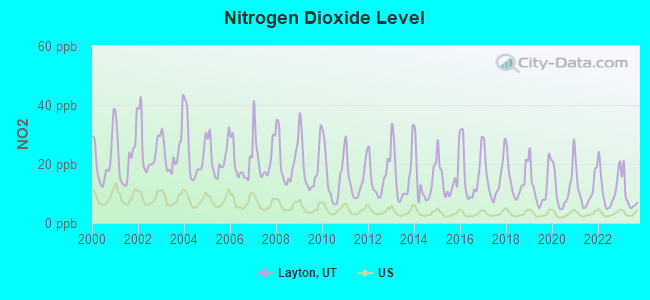
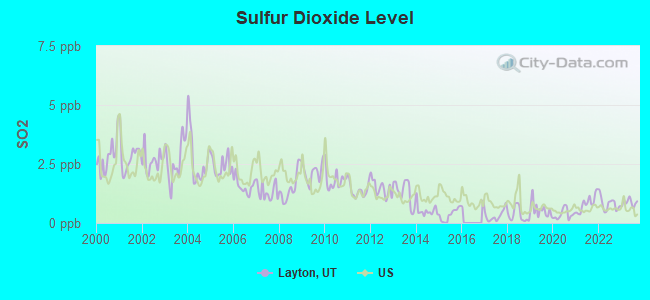
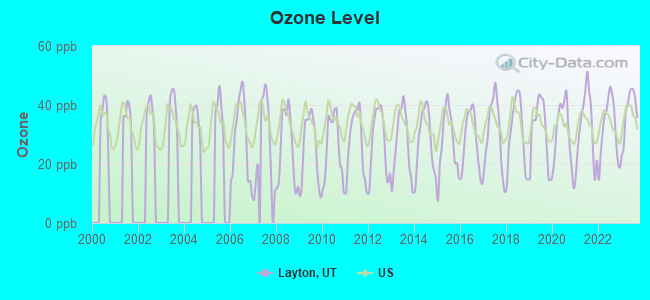
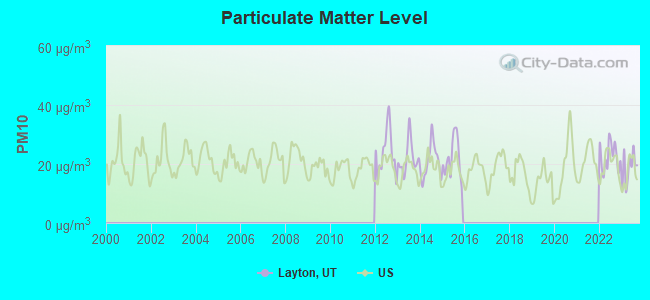
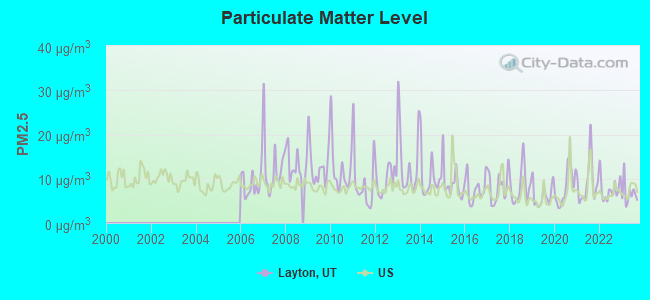
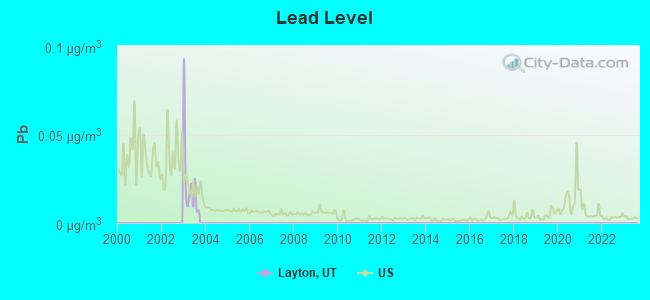

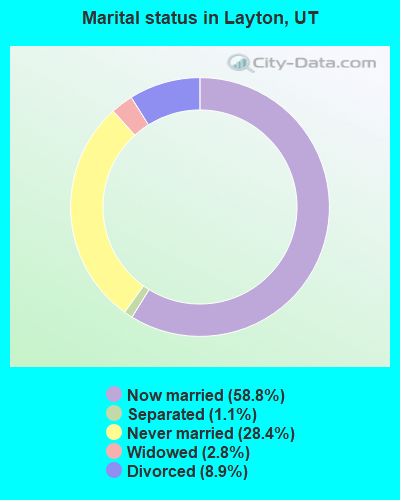
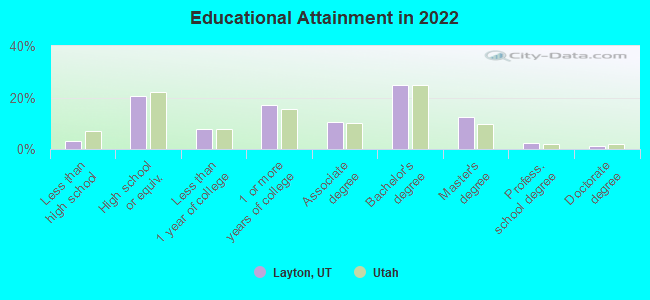
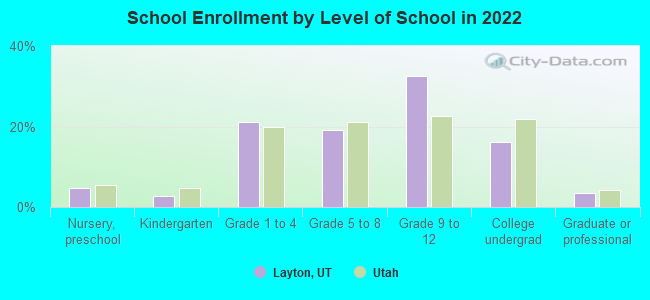
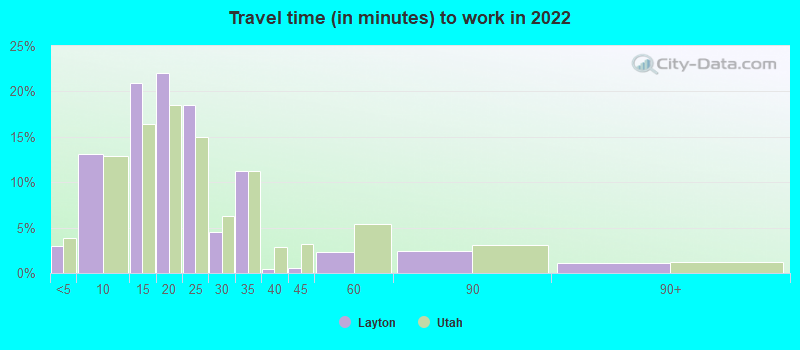
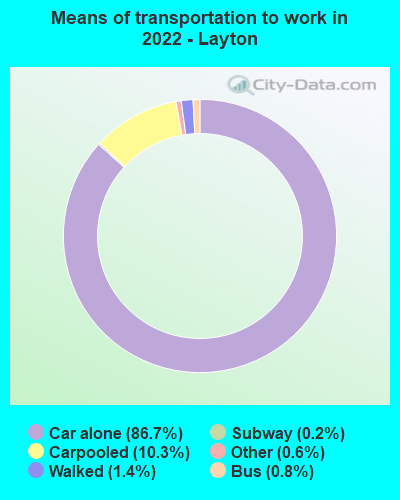
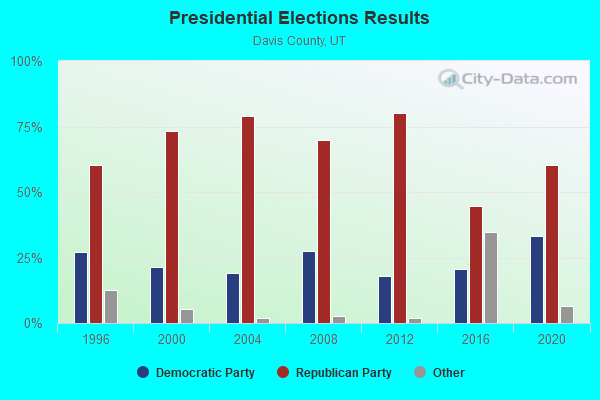
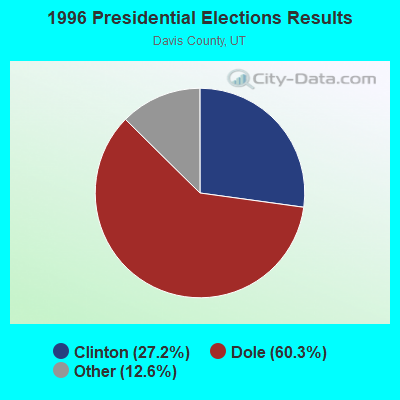
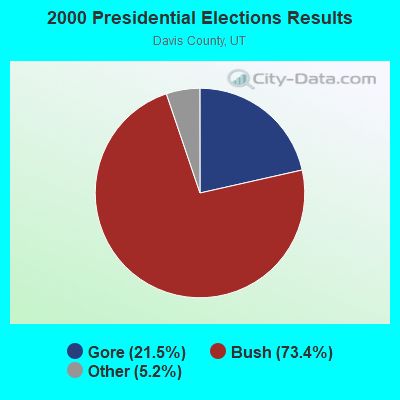
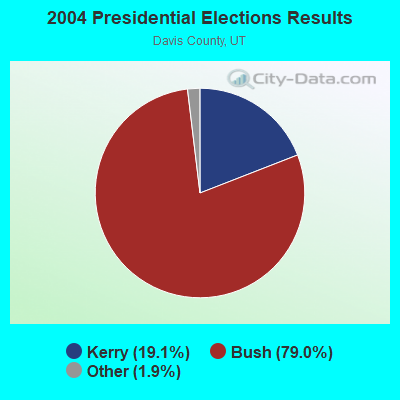
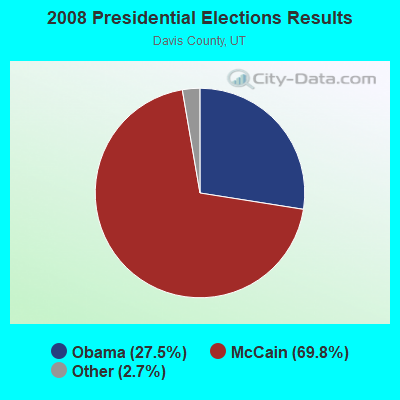
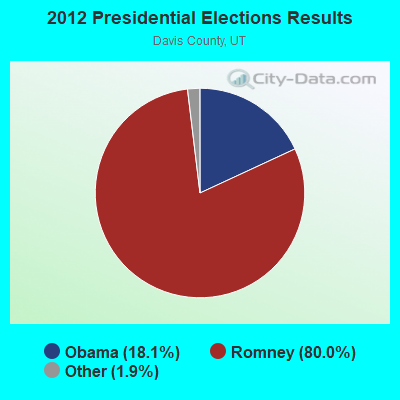
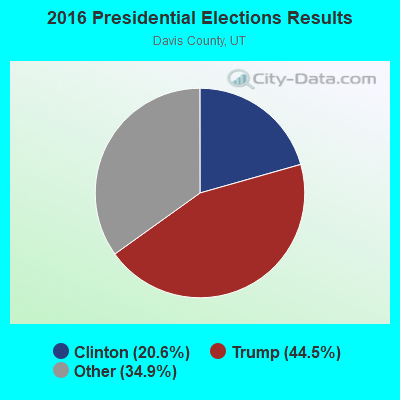
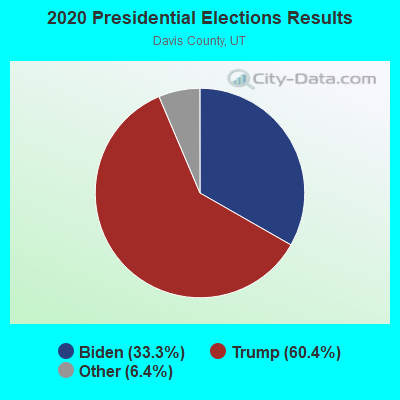
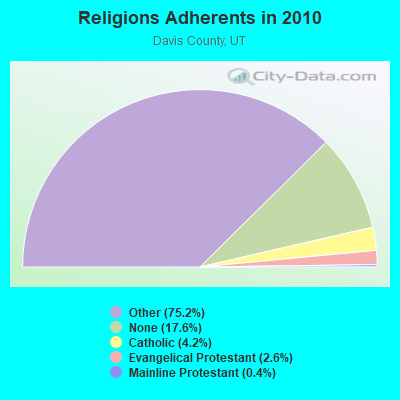
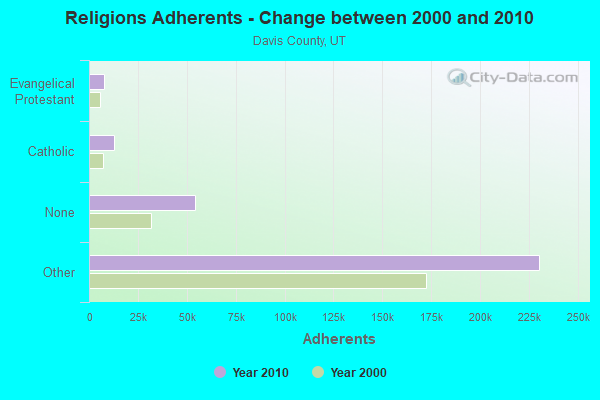
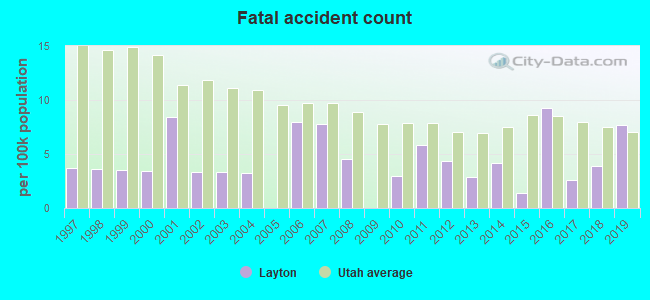
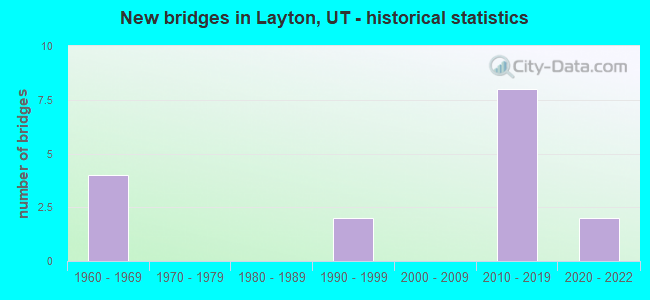
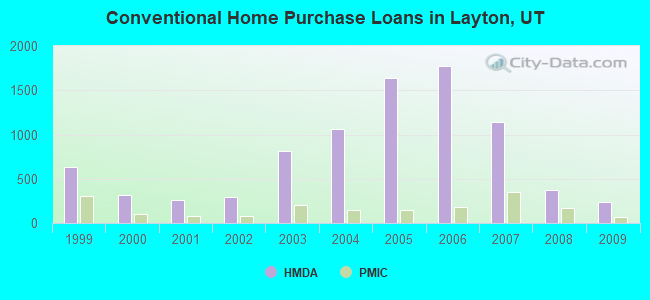
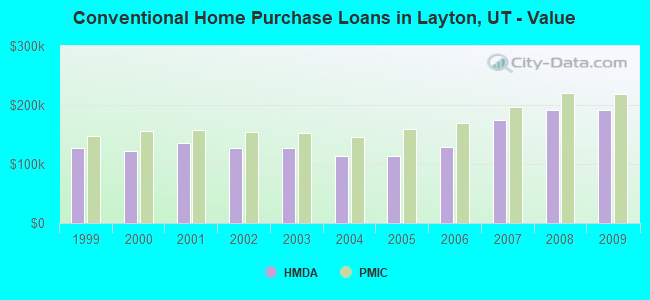
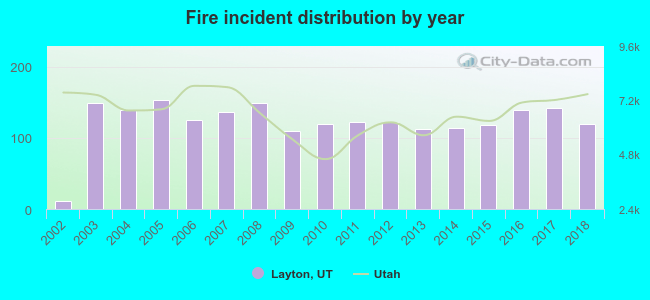 Based on the data from the years 2002 - 2018 the average number of fire incidents per year is 123. The highest number of fires - 153 took place in 2005, and the least - 11 in 2002. The data has a growing trend.
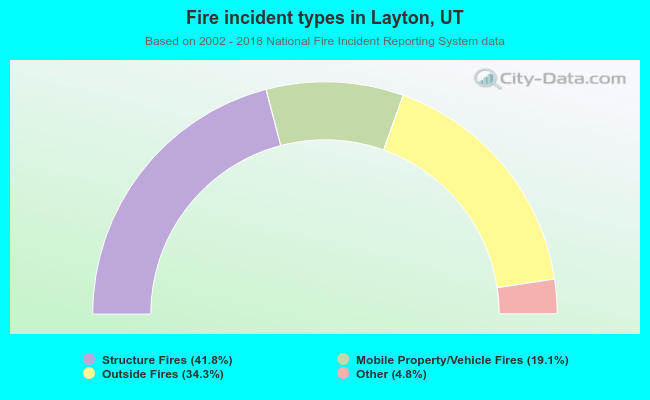 When looking into fire subcategories, the most reports belonged to: Structure Fires (41.8%), and Outside Fires (34.3%).