Jacksonville, Illinois Submit your own pictures of this city and show them to the world
OSM Map
General Map
Google Map
MSN Map
OSM Map
General Map
Google Map
MSN Map
OSM Map
General Map
Google Map
MSN Map
OSM Map
General Map
Google Map
MSN Map
Please wait while loading the map...
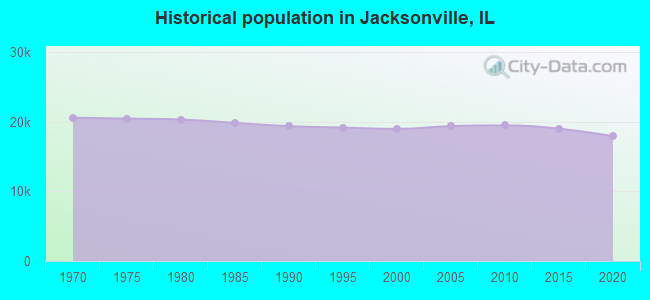
Population in 2022: 17,279 (98% urban, 2% rural). Population change since 2000: -8.8%Males: 8,699 Females: 8,580
March 2022 cost of living index in Jacksonville: 74.8 (low, U.S. average is 100) Percentage of residents living in poverty in 2022: 17.7%for White Non-Hispanic residents , 33.6% for Black residents , 43.8% for Hispanic or Latino residents , 47.6% for American Indian residents , 50.6% for two or more races residents )
Profiles of local businesses
Business Search - 14 Million verified businesses
Data:
Median household income ($)
Median household income (% change since 2000)
Household income diversity
Ratio of average income to average house value (%)
Ratio of average income to average rent
Median household income ($) - White
Median household income ($) - Black or African American
Median household income ($) - Asian
Median household income ($) - Hispanic or Latino
Median household income ($) - American Indian and Alaska Native
Median household income ($) - Multirace
Median household income ($) - Other Race
Median household income for houses/condos with a mortgage ($)
Median household income for apartments without a mortgage ($)
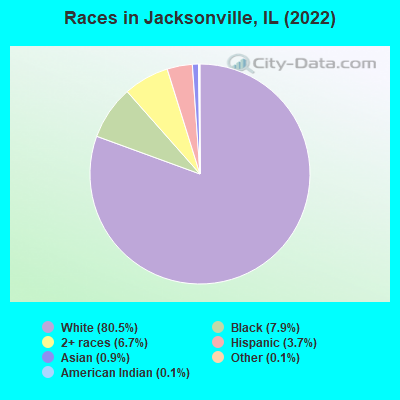
Races - White alone (%)
Races - White alone (% change since 2000)
Races - Black alone (%)
Races - Black alone (% change since 2000)
Races - American Indian alone (%)
Races - American Indian alone (% change since 2000)
Races - Asian alone (%)
Races - Asian alone (% change since 2000)
Races - Hispanic (%)
Races - Hispanic (% change since 2000)
Races - Native Hawaiian and Other Pacific Islander alone (%)
Races - Native Hawaiian and Other Pacific Islander alone (% change since 2000)
Races - Two or more races (%)
Races - Two or more races (% change since 2000)
Races - Other race alone (%)
Races - Other race alone (% change since 2000)
Racial diversity
Unemployment (%)
Unemployment (% change since 2000)
Unemployment (%) - White
Unemployment (%) - Black or African American
Unemployment (%) - Asian
Unemployment (%) - Hispanic or Latino
Unemployment (%) - American Indian and Alaska Native
Unemployment (%) - Multirace
Unemployment (%) - Other Race
Population density (people per square mile)
Population - Males (%)
Population - Females (%)
Population - Males (%) - White
Population - Males (%) - Black or African American
Population - Males (%) - Asian
Population - Males (%) - Hispanic or Latino
Population - Males (%) - American Indian and Alaska Native
Population - Males (%) - Multirace
Population - Males (%) - Other Race
Population - Females (%) - White
Population - Females (%) - Black or African American
Population - Females (%) - Asian
Population - Females (%) - Hispanic or Latino
Population - Females (%) - American Indian and Alaska Native
Population - Females (%) - Multirace
Population - Females (%) - Other Race
Coronavirus confirmed cases (Jun 04, 2024)
Deaths caused by coronavirus (Jun 04, 2024)
Coronavirus confirmed cases (per 100k population) (Jun 04, 2024)
Deaths caused by coronavirus (per 100k population) (Jun 04, 2024)
Daily increase in number of cases (Jun 04, 2024)
Weekly increase in number of cases (Jun 04, 2024)
Cases doubled (in days) (Jun 04, 2024)
Hospitalized patients (Apr 18, 2022)
Negative test results (Apr 18, 2022)
Total test results (Apr 18, 2022)
COVID Vaccine doses distributed (per 100k population) (Sep 19, 2023)
COVID Vaccine doses administered (per 100k population) (Sep 19, 2023)
COVID Vaccine doses distributed (Sep 19, 2023)
COVID Vaccine doses administered (Sep 19, 2023)
Likely homosexual households (%)
Likely homosexual households (% change since 2000)
Likely homosexual households - Lesbian couples (%)
Likely homosexual households - Lesbian couples (% change since 2000)
Likely homosexual households - Gay men (%)
Likely homosexual households - Gay men (% change since 2000)
Cost of living index
Median gross rent ($)
Median contract rent ($)
Median monthly housing costs ($)
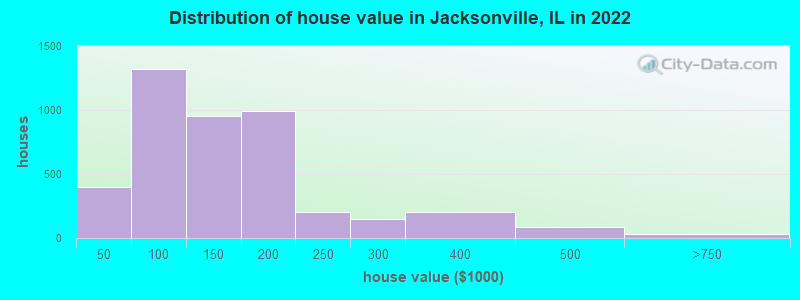
Median house or condo value ($)
Median house or condo value ($ change since 2000)
Mean house or condo value by units in structure - 1, detached ($)
Mean house or condo value by units in structure - 1, attached ($)
Mean house or condo value by units in structure - 2 ($)
Mean house or condo value by units in structure by units in structure - 3 or 4 ($)
Mean house or condo value by units in structure - 5 or more ($)
Mean house or condo value by units in structure - Boat, RV, van, etc. ($)
Mean house or condo value by units in structure - Mobile home ($)
Median house or condo value ($) - White
Median house or condo value ($) - Black or African American
Median house or condo value ($) - Asian
Median house or condo value ($) - Hispanic or Latino
Median house or condo value ($) - American Indian and Alaska Native
Median house or condo value ($) - Multirace
Median house or condo value ($) - Other Race
Median resident age
Resident age diversity
Median resident age - Males
Median resident age - Females
Median resident age - White
Median resident age - Black or African American
Median resident age - Asian
Median resident age - Hispanic or Latino
Median resident age - American Indian and Alaska Native
Median resident age - Multirace
Median resident age - Other Race
Median resident age - Males - White
Median resident age - Males - Black or African American
Median resident age - Males - Asian
Median resident age - Males - Hispanic or Latino
Median resident age - Males - American Indian and Alaska Native
Median resident age - Males - Multirace
Median resident age - Males - Other Race
Median resident age - Females - White
Median resident age - Females - Black or African American
Median resident age - Females - Asian
Median resident age - Females - Hispanic or Latino
Median resident age - Females - American Indian and Alaska Native
Median resident age - Females - Multirace
Median resident age - Females - Other Race
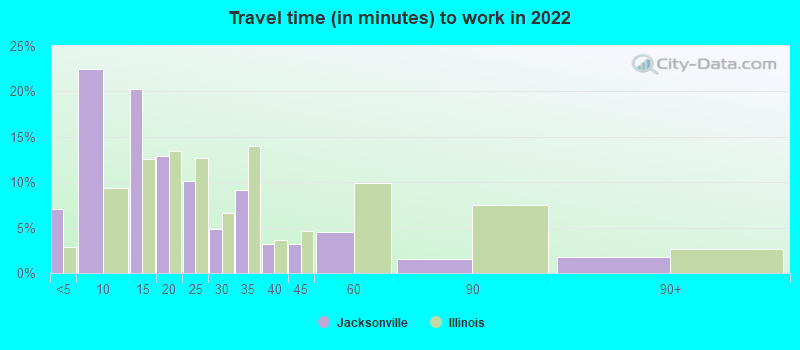
Commute - mean travel time to work (minutes)
Travel time to work - Less than 5 minutes (%)
Travel time to work - Less than 5 minutes (% change since 2000)
Travel time to work - 5 to 9 minutes (%)
Travel time to work - 5 to 9 minutes (% change since 2000)
Travel time to work - 10 to 19 minutes (%)
Travel time to work - 10 to 19 minutes (% change since 2000)
Travel time to work - 20 to 29 minutes (%)
Travel time to work - 20 to 29 minutes (% change since 2000)
Travel time to work - 30 to 39 minutes (%)
Travel time to work - 30 to 39 minutes (% change since 2000)
Travel time to work - 40 to 59 minutes (%)
Travel time to work - 40 to 59 minutes (% change since 2000)
Travel time to work - 60 to 89 minutes (%)
Travel time to work - 60 to 89 minutes (% change since 2000)
Travel time to work - 90 or more minutes (%)
Travel time to work - 90 or more minutes (% change since 2000)
Marital status - Never married (%)
Marital status - Now married (%)
Marital status - Separated (%)
Marital status - Widowed (%)
Marital status - Divorced (%)
Median family income ($)
Median family income (% change since 2000)
Median non-family income ($)
Median non-family income (% change since 2000)
Median per capita income ($)
Median per capita income (% change since 2000)
Median family income ($) - White
Median family income ($) - Black or African American
Median family income ($) - Asian
Median family income ($) - Hispanic or Latino
Median family income ($) - American Indian and Alaska Native
Median family income ($) - Multirace
Median family income ($) - Other Race
Median year house/condo built
Median year apartment built
Year house built - Built 2005 or later (%)
Year house built - Built 2000 to 2004 (%)
Year house built - Built 1990 to 1999 (%)
Year house built - Built 1980 to 1989 (%)
Year house built - Built 1970 to 1979 (%)
Year house built - Built 1960 to 1969 (%)
Year house built - Built 1950 to 1959 (%)
Year house built - Built 1940 to 1949 (%)
Year house built - Built 1939 or earlier (%)
Average household size
Household density (households per square mile)
Average household size - White
Average household size - Black or African American
Average household size - Asian
Average household size - Hispanic or Latino
Average household size - American Indian and Alaska Native
Average household size - Multirace
Average household size - Other Race
Occupied housing units (%)
Vacant housing units (%)
Owner occupied housing units (%)
Renter occupied housing units (%)
Vacancy status - For rent (%)
Vacancy status - For sale only (%)
Vacancy status - Rented or sold, not occupied (%)
Vacancy status - For seasonal, recreational, or occasional use (%)
Vacancy status - For migrant workers (%)
Vacancy status - Other vacant (%)
Residents with income below the poverty level (%)
Residents with income below 50% of the poverty level (%)
Children below poverty level (%)
Poor families by family type - Married-couple family (%)
Poor families by family type - Male, no wife present (%)
Poor families by family type - Female, no husband present (%)
Poverty status for native-born residents (%)
Poverty status for foreign-born residents (%)
Poverty among high school graduates not in families (%)
Poverty among people who did not graduate high school not in families (%)
Residents with income below the poverty level (%) - White
Residents with income below the poverty level (%) - Black or African American
Residents with income below the poverty level (%) - Asian
Residents with income below the poverty level (%) - Hispanic or Latino
Residents with income below the poverty level (%) - American Indian and Alaska Native
Residents with income below the poverty level (%) - Multirace
Residents with income below the poverty level (%) - Other Race
Air pollution - Air Quality Index (AQI)
Air pollution - CO
Air pollution - NO2
Air pollution - SO2
Air pollution - Ozone
Air pollution - PM10
Air pollution - PM25
Air pollution - Pb
Crime - Murders per 100,000 population
Crime - Rapes per 100,000 population
Crime - Robberies per 100,000 population
Crime - Assaults per 100,000 population
Crime - Burglaries per 100,000 population
Crime - Thefts per 100,000 population
Crime - Auto thefts per 100,000 population
Crime - Arson per 100,000 population
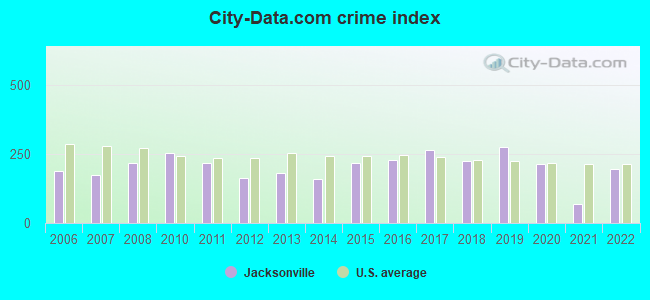
Crime - City-data.com crime index
Crime - Violent crime index
Crime - Property crime index
Crime - Murders per 100,000 population (5 year average)
Crime - Rapes per 100,000 population (5 year average)
Crime - Robberies per 100,000 population (5 year average)
Crime - Assaults per 100,000 population (5 year average)
Crime - Burglaries per 100,000 population (5 year average)
Crime - Thefts per 100,000 population (5 year average)
Crime - Auto thefts per 100,000 population (5 year average)
Crime - Arson per 100,000 population (5 year average)
Crime - City-data.com crime index (5 year average)
Crime - Violent crime index (5 year average)
Crime - Property crime index (5 year average)
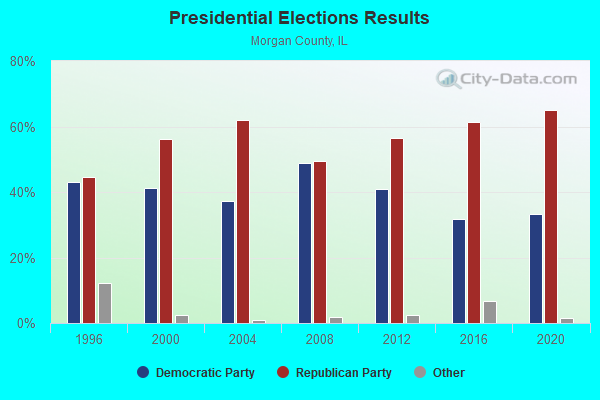
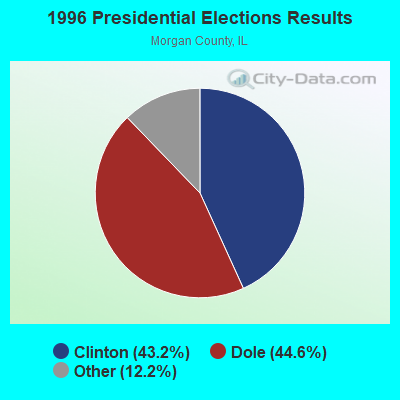
1996 Presidential Elections Results (%) - Democratic Party (Clinton)
1996 Presidential Elections Results (%) - Republican Party (Dole)
1996 Presidential Elections Results (%) - Other
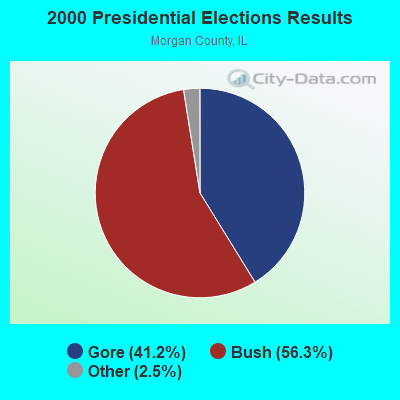
2000 Presidential Elections Results (%) - Democratic Party (Gore)
2000 Presidential Elections Results (%) - Republican Party (Bush)
2000 Presidential Elections Results (%) - Other
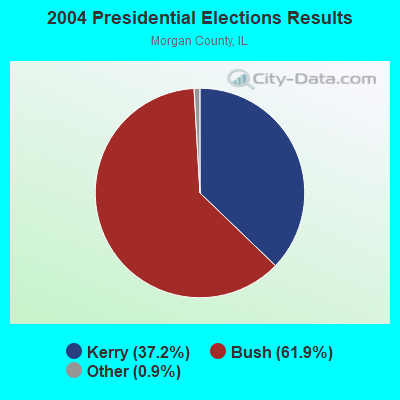
2004 Presidential Elections Results (%) - Democratic Party (Kerry)
2004 Presidential Elections Results (%) - Republican Party (Bush)
2004 Presidential Elections Results (%) - Other
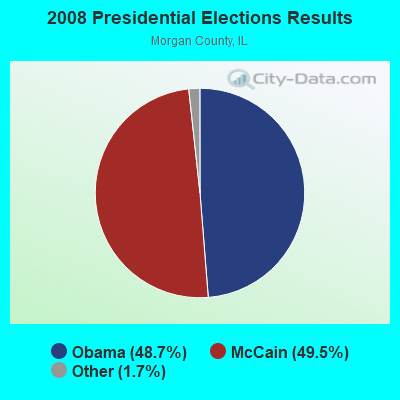
2008 Presidential Elections Results (%) - Democratic Party (Obama)
2008 Presidential Elections Results (%) - Republican Party (McCain)
2008 Presidential Elections Results (%) - Other
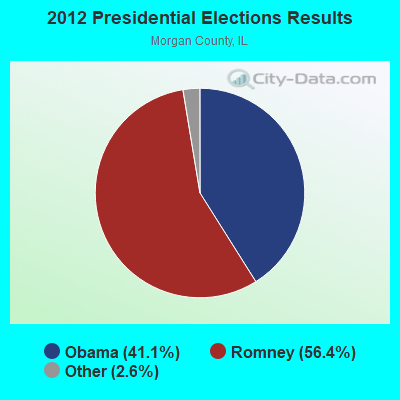
2012 Presidential Elections Results (%) - Democratic Party (Obama)
2012 Presidential Elections Results (%) - Republican Party (Romney)
2012 Presidential Elections Results (%) - Other
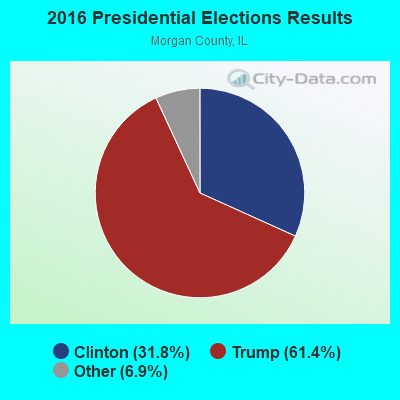
2016 Presidential Elections Results (%) - Democratic Party (Clinton)
2016 Presidential Elections Results (%) - Republican Party (Trump)
2016 Presidential Elections Results (%) - Other
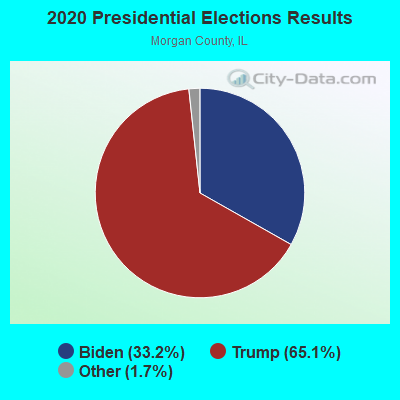
2020 Presidential Elections Results (%) - Democratic Party (Biden)
2020 Presidential Elections Results (%) - Republican Party (Trump)
2020 Presidential Elections Results (%) - Other
Ancestries Reported - Arab (%)
Ancestries Reported - Czech (%)
Ancestries Reported - Danish (%)
Ancestries Reported - Dutch (%)
Ancestries Reported - English (%)
Ancestries Reported - French (%)
Ancestries Reported - French Canadian (%)
Ancestries Reported - German (%)
Ancestries Reported - Greek (%)
Ancestries Reported - Hungarian (%)
Ancestries Reported - Irish (%)
Ancestries Reported - Italian (%)
Ancestries Reported - Lithuanian (%)
Ancestries Reported - Norwegian (%)
Ancestries Reported - Polish (%)
Ancestries Reported - Portuguese (%)
Ancestries Reported - Russian (%)
Ancestries Reported - Scotch-Irish (%)
Ancestries Reported - Scottish (%)
Ancestries Reported - Slovak (%)
Ancestries Reported - Subsaharan African (%)
Ancestries Reported - Swedish (%)
Ancestries Reported - Swiss (%)
Ancestries Reported - Ukrainian (%)
Ancestries Reported - United States (%)
Ancestries Reported - Welsh (%)
Ancestries Reported - West Indian (%)
Ancestries Reported - Other (%)
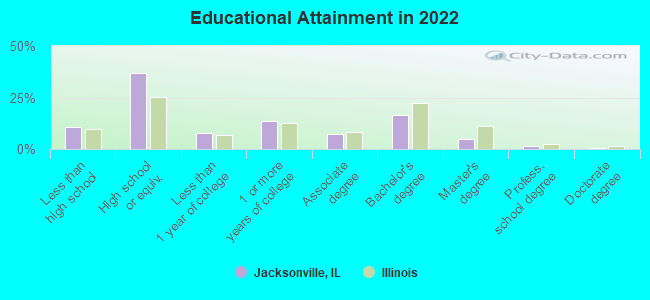
Educational Attainment - No schooling completed (%)
Educational Attainment - Less than high school (%)
Educational Attainment - High school or equivalent (%)
Educational Attainment - Less than 1 year of college (%)
Educational Attainment - 1 or more years of college (%)
Educational Attainment - Associate degree (%)
Educational Attainment - Bachelor's degree (%)
Educational Attainment - Master's degree (%)
Educational Attainment - Professional school degree (%)
Educational Attainment - Doctorate degree (%)
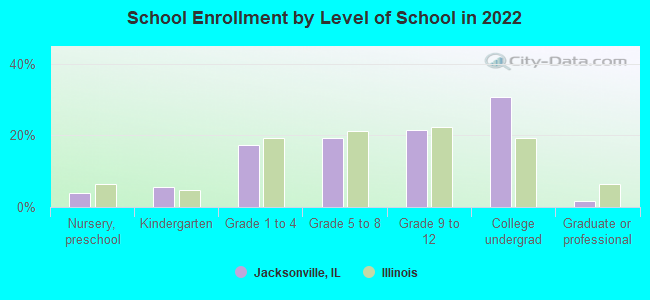
School Enrollment - Nursery, preschool (%)
School Enrollment - Kindergarten (%)
School Enrollment - Grade 1 to 4 (%)
School Enrollment - Grade 5 to 8 (%)
School Enrollment - Grade 9 to 12 (%)
School Enrollment - College undergrad (%)
School Enrollment - Graduate or professional (%)
School Enrollment - Not enrolled in school (%)
School enrollment - Public schools (%)
School enrollment - Private schools (%)
School enrollment - Not enrolled (%)
Median number of rooms in houses and condos
Median number of rooms in apartments
Housing units lacking complete plumbing facilities (%)
Housing units lacking complete kitchen facilities (%)
Density of houses
Urban houses (%)
Rural houses (%)
Households with people 60 years and over (%)
Households with people 65 years and over (%)
Households with people 75 years and over (%)
Households with one or more nonrelatives (%)
Households with no nonrelatives (%)
Population in households (%)
Family households (%)
Nonfamily households (%)
Population in families (%)
Family households with own children (%)
Median number of bedrooms in owner occupied houses
Mean number of bedrooms in owner occupied houses
Median number of bedrooms in renter occupied houses
Mean number of bedrooms in renter occupied houses
Median number of vehichles in owner occupied houses
Mean number of vehichles in owner occupied houses
Median number of vehichles in renter occupied houses
Mean number of vehichles in renter occupied houses
Mortgage status - with mortgage (%)
Mortgage status - with second mortgage (%)
Mortgage status - with home equity loan (%)
Mortgage status - with both second mortgage and home equity loan (%)
Mortgage status - without a mortgage (%)
Average family size
Average family size - White
Average family size - Black or African American
Average family size - Asian
Average family size - Hispanic or Latino
Average family size - American Indian and Alaska Native
Average family size - Multirace
Average family size - Other Race
Geographical mobility - Same house 1 year ago (%)
Geographical mobility - Moved within same county (%)
Geographical mobility - Moved from different county within same state (%)
Geographical mobility - Moved from different state (%)
Geographical mobility - Moved from abroad (%)
Place of birth - Born in state of residence (%)
Place of birth - Born in other state (%)
Place of birth - Native, outside of US (%)
Place of birth - Foreign born (%)
Housing units in structures - 1, detached (%)
Housing units in structures - 1, attached (%)
Housing units in structures - 2 (%)
Housing units in structures - 3 or 4 (%)
Housing units in structures - 5 to 9 (%)
Housing units in structures - 10 to 19 (%)
Housing units in structures - 20 to 49 (%)
Housing units in structures - 50 or more (%)
Housing units in structures - Mobile home (%)
Housing units in structures - Boat, RV, van, etc. (%)
House/condo owner moved in on average (years ago)
Renter moved in on average (years ago)
Year householder moved into unit - Moved in 1999 to March 2000 (%)
Year householder moved into unit - Moved in 1995 to 1998 (%)
Year householder moved into unit - Moved in 1990 to 1994 (%)
Year householder moved into unit - Moved in 1980 to 1989 (%)
Year householder moved into unit - Moved in 1970 to 1979 (%)
Year householder moved into unit - Moved in 1969 or earlier (%)
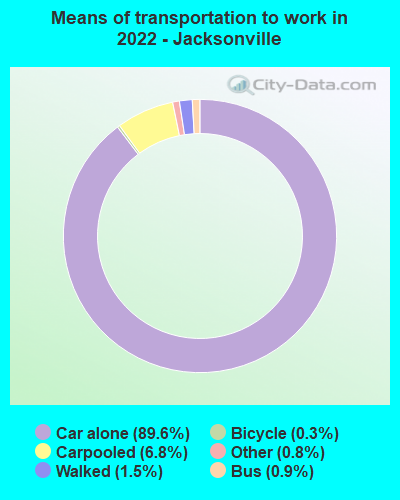
Means of transportation to work - Drove car alone (%)
Means of transportation to work - Carpooled (%)
Means of transportation to work - Public transportation (%)
Means of transportation to work - Bus or trolley bus (%)
Means of transportation to work - Streetcar or trolley car (%)
Means of transportation to work - Subway or elevated (%)
Means of transportation to work - Railroad (%)
Means of transportation to work - Ferryboat (%)
Means of transportation to work - Taxicab (%)
Means of transportation to work - Motorcycle (%)
Means of transportation to work - Bicycle (%)
Means of transportation to work - Walked (%)
Means of transportation to work - Other means (%)
Working at home (%)
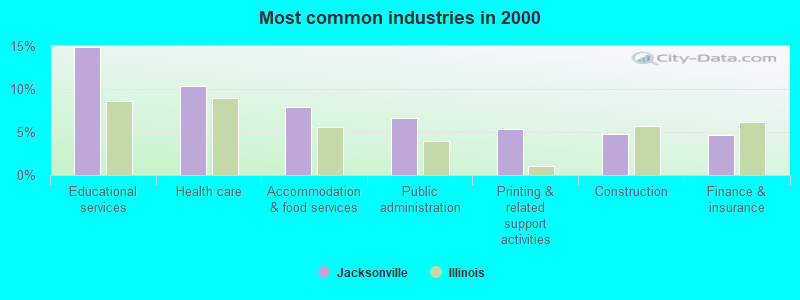
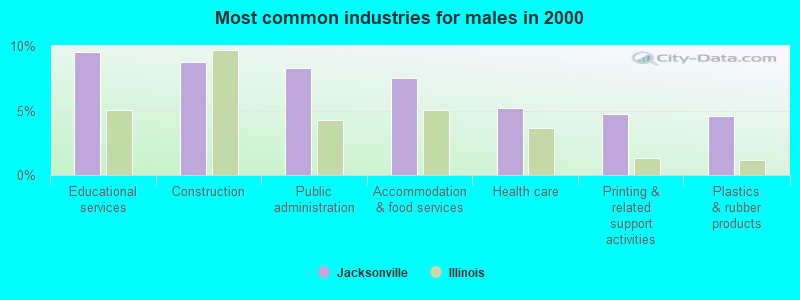
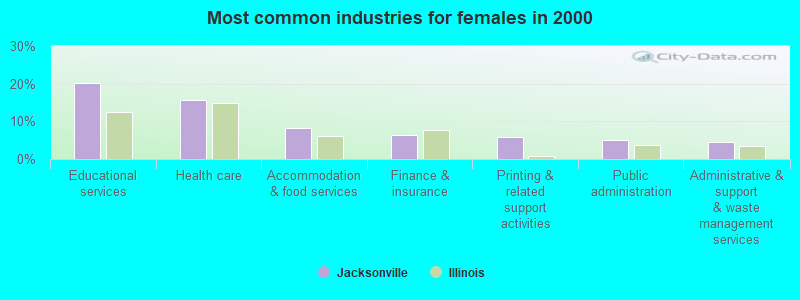
Industry diversity
Most Common Industries - Agriculture, forestry, fishing and hunting, and mining (%)
Most Common Industries - Agriculture, forestry, fishing and hunting (%)
Most Common Industries - Mining, quarrying, and oil and gas extraction (%)
Most Common Industries - Construction (%)
Most Common Industries - Manufacturing (%)
Most Common Industries - Wholesale trade (%)
Most Common Industries - Retail trade (%)
Most Common Industries - Transportation and warehousing, and utilities (%)
Most Common Industries - Transportation and warehousing (%)
Most Common Industries - Utilities (%)
Most Common Industries - Information (%)
Most Common Industries - Finance and insurance, and real estate and rental and leasing (%)
Most Common Industries - Finance and insurance (%)
Most Common Industries - Real estate and rental and leasing (%)
Most Common Industries - Professional, scientific, and management, and administrative and waste management services (%)
Most Common Industries - Professional, scientific, and technical services (%)
Most Common Industries - Management of companies and enterprises (%)
Most Common Industries - Administrative and support and waste management services (%)
Most Common Industries - Educational services, and health care and social assistance (%)
Most Common Industries - Educational services (%)
Most Common Industries - Health care and social assistance (%)
Most Common Industries - Arts, entertainment, and recreation, and accommodation and food services (%)
Most Common Industries - Arts, entertainment, and recreation (%)
Most Common Industries - Accommodation and food services (%)
Most Common Industries - Other services, except public administration (%)
Most Common Industries - Public administration (%)
Occupation diversity
Most Common Occupations - Management, business, science, and arts occupations (%)
Most Common Occupations - Management, business, and financial occupations (%)
Most Common Occupations - Management occupations (%)
Most Common Occupations - Business and financial operations occupations (%)
Most Common Occupations - Computer, engineering, and science occupations (%)
Most Common Occupations - Computer and mathematical occupations (%)
Most Common Occupations - Architecture and engineering occupations (%)
Most Common Occupations - Life, physical, and social science occupations (%)
Most Common Occupations - Education, legal, community service, arts, and media occupations (%)
Most Common Occupations - Community and social service occupations (%)
Most Common Occupations - Legal occupations (%)
Most Common Occupations - Education, training, and library occupations (%)
Most Common Occupations - Arts, design, entertainment, sports, and media occupations (%)
Most Common Occupations - Healthcare practitioners and technical occupations (%)
Most Common Occupations - Health diagnosing and treating practitioners and other technical occupations (%)
Most Common Occupations - Health technologists and technicians (%)
Most Common Occupations - Service occupations (%)
Most Common Occupations - Healthcare support occupations (%)
Most Common Occupations - Protective service occupations (%)
Most Common Occupations - Fire fighting and prevention, and other protective service workers including supervisors (%)
Most Common Occupations - Law enforcement workers including supervisors (%)
Most Common Occupations - Food preparation and serving related occupations (%)
Most Common Occupations - Building and grounds cleaning and maintenance occupations (%)
Most Common Occupations - Personal care and service occupations (%)
Most Common Occupations - Sales and office occupations (%)
Most Common Occupations - Sales and related occupations (%)
Most Common Occupations - Office and administrative support occupations (%)
Most Common Occupations - Natural resources, construction, and maintenance occupations (%)
Most Common Occupations - Farming, fishing, and forestry occupations (%)
Most Common Occupations - Construction and extraction occupations (%)
Most Common Occupations - Installation, maintenance, and repair occupations (%)
Most Common Occupations - Production, transportation, and material moving occupations (%)
Most Common Occupations - Production occupations (%)
Most Common Occupations - Transportation occupations (%)
Most Common Occupations - Material moving occupations (%)
People in Group quarters - Institutionalized population (%)
People in Group quarters - Correctional institutions (%)
People in Group quarters - Federal prisons and detention centers (%)
People in Group quarters - Halfway houses (%)
People in Group quarters - Local jails and other confinement facilities (including police lockups) (%)
People in Group quarters - Military disciplinary barracks (%)
People in Group quarters - State prisons (%)
People in Group quarters - Other types of correctional institutions (%)
People in Group quarters - Nursing homes (%)
People in Group quarters - Hospitals/wards, hospices, and schools for the handicapped (%)
People in Group quarters - Hospitals/wards and hospices for chronically ill (%)
People in Group quarters - Hospices or homes for chronically ill (%)
People in Group quarters - Military hospitals or wards for chronically ill (%)
People in Group quarters - Other hospitals or wards for chronically ill (%)
People in Group quarters - Hospitals or wards for drug/alcohol abuse (%)
People in Group quarters - Mental (Psychiatric) hospitals or wards (%)
People in Group quarters - Schools, hospitals, or wards for the mentally retarded (%)
People in Group quarters - Schools, hospitals, or wards for the physically handicapped (%)
People in Group quarters - Institutions for the deaf (%)
People in Group quarters - Institutions for the blind (%)
People in Group quarters - Orthopedic wards and institutions for the physically handicapped (%)
People in Group quarters - Wards in general hospitals for patients who have no usual home elsewhere (%)
People in Group quarters - Wards in military hospitals for patients who have no usual home elsewhere (%)
People in Group quarters - Juvenile institutions (%)
People in Group quarters - Long-term care (%)
People in Group quarters - Homes for abused, dependent, and neglected children (%)
People in Group quarters - Residential treatment centers for emotionally disturbed children (%)
People in Group quarters - Training schools for juvenile delinquents (%)
People in Group quarters - Short-term care, detention or diagnostic centers for delinquent children (%)
People in Group quarters - Type of juvenile institution unknown (%)
People in Group quarters - Noninstitutionalized population (%)
People in Group quarters - College dormitories (includes college quarters off campus) (%)
People in Group quarters - Military quarters (%)
People in Group quarters - On base (%)
People in Group quarters - Barracks, unaccompanied personnel housing (UPH), (Enlisted/Officer), ;and similar group living quarters for military personnel (%)
People in Group quarters - Transient quarters for temporary residents (%)
People in Group quarters - Military ships (%)
People in Group quarters - Group homes (%)
People in Group quarters - Homes or halfway houses for drug/alcohol abuse (%)
People in Group quarters - Homes for the mentally ill (%)
People in Group quarters - Homes for the mentally retarded (%)
People in Group quarters - Homes for the physically handicapped (%)
People in Group quarters - Other group homes (%)
People in Group quarters - Religious group quarters (%)
People in Group quarters - Dormitories (%)
People in Group quarters - Agriculture workers' dormitories on farms (%)
People in Group quarters - Job Corps and vocational training facilities (%)
People in Group quarters - Other workers' dormitories (%)
People in Group quarters - Crews of maritime vessels (%)
People in Group quarters - Other nonhousehold living situations (%)
People in Group quarters - Other noninstitutional group quarters (%)
Residents speaking English at home (%)
Residents speaking English at home - Born in the United States (%)
Residents speaking English at home - Native, born elsewhere (%)
Residents speaking English at home - Foreign born (%)
Residents speaking Spanish at home (%)
Residents speaking Spanish at home - Born in the United States (%)
Residents speaking Spanish at home - Native, born elsewhere (%)
Residents speaking Spanish at home - Foreign born (%)
Residents speaking other language at home (%)
Residents speaking other language at home - Born in the United States (%)
Residents speaking other language at home - Native, born elsewhere (%)
Residents speaking other language at home - Foreign born (%)
Class of Workers - Employee of private company (%)
Class of Workers - Self-employed in own incorporated business (%)
Class of Workers - Private not-for-profit wage and salary workers (%)
Class of Workers - Local government workers (%)
Class of Workers - State government workers (%)
Class of Workers - Federal government workers (%)
Class of Workers - Self-employed workers in own not incorporated business and Unpaid family workers (%)
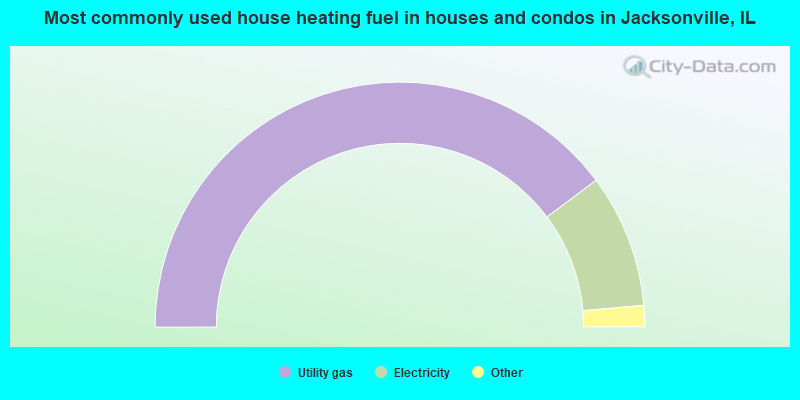
House heating fuel used in houses and condos - Utility gas (%)
House heating fuel used in houses and condos - Bottled, tank, or LP gas (%)
House heating fuel used in houses and condos - Electricity (%)
House heating fuel used in houses and condos - Fuel oil, kerosene, etc. (%)
House heating fuel used in houses and condos - Coal or coke (%)
House heating fuel used in houses and condos - Wood (%)
House heating fuel used in houses and condos - Solar energy (%)
House heating fuel used in houses and condos - Other fuel (%)
House heating fuel used in houses and condos - No fuel used (%)
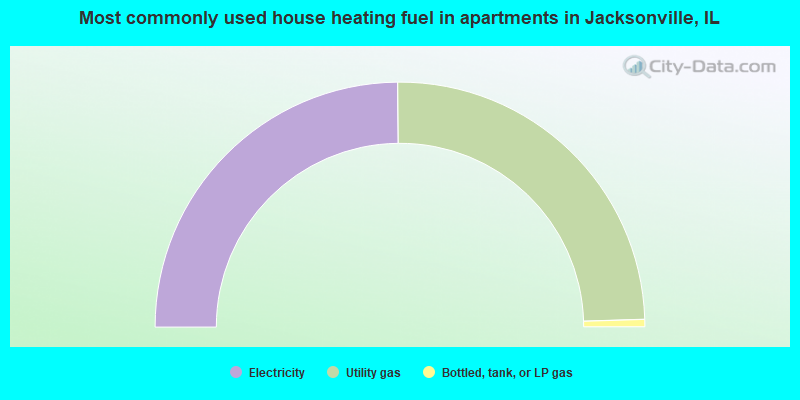
House heating fuel used in apartments - Utility gas (%)
House heating fuel used in apartments - Bottled, tank, or LP gas (%)
House heating fuel used in apartments - Electricity (%)
House heating fuel used in apartments - Fuel oil, kerosene, etc. (%)
House heating fuel used in apartments - Coal or coke (%)
House heating fuel used in apartments - Wood (%)
House heating fuel used in apartments - Solar energy (%)
House heating fuel used in apartments - Other fuel (%)
House heating fuel used in apartments - No fuel used (%)
Armed forces status - In Armed Forces (%)
Armed forces status - Civilian (%)
Armed forces status - Civilian - Veteran (%)
Armed forces status - Civilian - Nonveteran (%)
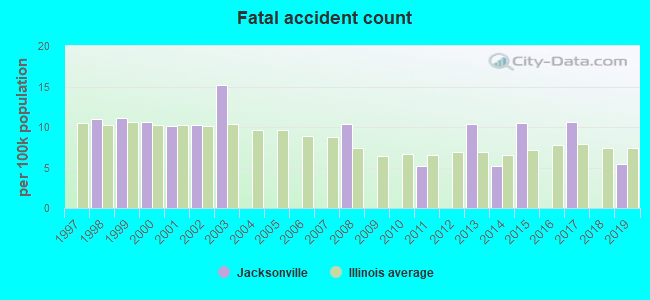
Fatal accidents locations in years 2005-2021
Fatal accidents locations in 2005
Fatal accidents locations in 2006
Fatal accidents locations in 2007
Fatal accidents locations in 2008
Fatal accidents locations in 2009
Fatal accidents locations in 2010
Fatal accidents locations in 2011
Fatal accidents locations in 2012
Fatal accidents locations in 2013
Fatal accidents locations in 2014
Fatal accidents locations in 2015
Fatal accidents locations in 2016
Fatal accidents locations in 2017
Fatal accidents locations in 2018
Fatal accidents locations in 2019
Fatal accidents locations in 2020
Fatal accidents locations in 2021
Alcohol use - People drinking some alcohol every month (%)
Alcohol use - People not drinking at all (%)
Alcohol use - Average days/month drinking alcohol
Alcohol use - Average drinks/week
Alcohol use - Average days/year people drink much
Audiometry - Average condition of hearing (%)
Audiometry - People that can hear a whisper from across a quiet room (%)
Audiometry - People that can hear normal voice from across a quiet room (%)
Audiometry - Ears ringing, roaring, buzzing (%)
Audiometry - Had a job exposure to loud noise (%)
Audiometry - Had off-work exposure to loud noise (%)
Blood Pressure & Cholesterol - Has high blood pressure (%)
Blood Pressure & Cholesterol - Checking blood pressure at home (%)
Blood Pressure & Cholesterol - Frequently checking blood cholesterol (%)
Blood Pressure & Cholesterol - Has high cholesterol level (%)
Consumer Behavior - Money monthly spent on food at supermarket/grocery store
Consumer Behavior - Money monthly spent on food at other stores
Consumer Behavior - Money monthly spent on eating out
Consumer Behavior - Money monthly spent on carryout/delivered foods
Consumer Behavior - Income spent on food at supermarket/grocery store (%)
Consumer Behavior - Income spent on food at other stores (%)
Consumer Behavior - Income spent on eating out (%)
Consumer Behavior - Income spent on carryout/delivered foods (%)
Current Health Status - General health condition (%)
Current Health Status - Blood donors (%)
Current Health Status - Has blood ever tested for HIV virus (%)
Current Health Status - Left-handed people (%)
Dermatology - People using sunscreen (%)
Diabetes - Diabetics (%)
Diabetes - Had a blood test for high blood sugar (%)
Diabetes - People taking insulin (%)
Diet Behavior & Nutrition - Diet health (%)
Diet Behavior & Nutrition - Milk product consumption (# of products/month)
Diet Behavior & Nutrition - Meals not home prepared (#/week)
Diet Behavior & Nutrition - Meals from fast food or pizza place (#/week)
Diet Behavior & Nutrition - Ready-to-eat foods (#/month)
Diet Behavior & Nutrition - Frozen meals/pizza (#/month)
Drug Use - People that ever used marijuana or hashish (%)
Drug Use - Ever used hard drugs (%)
Drug Use - Ever used any form of cocaine (%)
Drug Use - Ever used heroin (%)
Drug Use - Ever used methamphetamine (%)
Health Insurance - People covered by health insurance (%)
Kidney Conditions-Urology - Avg. # of times urinating at night
Medical Conditions - People with asthma (%)
Medical Conditions - People with anemia (%)
Medical Conditions - People with psoriasis (%)
Medical Conditions - People with overweight (%)
Medical Conditions - Elderly people having difficulties in thinking or remembering (%)
Medical Conditions - People who ever received blood transfusion (%)
Medical Conditions - People having trouble seeing even with glass/contacts (%)
Medical Conditions - People with arthritis (%)
Medical Conditions - People with gout (%)
Medical Conditions - People with congestive heart failure (%)
Medical Conditions - People with coronary heart disease (%)
Medical Conditions - People with angina pectoris (%)
Medical Conditions - People who ever had heart attack (%)
Medical Conditions - People who ever had stroke (%)
Medical Conditions - People with emphysema (%)
Medical Conditions - People with thyroid problem (%)
Medical Conditions - People with chronic bronchitis (%)
Medical Conditions - People with any liver condition (%)
Medical Conditions - People who ever had cancer or malignancy (%)
Mental Health - People who have little interest in doing things (%)
Mental Health - People feeling down, depressed, or hopeless (%)
Mental Health - People who have trouble sleeping or sleeping too much (%)
Mental Health - People feeling tired or having little energy (%)
Mental Health - People with poor appetite or overeating (%)
Mental Health - People feeling bad about themself (%)
Mental Health - People who have trouble concentrating on things (%)
Mental Health - People moving or speaking slowly or too fast (%)
Mental Health - People having thoughts they would be better off dead (%)
Oral Health - Average years since last visit a dentist
Oral Health - People embarrassed because of mouth (%)
Oral Health - People with gum disease (%)
Oral Health - General health of teeth and gums (%)
Oral Health - Average days a week using dental floss/device
Oral Health - Average days a week using mouthwash for dental problem
Oral Health - Average number of teeth
Pesticide Use - Households using pesticides to control insects (%)
Pesticide Use - Households using pesticides to kill weeds (%)
Physical Activity - People doing vigorous-intensity work activities (%)
Physical Activity - People doing moderate-intensity work activities (%)
Physical Activity - People walking or bicycling (%)
Physical Activity - People doing vigorous-intensity recreational activities (%)
Physical Activity - People doing moderate-intensity recreational activities (%)
Physical Activity - Average hours a day doing sedentary activities
Physical Activity - Average hours a day watching TV or videos
Physical Activity - Average hours a day using computer
Physical Functioning - People having limitations keeping them from working (%)
Physical Functioning - People limited in amount of work they can do (%)
Physical Functioning - People that need special equipment to walk (%)
Physical Functioning - People experiencing confusion/memory problems (%)
Physical Functioning - People requiring special healthcare equipment (%)
Prescription Medications - Average number of prescription medicines taking
Preventive Aspirin Use - Adults 40+ taking low-dose aspirin (%)
Reproductive Health - Vaginal deliveries (%)
Reproductive Health - Cesarean deliveries (%)
Reproductive Health - Deliveries resulted in a live birth (%)
Reproductive Health - Pregnancies resulted in a delivery (%)
Reproductive Health - Women breastfeeding newborns (%)
Reproductive Health - Women that had a hysterectomy (%)
Reproductive Health - Women that had both ovaries removed (%)
Reproductive Health - Women that have ever taken birth control pills (%)
Reproductive Health - Women taking birth control pills (%)
Reproductive Health - Women that have ever used Depo-Provera or injectables (%)
Reproductive Health - Women that have ever used female hormones (%)
Sexual Behavior - People 18+ that ever had sex (vaginal, anal, or oral) (%)
Sexual Behavior - Males 18+ that ever had vaginal sex with a woman (%)
Sexual Behavior - Males 18+ that ever performed oral sex on a woman (%)
Sexual Behavior - Males 18+ that ever had anal sex with a woman (%)
Sexual Behavior - Males 18+ that ever had any sex with a man (%)
Sexual Behavior - Females 18+ that ever had vaginal sex with a man (%)
Sexual Behavior - Females 18+ that ever performed oral sex on a man (%)
Sexual Behavior - Females 18+ that ever had anal sex with a man (%)
Sexual Behavior - Females 18+ that ever had any kind of sex with a woman (%)
Sexual Behavior - Average age people first had sex
Sexual Behavior - Average number of female sex partners in lifetime (males 18+)
Sexual Behavior - Average number of female vaginal sex partners in lifetime (males 18+)
Sexual Behavior - Average age people first performed oral sex on a woman (18+)
Sexual Behavior - Average number of woman performed oral sex on in lifetime (18+)
Sexual Behavior - Average number of male sex partners in lifetime (males 18+)
Sexual Behavior - Average number of male anal sex partners in lifetime (males 18+)
Sexual Behavior - Average age people first performed oral sex on a man (18+)
Sexual Behavior - Average number of male oral sex partners in lifetime (18+)
Sexual Behavior - People using protection when performing oral sex (%)
Sexual Behavior - Average number of times people have vaginal or anal sex a year
Sexual Behavior - People having sex without condom (%)
Sexual Behavior - Average number of male sex partners in lifetime (females 18+)
Sexual Behavior - Average number of male vaginal sex partners in lifetime (females 18+)
Sexual Behavior - Average number of female sex partners in lifetime (females 18+)
Sexual Behavior - Circumcised males 18+ (%)
Sleep Disorders - Average hours sleeping at night
Sleep Disorders - People that has trouble sleeping (%)
Smoking-Cigarette Use - People smoking cigarettes (%)
Taste & Smell - People 40+ having problems with smell (%)
Taste & Smell - People 40+ having problems with taste (%)
Taste & Smell - People 40+ that ever had wisdom teeth removed (%)
Taste & Smell - People 40+ that ever had tonsils teeth removed (%)
Taste & Smell - People 40+ that ever had a loss of consciousness because of a head injury (%)
Taste & Smell - People 40+ that ever had a broken nose or other serious injury to face or skull (%)
Taste & Smell - People 40+ that ever had two or more sinus infections (%)
Weight - Average height (inches)
Weight - Average weight (pounds)
Weight - Average BMI
Weight - People that are obese (%)
Weight - People that ever were obese (%)
Weight - People trying to lose weight (%)
Officers per 1,000 residents here:
2.23Illinois average:
2.84
Latest news from Jacksonville, IL collected exclusively by city-data.com from local newspapers, TV, and radio stations
Ancestries: German (18.0%), English (13.1%), American (8.4%), Irish (6.6%), Italian (2.5%), French (2.2%).
Current Local Time:
Incorporated on 04/11/1887
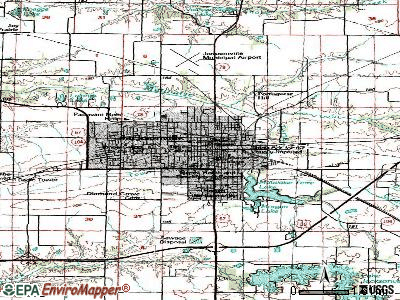
Land area: 10.1 square miles.
Population density: 1,705 people per square mile (low).
178 residents are foreign born
This city:
1.0%Illinois:
14.1%
Median real estate property taxes paid for housing units with mortgages in 2022: $2,446 (2.1%)Median real estate property taxes paid for housing units with no mortgage in 2022: $2,496 (1.7%)
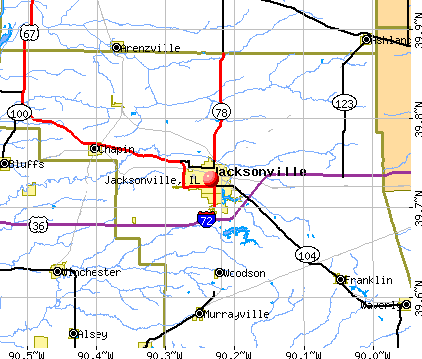
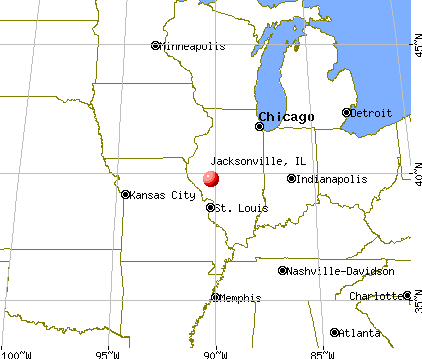
Nearest city with pop. 50,000+: Springfield, IL
Nearest city with pop. 200,000+: St. Louis, MO
Nearest city with pop. 1,000,000+: Chicago, IL
Nearest cities:
Lynnville, IL (2.6 miles),
Concord, IL (3.0 miles),
Latitude: 39.73 N, Longitude: 90.23 W
Daytime population change due to commuting: +4,309 (+24.8%)Workers who live and work in this city: 5,725 (78.5%)
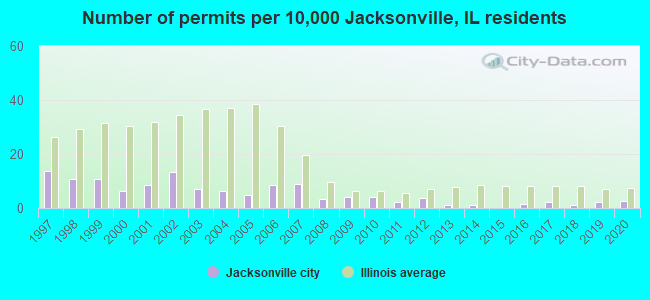
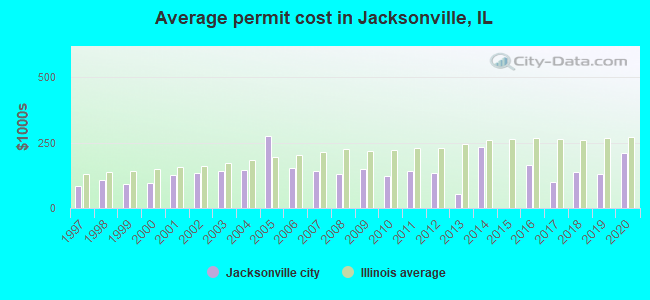
Single-family new house construction building permits:
2020: 5 buildings , average cost: $211,3002019: 4 buildings , average cost: $129,8002018: 2 buildings , average cost: $137,0002017: 4 buildings , average cost: $100,7002016: 3 buildings , average cost: $162,7002014: 2 buildings , average cost: $234,1002013: 2 buildings , average cost: $51,7002012: 7 buildings , average cost: $134,1002011: 4 buildings , average cost: $140,6002010: 8 buildings , average cost: $123,9002009: 8 buildings , average cost: $149,8002008: 6 buildings , average cost: $129,5002007: 17 buildings , average cost: $142,3002006: 16 buildings , average cost: $150,8002005: 9 buildings , average cost: $275,1002004: 12 buildings , average cost: $144,7002003: 13 buildings , average cost: $141,7002002: 25 buildings , average cost: $133,3002001: 16 buildings , average cost: $126,7002000: 12 buildings , average cost: $97,3001999: 20 buildings , average cost: $93,3001998: 20 buildings , average cost: $107,8001997: 26 buildings , average cost: $82,800Unemployment in December 2023:
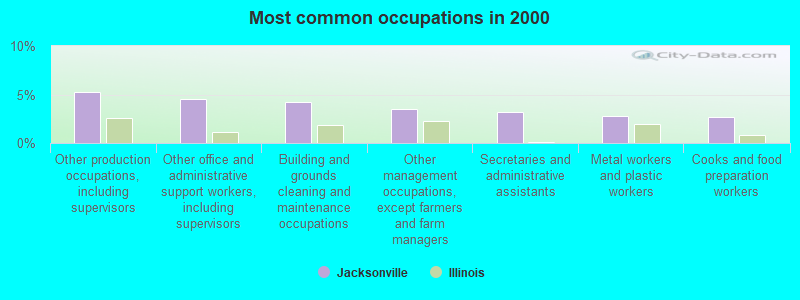
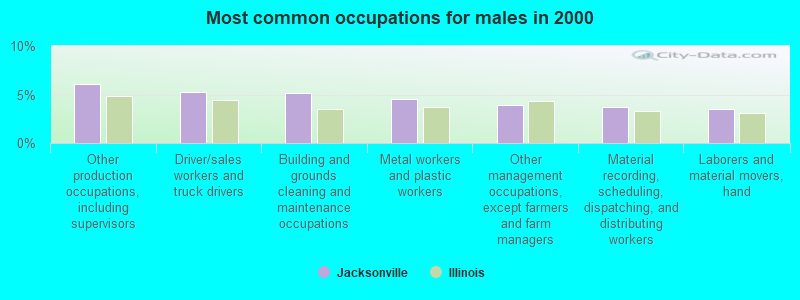
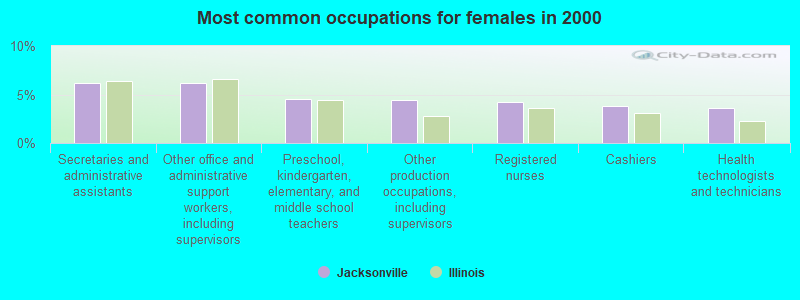
Most common occupations in Jacksonville, IL (%)
Both Males Females
Other production occupations, including supervisors (5.2%)
Other office and administrative support workers, including supervisors (4.5%)
Building and grounds cleaning and maintenance occupations (4.2%)
Other management occupations, except farmers and farm managers (3.5%)
Secretaries and administrative assistants (3.2%)
Metal workers and plastic workers (2.8%)
Cooks and food preparation workers (2.7%)
Other production occupations, including supervisors (6.0%)
Driver/sales workers and truck drivers (5.3%)
Building and grounds cleaning and maintenance occupations (5.2%)
Metal workers and plastic workers (4.5%)
Other management occupations, except farmers and farm managers (3.9%)
Material recording, scheduling, dispatching, and distributing workers (3.7%)
Laborers and material movers, hand (3.5%)
Secretaries and administrative assistants (6.2%)
Other office and administrative support workers, including supervisors (6.2%)
Preschool, kindergarten, elementary, and middle school teachers (4.5%)
Other production occupations, including supervisors (4.4%)
Registered nurses (4.2%)
Cashiers (3.8%)
Health technologists and technicians (3.6%)
Tornado activity:
Jacksonville-area historical tornado activity is near Illinois state average. It is 69% greater than the overall U.S. average.
On 6/14/1957, a category F4 (max. wind speeds 207-260 mph) tornado 28.4 miles away from the Jacksonville city center killed 2 people and injured 50 people and caused between $500,000 and $5,000,000 in damages.
On 4/24/1961, a category F3 (max. wind speeds 158-206 mph) tornado 18.8 miles away from the city center injured 3 people and caused between $50,000 and $500,000 in damages.
Earthquake activity:
Jacksonville-area historical earthquake activity is significantly above Illinois state average. It is 242% greater than the overall U.S. average. On 4/18/2008 at 09:36:59, a magnitude 5.4 (5.1 MB, 4.8 MS, 5.4 MW, 5.2 MW, Class: Moderate, Intensity: VI - VII) earthquake occurred 154.0 miles away from the city center On 4/18/2008 at 09:36:59, a magnitude 5.2 (5.2 MW, Depth: 8.9 mi) earthquake occurred 154.1 miles away from Jacksonville center On 6/10/1987 at 23:48:54, a magnitude 5.1 (4.9 MB, 4.4 MS, 4.6 MS, 5.1 LG) earthquake occurred 140.7 miles away from the city center On 6/18/2002 at 17:37:15, a magnitude 5.0 (4.3 MB, 4.6 MW, 5.0 LG) earthquake occurred 179.0 miles away from Jacksonville center On 9/26/1990 at 13:18:51, a magnitude 5.0 (4.7 MB, 4.8 LG, 5.0 LG, Depth: 7.7 mi) earthquake occurred 181.4 miles away from the city center On 4/18/2008 at 15:14:16, a magnitude 4.8 (4.5 MB, 4.8 MW, 4.6 MW, Class: Light, Intensity: IV - V) earthquake occurred 154.8 miles away from the city center Magnitude types: regional Lg-wave magnitude (LG), body-wave magnitude (MB), surface-wave magnitude (MS), moment magnitude (MW) Natural disasters: The number of natural disasters in Morgan County (14) is near the US average (15).Major Disasters (Presidential) Declared: 10Emergencies Declared: 2Storms: 11, Floods: 9, Tornadoes: 3, Hurricane: 1, Snow: 1, Snowstorm: 1, Wind: 1, Winter Storm: 1, Other: 1 (Note: some incidents may be assigned to more than one category). Main business address for: JACKSONVILLE BANCORP INC SAVINGS INSTITUTIONS, NOT FEDERALLY CHARTERED ).
Hospitals in Jacksonville: ALVIN EADES CENTER (1000A WEST MICHIGAN) ANNA TERRACE (408 ANNA STREET) CAMPBELL COURT (426 E. DOUGLAS) DOUGLAS TERRACE (324 EAST DOUGLAS AVENUE) EISENHOWER TERRACE (#2 EISENHOWER DRIVE) JACKSONVILLE DEVELOPMENTAL CTR (1201 SOUTH MAIN STREET) LAFAYETTE TERRACE (826 WEST LAFAYETTE) PASSAVANT AREA HOSPITAL (Voluntary non-profit - Private, 1600 W WALNUT ST) PRAIRIE COUNTIES HOSPICE (1600 W WALNUT, PO BOX 276) Nursing Homes in Jacksonville: A R C OF JACKSONVILLE, LTD, THE ("1320 TENDICK, P O BOX 1115") HERITAGE HEALTH-JACKSONVILLE (873 GROVE STREET) JACKSONVILLE SKILLED NURSING AND REHAB (1517 WEST WALNUT STREET) MODERN CARE CONVALESCENT AND NURSING (1500 WEST WALNUT) NORTH CHURCH NURSING AND REHAB (1021 NORTH CHURCH STREET) PRAIRIE VILLAGE HEALTHCARE CTR (1024 WEST WALNUT) Dialysis Facilities in Jacksonville: JACKSONVILLE DIALYSIS (1515 W WALNUT ST., # 11 DOCTORS PLAZA)
Colleges/Universities in Jacksonville: Illinois College Full-time enrollment: 1,039; Location: 1101 W College Ave; Private, not-for-profit; Website: www.ic.edu; Offers Master's degree )
MacMurray College Full-time enrollment: 562; Location: 447 East College Ave; Private, not-for-profit; Website: www.mac.edu)
Mr John's School of Cosmetology Esthetics & Nails-Jacksonville Full-time enrollment: 49; Location: 1429 S Main St, Ste F; Private, for-profit; Website: mrjohns.com)
Colleges/universities with over 2000 students nearest to Jacksonville:
University of Illinois at Springfield (about 33 miles; Springfield, IL ; Full-time enrollment: 3,748)
Lincoln Land Community College (about 34 miles; Springfield, IL ; FT enrollment: 5,460)
Lewis and Clark Community College (about 54 miles; Godfrey, IL ; FT enrollment: 4,189)
Western Illinois University (about 57 miles; Macomb, IL ; FT enrollment: 10,755)
Southern Illinois University-Edwardsville (about 67 miles; Edwardsville, IL ; FT enrollment: 11,933)
Lindenwood University (about 67 miles; Saint Charles, MO ; FT enrollment: 11,117)
Millikin University (about 68 miles; Decatur, IL ; FT enrollment: 2,419)
Public high schools in Jacksonville: JACKSONVILLE HIGH SCHOOL Students: 1,011, Location: 1211 N DIAMOND ST, Grades: 9-12)IVAN K GARRISON CENTER Students: 78, Location: 936 W MICHIGAN AVE, Grades: 3-12)ARC Students: 7, Location: 747 W LAFAYETTE AVE, Grades: 6-12)THE LAFAYETTE ACADEMY Location: 747 W LAFAYETTE AVE, Grades: 9-12)
Private high schools in Jacksonville: ROUTT CATHOLIC HIGH SCHOOL Students: 117, Location: 500 E COLLEGE AVE, Grades: 9-12)
WESTFAIR CHRISTIAN ACADEMY Students: 81, Location: 14 CLARKE DR, Grades: PK-12)
Public elementary/middle schools in Jacksonville: JONATHAN TURNER JR HIGH SCHOOL Students: 562, Location: 664 LINCOLN AVE, Grades: 7-8)EISENHOWER ELEM SCHOOL Students: 369, Location: 1901 W LAFAYETTE AVE, Grades: KG-6)NORTH JACKSONVILLE SCHOOL Students: 254, Location: 1626 STATE HIGHWAY 78 N, Grades: KG-6)WASHINGTON ELEM SCHOOL Students: 250, Location: 524 S KOSCIUSKO ST, Grades: KG-6)LINCOLN ELEM SCHOOL Location: 320 W INDEPENDENCE AVE, Grades: KG-6)
8 POINTS CHARTER SCHOOL Location: 630 E STATE ST, Grades: 5-8, Charter school )
Private elementary/middle schools in Jacksonville: OUR SAVIOUR SCHOOL Students: 254, Location: 455 E STATE ST, Grades: KG-8)
SALEM LUTHERAN SCHOOL Students: 142, Location: 222 E BEECHER, Grades: PK-8)
See full list of schools located in Jacksonville Library in Jacksonville: JACKSONVILLE PUBLIC LIBRARY Operating income: $743,605; Location: 201 WEST COLLEGE AVENUE; 87,233 books ; 4,624 audio materials ; 4,024 video materials ; 3 local licensed databases ; 18 state licensed databases ; 1 other licensed databases ; 123 print serial subscriptions )
Notable locations in Jacksonville: (A) , Jacksonville Country Club (B) , Jacksonville Golf Course (C) , Ann Rutledge Hall (D) , Baxter Hall (E) , Beecher Hall (F) , Crampton Hall (G) , Crispin Hall (H) , Henry Pfeiffer Library (I) , Illinois Christian Home for the Aged (J) , Irma Latzer Gamble Center (K) , Jane Hall (L) , Jones Memorial Hall (M) , Kathryn Hall (N) , MacMurray Hall (O) , McClelland Hall (P) , Morgan County Jail (Q) , Strawn Art Gallery (R) , Sturtevant Hall (S) , Tanner Library (T) . Display/hide their locations on the map
Shopping Center: (1) . Display/hide its location on the map
Main business address in Jacksonville: (A) . Display/hide its location on the map
Churches in Jacksonville include: (A) , Brooklyn United Methodist Church (B) , Calvary Baptist Church (C) , Centenary United Methodist Church (D) , Central Christian Church (E) , Christ Lutheran Church (F) , Church of Christ (G) , First Christian Church (H) , First Church of Christ Scientist (I) . Display/hide their locations on the map
Cemeteries: (1) , South Fork Mauvaise Terre Cemetery (2) . Display/hide their locations on the map
Reservoirs: (A) , Mauvaise Terre Lake (B) . Display/hide their locations on the map
Parks in Jacksonville include: (1) , Foreman Park (2) , Jacksonville Historic District (3) , Kiwanis Park (4) , Barr Park (5) , Duncan Park (6) , Morgan County Fairground (7) , Nichols Park (8) . Display/hide their locations on the map
Tourist attractions: (1) , Heritage Cultural Center (Cultural Attractions- Events- & Facilities; 200 West Douglas Avenue) (2) , Eight Wheeler Roller Rink (Amusement & Theme Parks; 1204 Lincoln Avenue) (3) . Display/hide their approximate locations on the map
Hotels: (1) , Econo Lodge Inn & Suites (1914 Southbrooke Rd) (2) , Comfort Inn South Jacksonville (200 Comfort Drive) (3) , Amerihost Inn-Jacksonville (1709 West Morton Avenue) (4) , Hampton Inn (1725 West Morton Avenue) (5) . Display/hide their approximate locations on the map
Court: (1) . Display/hide its approximate location on the map
Birthplace of: Ken Norton - Boxer, Alfred Sturtevant - Geneticist, Frank Reaugh - Artist, J. Edward Day - Layer and politician, Ken Norton, Jr. - Football player and coach, Mabel Holle - Girls Professional Baseball League player, Mary Louise Preis - Politician, Milton McPike - Educator, Randy Bettis - Musician, Ruth Bryan Owen - Politician.
Morgan County has a predicted average indoor radon screening level greater than 4 pCi/L (pico curies per liter) - Highest Potential Drinking water stations with addresses in Jacksonville that have no violations reported:
IL SCHOOL FOR DEAF TIGER DEN (Population served: 25, Primary Water Source Type: Groundwater)
Average household size: This city:
2.2 peopleIllinois:
2.6 people
Percentage of family households: This city:
56.7%Whole state:
65.8%
Percentage of households with unmarried partners: This city:
8.6%Whole state:
6.3%
Likely homosexual households (counted as self-reported same-sex unmarried-partner households)
Lesbian couples: 0.4% of all households Gay men: 0.3% of all households
People in group quarters in Jacksonville in 2010:
996 people in state prisons
849 people in college/university student housing
509 people in nursing facilities/skilled-nursing facilities
319 people in group homes intended for adults
288 people in residential schools for people with disabilities
35 people in local jails and other municipal confinement facilities
29 people in residential treatment centers for adults
21 people in other noninstitutional facilities
16 people in group homes for juveniles (non-correctional)
People in group quarters in Jacksonville in 2000:
1,007 people in college dormitories (includes college quarters off campus)
562 people in nursing homes
244 people in schools, hospitals, or wards for the intellectually disabled
203 people in orthopedic wards and institutions for the physically handicapped
121 people in homes for the mentally retarded
66 people in homes for abused, dependent, and neglected children
53 people in other types of correctional institutions
43 people in homes for the physically handicapped
21 people in other group homes
16 people in other noninstitutional group quarters
5 people in homes for the mentally ill
3 people in religious group quarters
Banks with most branches in Jacksonville (2011 data):
Jacksonville Savings Bank: at 1211 West Morton Avenue, South Main Branch, West State St Drive-Up Branch. Info updated 2006/11/03: Bank assets: $307.2 mil, Deposits: $259.3 mil, local headquarters , positive income , 7 total offices
U.S. Bank National Association: Jacksonville North Main Street Drive at 300 North Main Street, branch established on 2010/04/30; West Morton Branch at 322 West Morton Avenue, branch established on 1964/08/14. Info updated 2012/01/30: Bank assets: $330,470.8 mil, Deposits: $236,091.5 mil, headquarters in Cincinnati, OH, positive income , 3121 total offices , Holding Company: U.S. Bancorp
Prairie State Bank and Trust: Morton Street Office at 1052 West Morton Avenue, branch established on 2011/06/17; Jacksonville Branch at 1610 West Lafayette, branch established on 1995/11/27. Info updated 2011/12/20: Bank assets: $633.0 mil, Deposits: $566.9 mil, headquarters in Mount Zion, IL, positive income , Commercial Lending Specialization, 21 total offices , Holding Company: American Central Bancorporation, Inc.
The First National Bank of Arenzville: South Jacksonville Branch at 1904 South Main, branch established on 2000/05/15; West Morton Avenue Branch at 1839 West Morton Avenue, branch established on 2009/09/28. Info updated 2010/06/01: Bank assets: $69.1 mil, Deposits: $63.7 mil, headquarters in Arenzville, IL, positive income , Agricultural Specialization, 3 total offices , Holding Company: Arenzville Bancorp, Inc
The Farmers State Bank and Trust Company: West Morton Road Facility at 1718 West Morton Road, branch established on 1976/12/14; The Farmers State Bank And Trust Com at 200 West State Street, branch established on 1910/01/01. Info updated 2006/11/03: Bank assets: $184.8 mil, Deposits: $154.5 mil, local headquarters , positive income , Commercial Lending Specialization, 2 total offices , Holding Company: Farmers Holding Company
Bank of Springfield: Jacksonville Branch at 303 W. College, branch established on 1961/01/01; Jacksonville Branch at 1701 W. Morton Avenue, branch established on 2000/02/14. Info updated 2010/10/01: Bank assets: $727.9 mil, Deposits: $610.4 mil, headquarters in Springfield, IL, positive income , Commercial Lending Specialization, 9 total offices , Holding Company: Spring Bancorp, Inc.
PNC Bank, National Association: Jacksonville Branch at 1342 South Main Street, branch established on 1981/12/07. Info updated 2012/03/20: Bank assets: $263,309.6 mil, Deposits: $197,343.0 mil, headquarters in Wilmington, DE, positive income , Commercial Lending Specialization, 3085 total offices , Holding Company: Pnc Financial Services Group, Inc., The
Woodforest National Bank: Jacksonville Walmart Branch at 1941 W Morton Ave, branch established on 2008/02/04. Info updated 2011/05/10: Bank assets: $3,488.9 mil, Deposits: $3,097.6 mil, headquarters in Houston, TX, positive income , Commercial Lending Specialization, 766 total offices , Holding Company: Woodforest Financial Group Employee Stock Ownership Plan (With 401(K) Provisions)
Premier Bank of Jacksonville: Premier Bank Of Jacksonville at 1604 West Morton Avenue, branch established on 1873/01/01. Info updated 2006/11/03: Bank assets: $225.7 mil, Deposits: $198.3 mil, local headquarters , positive income , Commercial Lending Specialization, 4 total offices , Holding Company: West Plains Investors, Inc.
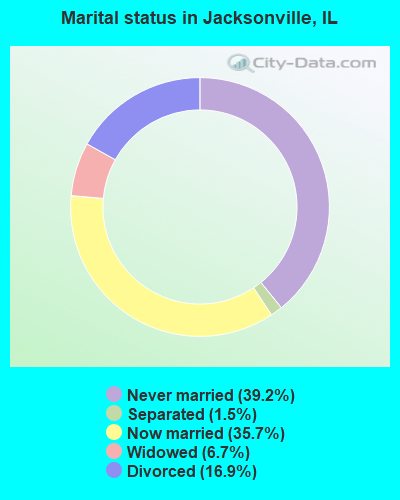
For population 15 years and over in Jacksonville:
Never married: 39.2%Now married: 35.7%Separated: 1.5%Widowed: 6.7%Divorced: 16.9% For population 25 years and over in Jacksonville:
High school or higher: 88.4%Bachelor's degree or higher: 22.4%Graduate or professional degree: 6.3%Unemployed: 8.5%Mean travel time to work (commute): 15.2 minutes
Education Gini index (Inequality in education) Here:
9.9Illinois average:
12.5
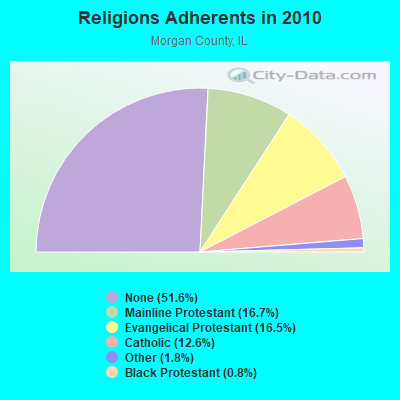
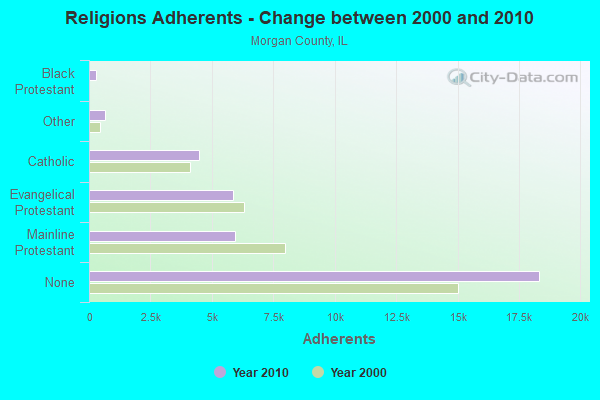
Religion statistics for Jacksonville, IL (based on Morgan County data)
Religion Adherents Congregations Mainline Protestant 5,934 23 Evangelical Protestant 5,851 29 Catholic 4,495 4 Other 635 3 Black Protestant 299 3 None 18,333 -
Source: Clifford Grammich, Kirk Hadaway, Richard Houseal, Dale E.Jones, Alexei Krindatch, Richie Stanley and Richard H.Taylor. 2012. 2010 U.S.Religion Census: Religious Congregations & Membership Study. Association of Statisticians of American Religious Bodies. Jones, Dale E., et al. 2002. Congregations and Membership in the United States 2000. Nashville, TN: Glenmary Research Center. Graphs represent county-level data
Food Environment Statistics: Number of grocery stores : 4This county :
1.13 / 10,000 pop.Illinois :
2.24 / 10,000 pop.
Number of convenience stores (no gas) : 1This county :
0.28 / 10,000 pop.State :
0.75 / 10,000 pop.
Number of convenience stores (with gas) : 19This county :
5.37 / 10,000 pop.State :
2.61 / 10,000 pop.
Number of full-service restaurants : 29Morgan County :
8.20 / 10,000 pop.Illinois :
6.86 / 10,000 pop.
Adult diabetes rate : Morgan County :
8.8%Illinois :
8.3%
Adult obesity rate : This county :
27.4%State :
25.2%
Low-income preschool obesity rate : This county :
6.5%State :
14.5%
Health and Nutrition: Healthy diet rate : This city:
52.3%Illinois:
49.5%
Average overall health of teeth and gums : This city:
50.3%Illinois:
47.2%
Average BMI : This city:
28.1Illinois:
28.6
People feeling badly about themselves : This city:
19.8%Illinois:
20.5%
People not drinking alcohol at all : Jacksonville:
10.1%Illinois:
10.8%
Average hours sleeping at night : Overweight people : This city:
32.9%State:
33.4%
General health condition : This city:
58.6%Illinois:
56.4%
Average condition of hearing : More about Health and Nutrition of Jacksonville, IL Residents
Local government employment and payroll (March 2022)
Function
Full-time employees
Monthly full-time payroll
Average yearly full-time wage
Part-time employees
Monthly part-time payroll
Police Protection - Officers
42 $281,943 $80,555 1 $1,417 Firefighters
28 $186,280 $79,834 0 $0 Other Government Administration
15 $37,560 $30,048 0 $0 Water Supply
15 $83,313 $66,650 0 $0 Parks and Recreation
12 $45,325 $45,325 0 $0 Sewerage
12 $65,577 $65,577 0 $0 Streets and Highways
11 $44,675 $48,736 0 $0 Other and Unallocable
8 $25,683 $38,525 10 $3,000 Financial Administration
6 $10,757 $21,514 0 $0 Police - Other
4 $14,478 $43,434 6 $3,199 Judicial and Legal
2 $14,987 $89,922 0 $0 Fire - Other
1 $3,116 $37,392 0 $0
Totals for Government
156 $813,693 $62,592 17 $7,616
Jacksonville government finances - Expenditure in 2021 (per resident):
Construction - Regular Highways: $116,000 ($6.71)
Financial Administration: $60,000 ($3.47)Parks and Recreation: $24,000 ($1.39)Current Operations - Police Protection: $5,206,000 ($301.29)
Water Utilities: $5,052,000 ($292.38)Local Fire Protection: $3,904,000 ($225.94)Central Staff Services: $3,111,000 ($180.05)Sewerage: $2,189,000 ($126.69)Regular Highways: $1,583,000 ($91.61)Parks and Recreation: $1,545,000 ($89.41)General - Other: $872,000 ($50.47)Libraries: $690,000 ($39.93)Miscellaneous Commercial Activities - Other: $608,000 ($35.19)Protective Inspection and Regulation - Other: $577,000 ($33.39)General - Interest on Debt: $745,000 ($43.12)
Other Capital Outlay - Central Staff Services: $1,018,000 ($58.92)
Police Protection: $29,000 ($1.68)Total Salaries and Wages: $9,550,000 ($552.69)
Jacksonville government finances - Revenue in 2021 (per resident):
Charges - Sewerage: $2,637,000 ($152.61)
Other: $570,000 ($32.99)Parks and Recreation: $313,000 ($18.11)Federal Intergovernmental - Public Welfare: $1,133,000 ($65.57)
Local Intergovernmental - Other: $67,000 ($3.88)
Miscellaneous - Interest Earnings: $736,000 ($42.60)
General Revenue - Other: $219,000 ($12.67)Fines and Forfeits: $111,000 ($6.42)Revenue - Water Utilities: $5,119,000 ($296.26)
State Intergovernmental - General Local Government Support: $6,890,000 ($398.75)
Highways: $1,188,000 ($68.75)Public Welfare: $274,000 ($15.86)Tax - Property: $7,227,000 ($418.25)
General Sales and Gross Receipts: $1,959,000 ($113.37)Public Utilities Sales: $889,000 ($51.45)Other License: $300,000 ($17.36)Other Selective Sales: $248,000 ($14.35)
Jacksonville government finances - Debt in 2021 (per resident):
Long Term Debt - Beginning Outstanding - Unspecified Public Purpose: $31,093,000 ($1799.47)
Outstanding Unspecified Public Purpose: $29,465,000 ($1705.25)Retired Unspecified Public Purpose: $1,628,000 ($94.22)
Jacksonville government finances - Cash and Securities in 2021 (per resident):
Other Funds - Cash and Securities: $32,954,000 ($1907.17)
Businesses in Jacksonville, IL
Name Count Name Count
ALDI 1 La-Z-Boy 1 AT&T 1 Long John Silver's 1 Ace Hardware 1 MasterBrand Cabinets 7 Applebee's 1 Maurices 1 Arby's 1 McDonald's 1 AutoZone 1 Nike 1 Bath & Body Works 1 Papa John's Pizza 1 Burger King 1 Pizza Hut 1 CVS 1 Quiznos 1 Chevrolet 1 RadioShack 1 Circle K 2 SAS Shoes 1 Curves 1 SONIC Drive-In 1 Dairy Queen 1 Sears 1 Domino's Pizza 1 Slumberland 1 Famous Footwear 1 Staples 1 Fashion Bug 1 Steak 'n Shake 1 FedEx 2 Subway 2 Ford 1 Super 8 1 GNC 1 T-Mobile 1 Goodwill 5 Taco Bell 1 H&R Block 1 U-Haul 2 Hardee's 1 UPS 8 Hilton 1 Vans 1 Holiday Inn 1 Walgreens 2 Home Depot 1 Walmart 1 JCPenney 1 Wendy's 1 Jimmy John's 1 YMCA 1 KFC 1
Strongest AM radio stations in Jacksonville:
WLDS (1180 AM; daytime; 1 kW; JACKSONVILLE, IL)
WJIL (1550 AM; 1 kW; JACKSONVILLE, IL)
KXEN (1010 AM; 50 kW; FESTUS-ST. LOUIS, MO; Owner: BDJ RADIO ENTERPRISES, LLC)
KMOX (1120 AM; 50 kW; ST. LOUIS, MO; Owner: INFINITY BROADCASTING OPERATIONS, INC.)
WSDZ (1260 AM; 20 kW; BELLEVILLE, IL)
WSCR (670 AM; 50 kW; CHICAGO, IL; Owner: INFINITY BROADCASTING OPERATIONS, INC.)
WGN (720 AM; 50 kW; CHICAGO, IL; Owner: WGN CONTINENTAL BROADCASTING CO.)
WLS (890 AM; 50 kW; CHICAGO, IL; Owner: WLS, INC.)
KRFT (1190 AM; 10 kW; DE SOTO, MO; Owner: ALL SPORTS RADIO, LLC)
WBBM (780 AM; 50 kW; CHICAGO, IL; Owner: INFINITY BROADCASTING OPERATIONS, INC.)
KTRS (550 AM; 5 kW; ST. LOUIS, MO; Owner: KTRS-AM LICENSE, L.L.C.)
WYLL (1160 AM; 50 kW; CHICAGO, IL; Owner: SCA LICENSE CORPORATION)
WMVP (1000 AM; 50 kW; CHICAGO, IL; Owner: ABC, INC.)
Strongest FM radio stations in Jacksonville:
W228BB (93.5 FM; JACKSONVILLE, IL; Owner: CORNERSTONE COMMUNITY RADIO, INC.)
WJVO (105.5 FM; SOUTH JACKSONVILLE, IL; Owner: MORGAN COUNTY B/CASTING CO., INC.)
W214AV (90.7 FM; JACKSONVILLE, IL; Owner: ILLINOIS BIBLE INSTITUTE, INC.)
W218BA (91.5 FM; JACKSONVILLE, IL; Owner: ILLINOIS BIBLE INSTITUTE, INC.)
W201BL (88.1 FM; JACKSONVILLE, IL; Owner: BIBLE BROADCASTING NETWORK, INC.)
WEAI (107.1 FM; LYNNVILLE, IL; Owner: JERDON BROADCASTING COMPANY)
WYMG (100.5 FM; JACKSONVILLE, IL; Owner: SAGA COMMUNICATIONS OF ILLINOIS, LLC)
WIPA (89.3 FM; PITTSFIELD, IL; Owner: UNIVERSITY OF IL AT SPRINGFIELD)
WVIL (101.3 FM; VIRGINIA, IL; Owner: MARK J. LANGSTON)
WDBR (103.7 FM; SPRINGFIELD, IL; Owner: SAGA COMMUNICATIONS OF ILLINOIS, LLC)
WNNS (98.7 FM; SPRINGFIELD, IL; Owner: LONG NINE, INC.)
W202AV (88.3 FM; WHITE HALL, IL; Owner: THE MOODY BIBLE INSTITUTE OF CHICAGO)
WRLJ (88.3 FM; WHITE HALL, IL; Owner: CORNERSTONE COMMUNITY RADIO, INC)
TV broadcast stations around Jacksonville:
WSEC (Channel 14; JACKSONVILLE, IL; Owner: WEST CENTRAL ILLINOIS EDUCATIONAL TELECOMMUNICATIONS CORP.)
WICS (Channel 20; SPRINGFIELD, IL; Owner: WICS LICENSEE, LLC)
WRSP-TV (Channel 55; SPRINGFIELD, IL; Owner: SPRINGFIELD BROADCASTING PARTNERS)
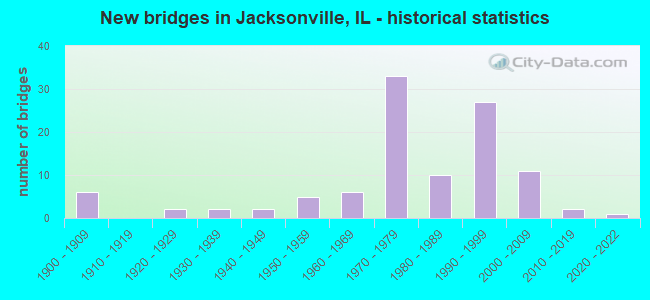
National Bridge Inventory (NBI) Statistics 107 Number of bridges1,070ft / 326m Total length $1,148,000 Total costs344,000 Total average daily traffic61,192 Total average daily truck traffic
New bridges - historical statistics
6 1900-1909 2 1920-1929 2 1930-1939 2 1940-1949 5 1950-1959 6 1960-1969 33 1970-1979 10 1980-1989 27 1990-1999 11 2000-2009 2 2010-2019 1 2020-2022
See full National Bridge Inventory statistics for Jacksonville, IL
Fire-safe hotels and motels in Jacksonville, Illinois:
Blackhawk Motel, 1111 E Morton Ave, Jacksonville, Illinois 62650 Phone: (217) 245-2187, Fax: (217) 245-3663
Best Western, 1709 W Morton, Jacksonville, Illinois 62650 Phone: (217) 245-4500
Baymont Inn & Suites, 1914 Southbrooke Rd, Jacksonville, Illinois 62650 Phone: (217) 271-1326, Fax: (217) 271-1326
Hampton Inn, 1725 W Morton Ave, Jacksonville, Illinois 62650 Phone: (217) 291-0415, Fax: (217) 291-0414
Holiday Inn Express Jacksonville, 2501 Holliday Ln, Jacksonville, Illinois 62650 Phone: (217) 245-6500, Fax: (217) 245-6550
SLEEP INN & SUITES, 2401 N HOLIDAY Ln, Jacksonville, Illinois 62650 Phone: (877) 424-6423
All 6 fire-safe hotels and motels in Jacksonville, Illinois
Most common first names in Jacksonville, IL among deceased individuals Name Count Lived (average)
Mary 301 80.1 years John 280 75.1 years William 263 75.7 years James 228 73.8 years Robert 181 72.3 years Charles 173 76.5 years Helen 172 81.2 years Margaret 155 82.1 years George 150 75.6 years Dorothy 131 80.3 years
Most common last names in Jacksonville, IL among deceased individuals Last name Count Lived (average)
Smith 162 77.0 years Johnson 72 76.5 years Brown 71 74.0 years Wilson 59 79.4 years Davis 55 78.9 years Williams 49 75.5 years Jackson 42 70.3 years Scott 41 78.6 years Lewis 40 79.7 years Turner 39 70.5 years
Jacksonville compared to Illinois state average:
Median house value below state average. Unemployed percentage below state average. Black race population percentage below state average. Hispanic race population percentage significantly below state average. Foreign-born population percentage significantly below state average. Length of stay since moving in significantly above state average. Institutionalized population percentage significantly above state average. Jacksonville on our top lists :
#24 on the list of "Top 101 cities with the largest percentage of people in orthopedic wards and institutions for the physically handicapped (population 1,000+)"
#49 on the list of "Top 101 cities with the largest percentage of people in schools, hospitals, or wards for the mentally retarded (population 1,000+)"
#69 on the list of "Top 101 cities with the largest percentage of people in homes for abused, dependent, and neglected children (population 1,000+)"
#89 on the list of "Top 101 cities with the largest percentage of people in homes for the physically handicapped (population 1,000+)"
#94 on the list of "Top 101 cities with the largest percentage of people in other types of correctional institutions (population 1,000+)"
Top Patent Applicants
Richard W. Brahler, Ii (3)
Glenn Frederick Heidinger (2)
Richard W. Brahler (2)
Jeremy Turner (2)
Glenn F. Heidinger (1)
Steven P. Long (1)
J. Scott Steckenrider (1)
Lori L. Quigg (1)
Ross E. Monk (1)
Jeff Alexander (1)
Total of 15 patent applications in 2008-2024.


 Recent articles from our blog. Our writers, many of them Ph.D. graduates or candidates, create easy-to-read articles on a wide variety of topics.

 (31.3 miles
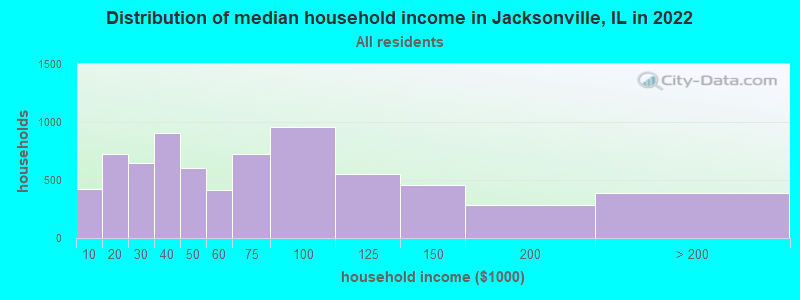


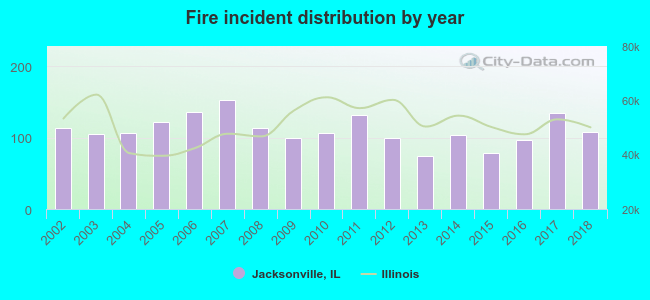 Based on the data from the years 2002 - 2018 the average number of fire incidents per year is 111. The highest number of reported fire incidents - 152 took place in 2007, and the least - 74 in 2013. The data has a dropping trend.
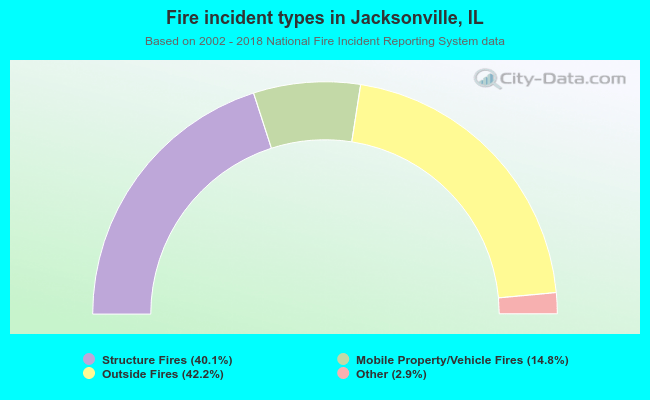 When looking into fire subcategories, the most incidents belonged to: Outside Fires (42.2%), and Structure Fires (40.1%).