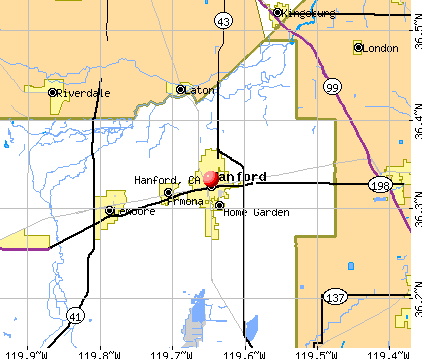
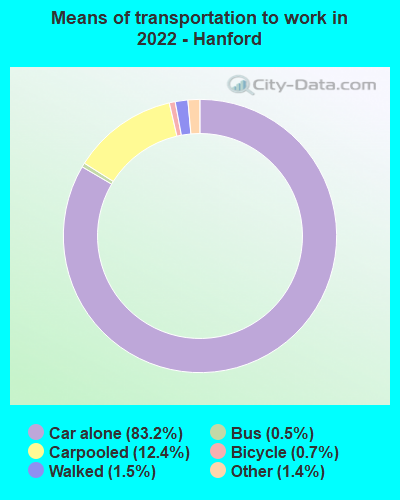
Hanford, California
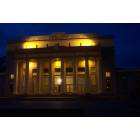
Hanford: Civic Auditorium at night
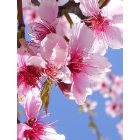
Hanford: Peach blossoms in an orchard on 12th Ave near Elder Ave Hanford.
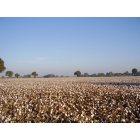
Hanford: Cotton field on Grangeville Blvd outside of Hanford CA.
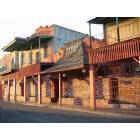
Hanford: China Alley
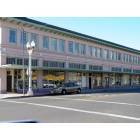
Hanford: Downtown Hanford
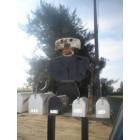
Hanford: Neighborhood friend
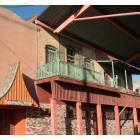
Hanford: Historic China Alley
- add
your
Submit your own pictures of this city and show them to the world
- OSM Map
- General Map
- Google Map
- MSN Map
Population change since 2000: +40.3%
| Males: 29,965 | |
| Females: 28,505 |
| Median resident age: | 32.5 years |
| California median age: | 37.9 years |
Zip codes: 93230.
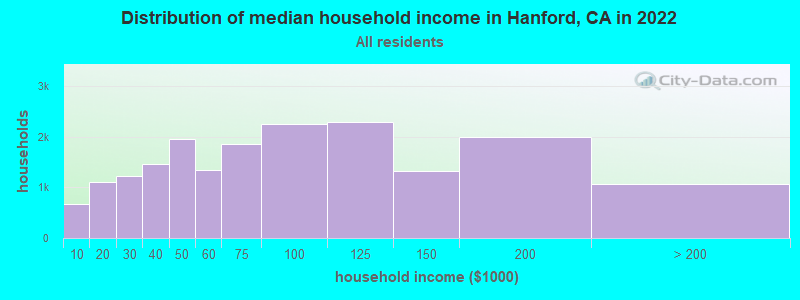
| Hanford: | $69,326 |
| CA: | $91,551 |
Estimated per capita income in 2022: $31,040 (it was $17,504 in 2000)
Hanford city income, earnings, and wages data
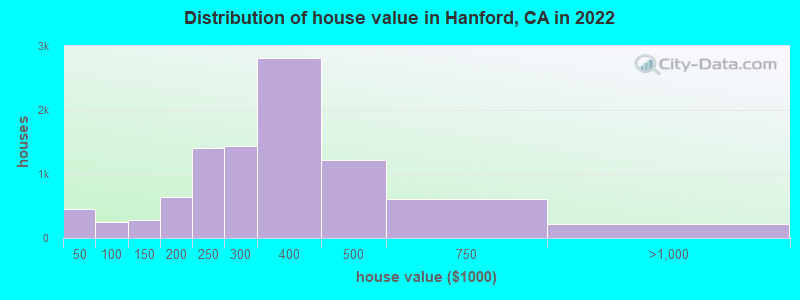
Estimated median house or condo value in 2022: $312,912 (it was $100,800 in 2000)
| Hanford: | $312,912 |
| CA: | $715,900 |
Mean prices in 2022: all housing units: $340,062; detached houses: $349,499; townhouses or other attached units: $429,846; in 2-unit structures: $162,680; in 3-to-4-unit structures: $324,474; in 5-or-more-unit structures: $247,369; mobile homes: $164,554; occupied boats, rvs, vans, etc.: $59,698
Median gross rent in 2022: $1,392.
(7.7% for White Non-Hispanic residents, 24.5% for Black residents, 18.6% for Hispanic or Latino residents, 41.6% for American Indian residents, 16.5% for Native Hawaiian and other Pacific Islander residents, 22.2% for other race residents, 15.6% for two or more races residents)
Detailed information about poverty and poor residents in Hanford, CA


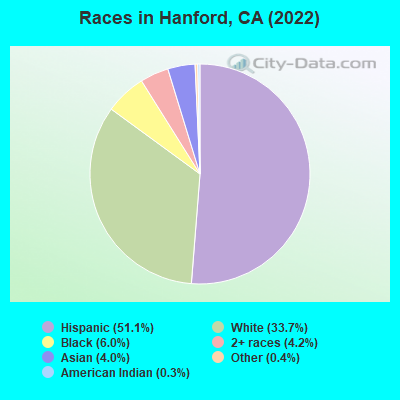
- 29,70351.1%Hispanic
- 19,55633.7%White alone
- 3,4846.0%Black alone
- 2,4424.2%Two or more races
- 2,3434.0%Asian alone
- 2330.4%Other race alone
- 1640.3%American Indian alone
- 520.09%Native Hawaiian and Other
Pacific Islander alone
According to our research of California and other state lists, there were 225 registered sex offenders living in Hanford, California as of May 23, 2024.
The ratio of all residents to sex offenders in Hanford is 243 to 1.
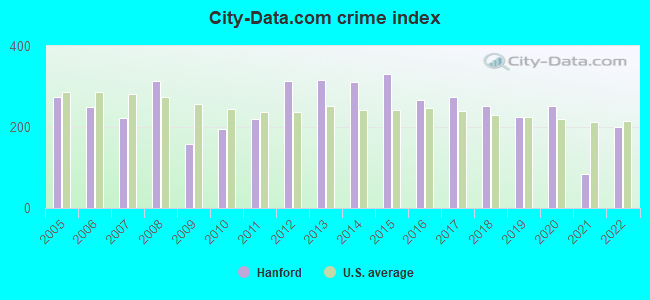
The City-Data.com crime index weighs serious crimes and violent crimes more heavily. Higher means more crime, U.S. average is 246.1. It adjusts for the number of visitors and daily workers commuting into cities.
- means the value is smaller than the state average.- means the value is about the same as the state average.
- means the value is bigger than the state average.
- means the value is much bigger than the state average.
Crime rate in Hanford detailed stats: murders, rapes, robberies, assaults, burglaries, thefts, arson
Full-time law enforcement employees in 2021, including police officers: 85 (59 officers - 52 male; 7 female).
| Officers per 1,000 residents here: | 1.00 |
| California average: | 2.30 |
 Recent articles from our blog. Our writers, many of them Ph.D. graduates or candidates, create easy-to-read articles on a wide variety of topics.

 | Hanford, California- Faraday Future (9 replies) |
| San Joaquin Valley Gentrification thread(Fresno, Merced, Stockton, Bakersfield) (347 replies) |
| Coronavirus (12544 replies) |
| Can we get a Central Valley Bakersfield-Fresno-Stockton forum in this joint? (62 replies) |
| Why does SoCal have so many Covid-19 cases vs. NorCal? (53 replies) |
| Hanford or Visalia? (6 replies) |
Latest news from Hanford, CA collected exclusively by city-data.com from local newspapers, TV, and radio stations
Ancestries: Portuguese (4.9%), Irish (2.8%), German (2.6%), English (2.0%), European (1.9%), American (1.8%).
Current Local Time: PST time zone
Elevation: 247 feet
Land area: 13.1 square miles.
Population density: 4,467 people per square mile (average).
8,696 residents are foreign born (11.0% Latin America, 2.5% Asia).
| This city: | 15.0% |
| California: | 26.5% |
Median real estate property taxes paid for housing units with mortgages in 2022: $2,575 (0.8%)
Median real estate property taxes paid for housing units with no mortgage in 2022: $1,855 (0.7%)
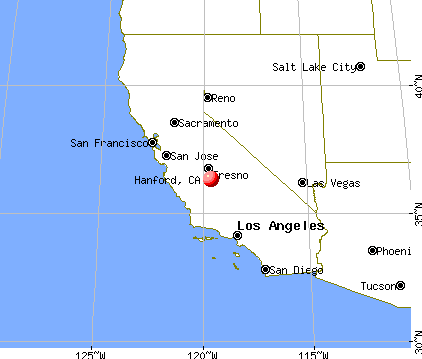
Nearest city with pop. 50,000+: Visalia, CA  (18.9 miles , pop. 91,565).
Nearest city with pop. 200,000+: Fresno, CA (32.0 miles , pop. 427,652).
Nearest city with pop. 1,000,000+: Los Angeles, CA (171.2 miles , pop. 3,694,820).
Nearest cities:
), ), ), Latitude: 36.33 N, Longitude: 119.65 W
Daytime population change due to commuting: -2,474 (-4.3%)
Workers who live and work in this city: 10,204 (41.6%)
Area code: 559

Hanford, California accommodation & food services, waste management - Economy and Business Data
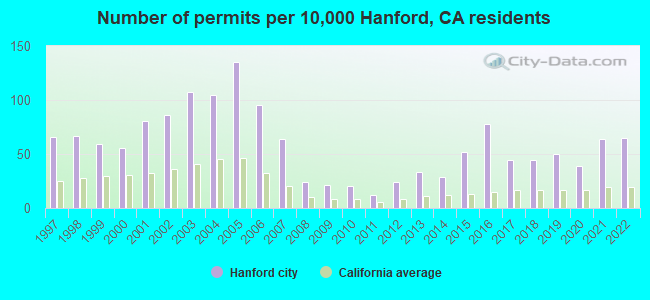
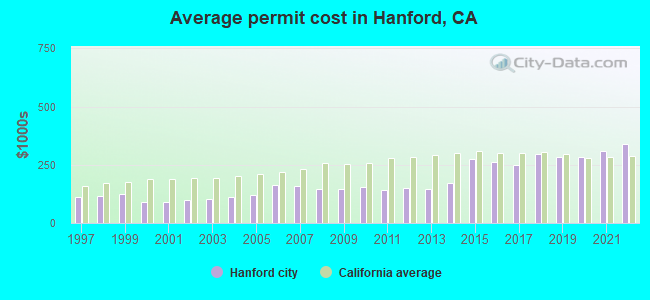
Single-family new house construction building permits:
- 2022: 271 buildings, average cost: $338,500
- 2021: 266 buildings, average cost: $310,000
- 2020: 163 buildings, average cost: $281,600
- 2019: 210 buildings, average cost: $285,200
- 2018: 182 buildings, average cost: $297,900
- 2017: 183 buildings, average cost: $249,900
- 2016: 326 buildings, average cost: $264,000
- 2015: 215 buildings, average cost: $275,400
- 2014: 122 buildings, average cost: $170,000
- 2013: 136 buildings, average cost: $147,400
- 2012: 101 buildings, average cost: $152,400
- 2011: 49 buildings, average cost: $140,200
- 2010: 82 buildings, average cost: $154,900
- 2009: 87 buildings, average cost: $145,500
- 2008: 99 buildings, average cost: $143,700
- 2007: 266 buildings, average cost: $156,800
- 2006: 395 buildings, average cost: $165,100
- 2005: 563 buildings, average cost: $121,700
- 2004: 436 buildings, average cost: $111,300
- 2003: 447 buildings, average cost: $102,000
- 2002: 360 buildings, average cost: $97,400
- 2001: 339 buildings, average cost: $92,300
- 2000: 235 buildings, average cost: $90,600
- 1999: 245 buildings, average cost: $122,900
- 1998: 281 buildings, average cost: $117,800
- 1997: 275 buildings, average cost: $112,200
| Here: | 7.5% |
| California: | 5.1% |
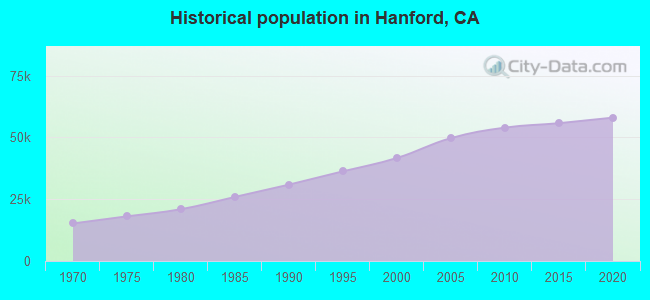
Population change in the 1990s: +11,091 (+36.3%).
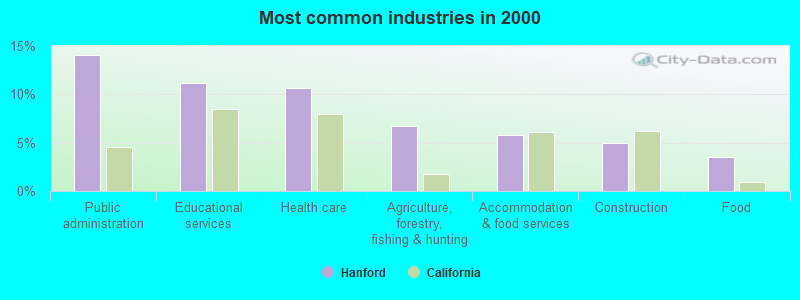
- Public administration (14.1%)
- Educational services (11.2%)
- Health care (10.7%)
- Agriculture, forestry, fishing & hunting (6.7%)
- Accommodation & food services (5.8%)
- Construction (5.0%)
- Food (3.6%)
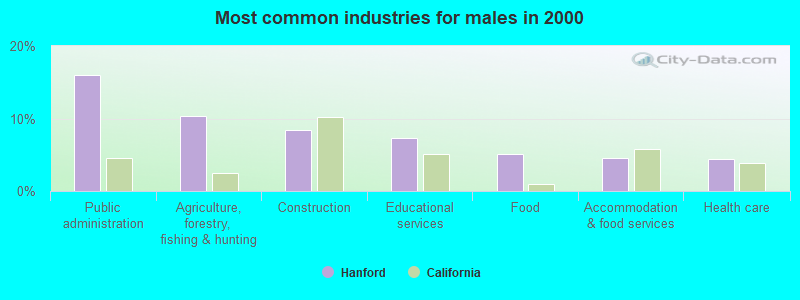
- Public administration (16.0%)
- Agriculture, forestry, fishing & hunting (10.4%)
- Construction (8.5%)
- Educational services (7.3%)
- Food (5.2%)
- Accommodation & food services (4.6%)
- Health care (4.5%)
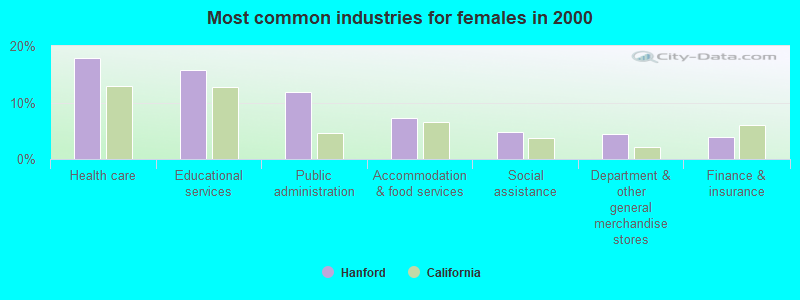
- Health care (17.8%)
- Educational services (15.7%)
- Public administration (11.9%)
- Accommodation & food services (7.2%)
- Social assistance (4.8%)
- Department & other general merchandise stores (4.4%)
- Finance & insurance (3.9%)
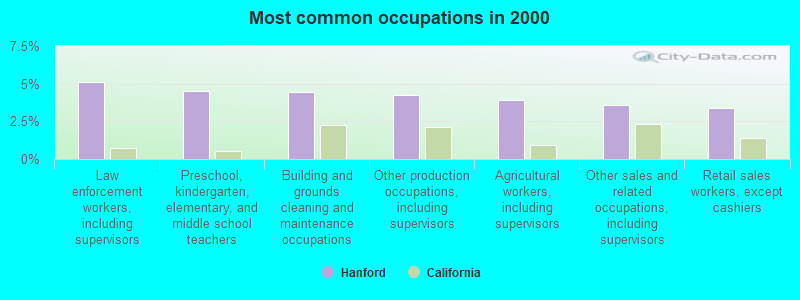
- Law enforcement workers, including supervisors (5.1%)
- Preschool, kindergarten, elementary, and middle school teachers (4.5%)
- Building and grounds cleaning and maintenance occupations (4.4%)
- Other production occupations, including supervisors (4.2%)
- Agricultural workers, including supervisors (3.9%)
- Other sales and related occupations, including supervisors (3.6%)
- Retail sales workers, except cashiers (3.4%)
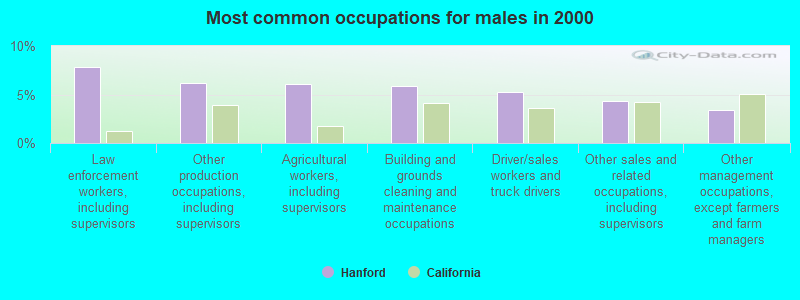
- Law enforcement workers, including supervisors (7.8%)
- Other production occupations, including supervisors (6.1%)
- Agricultural workers, including supervisors (6.1%)
- Building and grounds cleaning and maintenance occupations (5.8%)
- Driver/sales workers and truck drivers (5.3%)
- Other sales and related occupations, including supervisors (4.4%)
- Other management occupations, except farmers and farm managers (3.5%)
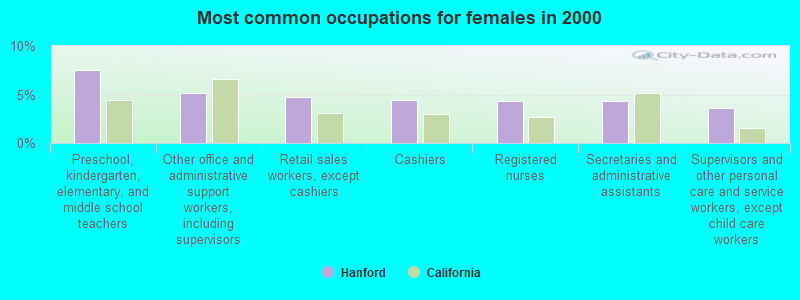
- Preschool, kindergarten, elementary, and middle school teachers (7.5%)
- Other office and administrative support workers, including supervisors (5.2%)
- Retail sales workers, except cashiers (4.7%)
- Cashiers (4.4%)
- Registered nurses (4.4%)
- Secretaries and administrative assistants (4.3%)
- Supervisors and other personal care and service workers, except child care workers (3.6%)
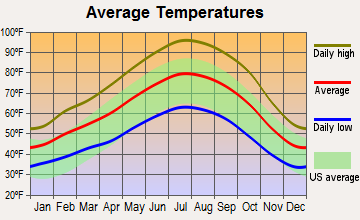
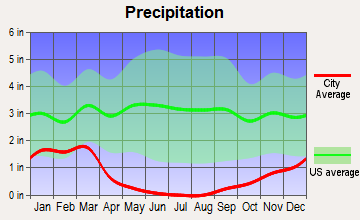
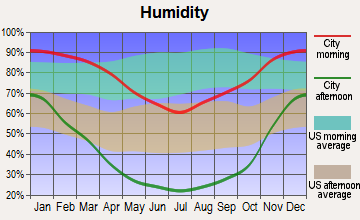
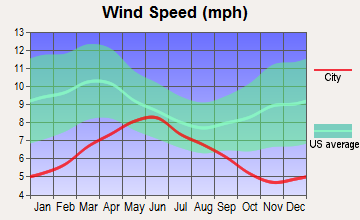
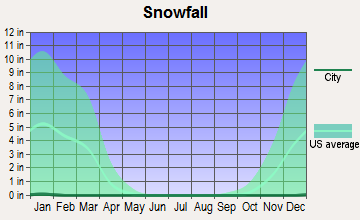
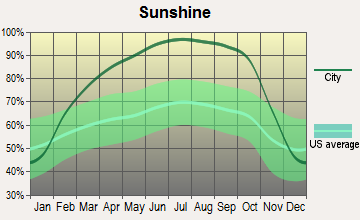
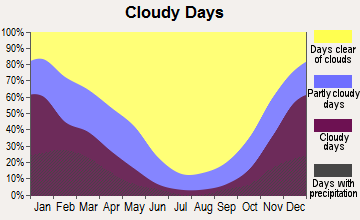
Average climate in Hanford, California
Based on data reported by over 4,000 weather stations
|
|

(lower is better)
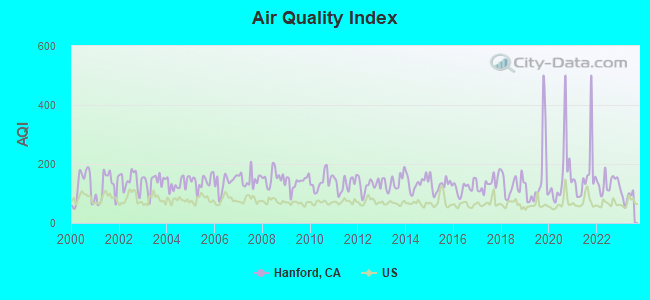
Air Quality Index (AQI) level in 2023 was 89.0. This is worse than average.
| City: | 89.0 |
| U.S.: | 72.6 |
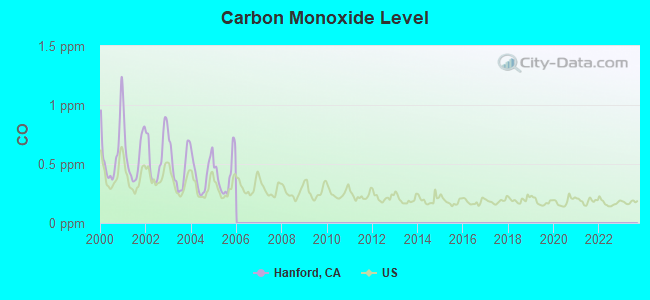
Carbon Monoxide (CO) [ppm] level in 2005 was 0.407. This is significantly worse than average. Closest monitor was 19.8 miles away from the city center.
| City: | 0.407 |
| U.S.: | 0.251 |
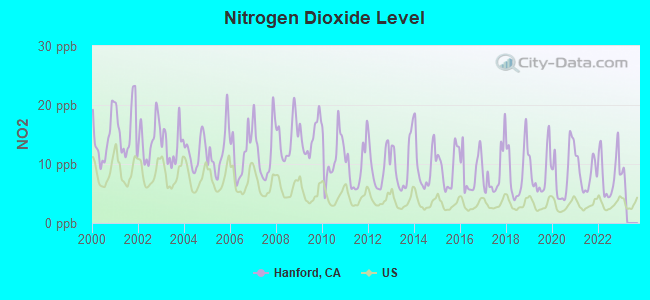
Nitrogen Dioxide (NO2) [ppb] level in 2022 was 8.37. This is significantly worse than average. Closest monitor was 1.2 miles away from the city center.
| City: | 8.37 |
| U.S.: | 5.11 |
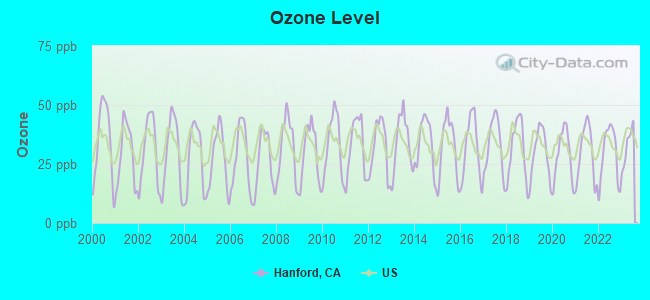
Ozone [ppb] level in 2023 was 32.4. This is about average. Closest monitor was 1.2 miles away from the city center.
| City: | 32.4 |
| U.S.: | 33.3 |
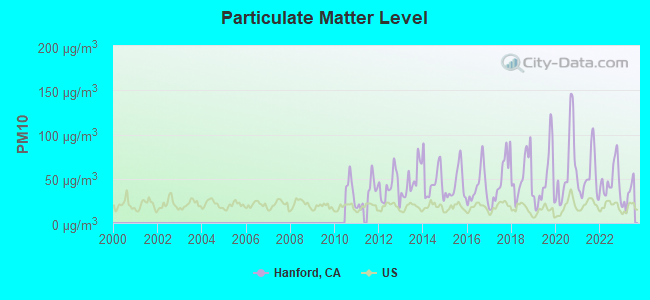
Particulate Matter (PM10) [µg/m3] level in 2023 was 31.8. This is significantly worse than average. Closest monitor was 1.2 miles away from the city center.
| City: | 31.8 |
| U.S.: | 19.2 |
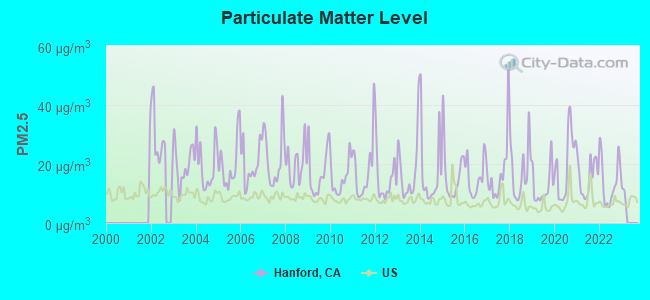
Particulate Matter (PM2.5) [µg/m3] level in 2022 was 14.2. This is significantly worse than average. Closest monitor was 1.2 miles away from the city center.
| City: | 14.2 |
| U.S.: | 8.1 |
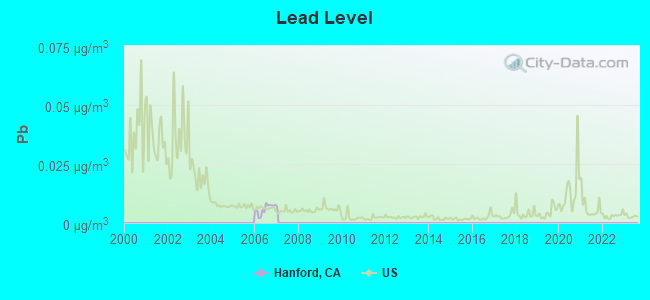
Lead (Pb) [µg/m3] level in 2006 was 0.00590. This is significantly better than average. Closest monitor was 19.8 miles away from the city center.
| City: | 0.00590 |
| U.S.: | 0.00931 |
Earthquake activity:
Hanford-area historical earthquake activity is significantly above California state average. It is 8437% greater than the overall U.S. average.On 7/21/1952 at 11:52:14, a magnitude 7.7 (7.7 UK, Class: Major, Intensity: VIII - XII) earthquake occurred 99.1 miles away from Hanford center, causing $50,000,000 total damage
On 4/18/1906 at 13:12:21, a magnitude 7.9 (7.9 UK) earthquake occurred 217.8 miles away from the city center, causing $524,000,000 total damage
On 11/4/1927 at 13:51:53, a magnitude 7.5 (7.5 UK) earthquake occurred 125.2 miles away from Hanford center
On 6/28/1992 at 11:57:34, a magnitude 7.6 (6.2 MB, 7.6 MS, 7.3 MW, Depth: 0.7 mi) earthquake occurred 230.3 miles away from the city center, causing 3 deaths (1 shaking deaths, 2 other deaths) and 400 injuries, causing $100,000,000 total damage and $40,000,000 insured losses
On 10/18/1989 at 00:04:15, a magnitude 7.1 (6.5 MB, 7.1 MS, 6.9 MW, 7.0 ML) earthquake occurred 129.4 miles away from Hanford center, causing 62 deaths (62 shaking deaths) and 3757 injuries, causing $1,305,032,704 total damage
On 5/2/1983 at 23:42:37, a magnitude 6.7 (6.2 MB, 6.5 MS, 6.5 MW, 6.7 ML, Class: Strong, Intensity: VII - IX) earthquake occurred 37.5 miles away from the city center, causing $31,000,000 total damage
Magnitude types: body-wave magnitude (MB), local magnitude (ML), surface-wave magnitude (MS), moment magnitude (MW)
Natural disasters:
The number of natural disasters in Kings County (14) is near the US average (15).Major Disasters (Presidential) Declared: 10
Emergencies Declared: 2
Causes of natural disasters: Floods: 9, Storms: 4, Winter Storms: 4, Landslides: 2, Mudslides: 2, Drought: 1, Earthquake: 1, Freeze: 1, Hurricane: 1, Tornado: 1, Other: 1 (Note: some incidents may be assigned to more than one category).
Hospitals and medical centers in Hanford:
- ADVENTIST MEDICAL CENTER (Voluntary non-profit - Church, provides emergency services, 115 MALL DRIVE)
- CENTRAL VALLEY GENERAL HOSPITAL (Voluntary non-profit - Church, provides emergency services, 1025 N DOUTY ST)
- HACIENDA REHABILITATION AND HEA (361 E. GRANGEVILLE BLVD)
- HANFORD NURSING AND REHABILITATION CENTER (1007 WEST LACEY BLVD)
- KINGS CONVALESCENT CENTER (851 LESLIE LN)
- KINGS NURSING AND REHABILITATION CENTER (851 LESLIE LANE)
- HANFORD AT HOME DIALYSIS (900 N. DOUTY STREET, SUITE A)
- HANFORD DIALYSIS (402 W. EIGHTH STREET)
- ADVENTIST HEALTH HOME CARE AND HOSPICE SERVICES (460 KINGS COUNTY DRIVE, #101)
Airports and heliports located in Hanford:
- Hanford Municipal Airport (HJO) (Runways: 1, Air Taxi Ops: 200, Itinerant Ops: 14,250, Local Ops: 14,250)
- Blair Strip Airport (9CL5) (Runways: 1)
- Swanson Ranch Nr 1 Airport (87CA) (Runways: 1)
- Adventist Medical Center Hanford Heliport (15CN)
- Hanford Community Medical Center Helistop Heliport (4CL8)
- Kings County Houston Ave Heliport (CN53)
Amtrak station:
HANFORD (200 SANTA FE AVE.) . Services: ticket office, fully wheelchair accessible, enclosed waiting area, public restrooms, public payphones, snack bar, free short-term parking, free long-term parking, call for car rental service, taxi stand, intercity bus service, public transit connection.College/University in Hanford:
Colleges/universities with over 2000 students nearest to Hanford:
- West Hills College-Lemoore (about 11 miles; Lemoore, CA; Full-time enrollment: 2,314)
- San Joaquin Valley College-Visalia (about 15 miles; Visalia, CA; FT enrollment: 2,386)
- College of the Sequoias (about 19 miles; Visalia, CA; FT enrollment: 6,982)
- Reedley College (about 22 miles; Reedley, CA; FT enrollment: 8,144)
- Fresno Pacific University (about 28 miles; Fresno, CA; FT enrollment: 3,083)
- Fresno City College (about 32 miles; Fresno, CA; FT enrollment: 12,994)
- California State University-Fresno (about 34 miles; Fresno, CA; FT enrollment: 18,993)
Biggest public high schools in Hanford:
- HANFORD HIGH (Students: 1,271, Location: 120 E. GRANGEVILLE BLVD., Grades: 9-12)
- HANFORD WEST HIGH (Students: 1,270, Location: 1150 W. LACEY BLVD., Grades: 9-12)
- SIERRA PACIFIC HIGH (Students: 215, Location: 1259 N. 13TH AVE., Grades: 9-12)
- KINGS COUNTY SPECIAL EDUCATION (Students: 153, Location: 959 KATIE HAMMOND LN., Grades: KG-12)
- CROSSROADS CHARTER (Students: 77, Location: 418 W. 8TH ST., Grades: KG-12, Charter school)
- EARL F. JOHNSON HIGH (CONTINUATION) (Students: 55, Location: 1201 N. DOUTY, Grades: 9-12)
- KINGS COUNTY COMMUNITY (Students: 40, Location: 146 HIGHLAND ST., Grades: 7-12)
- HANFORD NIGHT (CONTINUATION) (Students: 18, Location: 1201 N. DOUTY, Grades: 10-12)
- J. C. MONTGOMERY (Students: 18, Location: 1450 FORUM DR., Grades: KG-12)
- HANFORD COMMUNITY DAY (Students: 5, Location: 120 E. GRANGEVILLE BLVD., Grades: 9-12)
Biggest public elementary/middle schools in Hanford:
- WOODROW WILSON JUNIOR HIGH (Students: 556, Location: 601 W. FLORINDA ST., Grades: 7-8)
- PIONEER MIDDLE (Students: 556, Location: 101 W. PIONEER WAY, Grades: 6-8, Charter school)
- JOHN F. KENNEDY JUNIOR HIGH (Students: 473, Location: 1000 E. FLORINDA ST., Grades: 7-8)
- KINGS RIVER-HARDWICK ELEMENTARY (Students: 468, Location: 10300 EXCELSIOR AVE., Grades: KG-8, Charter school)
- JOSEPH M. SIMAS (Students: 416, Location: 1875 FITZGERALD, Grades: KG-6)
- MARTIN LUTHER KING JR. ELEMENTARY (Students: 384, Location: 820 HUME AVE., Grades: KG-6)
- GEORGE WASHINGTON ELEMENTARY (Students: 364, Location: 2245 N. FAIRMONT, Grades: KG-6)
- KIT CARSON ELEMENTARY (Students: 302, Location: 9895 SEVENTH AVE., Grades: KG-8)
- ROOSEVELT ELEMENTARY (Students: 291, Location: 870 DAVIS ST., Grades: KG-6)
- LEE RICHMOND ELEMENTARY (Students: 252, Location: 939 KATIE HAMMOND ST., Grades: KG-6)
Private elementary/middle schools in Hanford:
User-submitted facts and corrections:
- birthplace of Steve Perry (lead singer of supergroup Journey) January 21, 1949
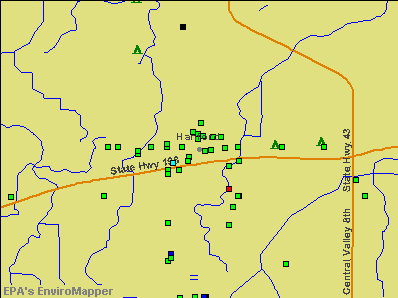
Points of interest:
Notable locations in Hanford: State Division of Forestry (A), Kings County Government Center (B), China Alley (C), Kings County Honor Farm (D), Kings Industrial Park (E), Kings Art Center (F), Hanford City Hall (G), Hanford Branch Kings County Library (H), Veterans Memorial Building (I), Longfield Recreation Center (J), Kings County Jail (K), Kings County Free Library (L), Kings County Courthouse (M), Carnegie Museum (N), American Ambulance (O), American Ambulance Kings County Headquarters (P), American Ambulance (Q), Hanford Fire Department Station 2 (R), Hanford Fire Department Station 1 (S). Display/hide their locations on the map
Shopping Centers: Hanford Mall Shopping Center (1), Centennial Plaza Shopping Center (2), Hanford Towne Center Shopping Center (3). Display/hide their locations on the map
Churches in Hanford include: Folsom Temple Church of God in Christ (A), Iglesia Cristiana Amigos de Israel (B), Latin American Assembly of God Church (C), Southside Church of God (D), Body of Christ Ministries (E), Calvary Chapel of Hanford (F), Church of Christ (G), Church of God (H), The Church of Jesus Christ of Latter Day Saints (I). Display/hide their locations on the map
Cemetery: Hanford Cemetery (1). Display/hide its location on the map
Parks in Hanford include: Cob Park (1), Lacy Park (2), Kings County Fairgrounds (3), Civic Center Park (4), Earl Johnson Park (5), Hidden Valley Park (6). Display/hide their locations on the map
Tourist attraction: Adventure Park Golf-N-Fun (Amusement & Theme Parks; 1495 Glendale Avenue) (1). Display/hide its approximate location on the map
Hotel: Best Western Hanford Inn (755 Cadillac Lane) (1). Display/hide its approximate location on the map
Birthplace of: J. G. Quintel - Animator, Steve Perry (musician) - Male singer, Sean Parnell - Alaska governor, Lorenzo Neal - 2005 NFL player (San Diego Chargers, born: Dec 27, 1970), Tyson Chandler - NBA player (Chicago Bulls, born: Oct 2, 1982), Richard C. Miller - Photographer, Chad Mendes - Sport wrestler and martial artist, Charley Trujillo - Novelist, Scott Parker - NHL player (San Jose Sharks, born: Jan 29, 1978), Scott Parker (ice hockey) - Ice hockey player.
Drinking water stations with addresses in Hanford and their reported violations in the past:
VIDAURRI - ADOBE HACIENDA (Population served: 25, Groundwater):Past health violations:LA FUENTE MARKET II(WA) (Population served: 25, Groundwater):
- MCL, Monthly (TCR) - In JUL-2006, Contaminant: Coliform. Follow-up actions: St AO (w/o penalty) issued (JUL-13-2006)
- MCL, Monthly (TCR) - In JUL-2006, Contaminant: Coliform. Follow-up actions: St AO (w/o penalty) issued (JUL-13-2006)
- MCL, Monthly (TCR) - In APR-2006, Contaminant: Coliform. Follow-up actions: St Formal NOV issued (APR-19-2006)
- MCL, Monthly (TCR) - In APR-2006, Contaminant: Coliform. Follow-up actions: St Compliance achieved (SEP-24-1997), St Formal NOV issued (APR-19-2006)
Past health violations:RUBALCAVA WATER SYSTEM (Population served: 25, Groundwater):Past monitoring violations:
- MCL, Monthly (TCR) - In AUG-2013, Contaminant: Coliform. Follow-up actions: St AO (w/o penalty) issued (AUG-05-2013)
- MCL, Monthly (TCR) - In SEP-2007, Contaminant: Coliform. Follow-up actions: St AO (w/o penalty) issued (SEP-20-2007)
- MCL, Monthly (TCR) - In SEP-2007, Contaminant: Coliform. Follow-up actions: St AO (w/o penalty) issued (SEP-20-2007)
- One regular monitoring violation
Past health violations:OVERLAND STOCKYARD (Population served: 25, Groundwater):
- MCL, Acute (TCR) - In MAR-2005, Contaminant: Coliform. Follow-up actions: St AO (w/o penalty) issued (MAR-18-2005)
- MCL, Acute (TCR) - In MAR-2005, Contaminant: Coliform. Follow-up actions: St AO (w/o penalty) issued (MAR-18-2005)
Past health violations:Past monitoring violations:
- MCL, Monthly (TCR) - In JAN-2014, Contaminant: Coliform. Follow-up actions: St AO (w/o penalty) issued (JAN-29-2014)
- MCL, Monthly (TCR) - In AUG-2013, Contaminant: Coliform. Follow-up actions: St AO (w/o penalty) issued (AUG-05-2013)
- MCL, Monthly (TCR) - In MAY-2009, Contaminant: Coliform. Follow-up actions: St AO (w/o penalty) issued (MAY-15-2009)
- MCL, Monthly (TCR) - In APR-2009, Contaminant: Coliform. Follow-up actions: St AO (w/o penalty) issued (APR-09-2009)
- MCL, Monthly (TCR) - In APR-2009, Contaminant: Coliform. Follow-up actions: St AO (w/o penalty) issued (APR-09-2009)
- MCL, Monthly (TCR) - In OCT-2008, Contaminant: Coliform. Follow-up actions: St AO (w/o penalty) issued (2 times from OCT-30-2008 to OCT-31-2008)
- 7 other older health violations
- 2 routine major monitoring violations
- 2 regular monitoring violations
Drinking water stations with addresses in Hanford that have no violations reported:
- HANFORD FIRST BAPTIST CHURCH (Population served: 350, Primary Water Source Type: Groundwater)
- WARMERDAM PACKING LP (Population served: 150, Primary Water Source Type: Groundwater)
- KINGS COUNTRY CLUB (Population served: 50, Primary Water Source Type: Groundwater)
| This city: | 3.0 people |
| California: | 2.9 people |
| This city: | 75.1% |
| Whole state: | 68.7% |
| This city: | 8.2% |
| Whole state: | 7.2% |
Likely homosexual households (counted as self-reported same-sex unmarried-partner households)
- Lesbian couples: 0.4% of all households
- Gay men: 0.3% of all households
People in group quarters in Hanford in 2010:
- 314 people in local jails and other municipal confinement facilities
- 296 people in nursing facilities/skilled-nursing facilities
- 178 people in other noninstitutional facilities
- 59 people in emergency and transitional shelters (with sleeping facilities) for people experiencing homelessness
- 42 people in group homes intended for adults
- 6 people in group homes for juveniles (non-correctional)
- 4 people in workers' group living quarters and job corps centers
People in group quarters in Hanford in 2000:
- 360 people in local jails and other confinement facilities (including police lockups)
- 358 people in nursing homes
- 113 people in other noninstitutional group quarters
- 10 people in homes or halfway houses for drug/alcohol abuse
- 6 people in religious group quarters
Banks with most branches in Hanford (2011 data):
- Bank of the West: Hanford Branch at 230 West Seventh Street, branch established on 1926/01/01. Info updated 2009/11/16: Bank assets: $62,408.3 mil, Deposits: $43,995.2 mil, headquarters in San Francisco, CA, positive income, 647 total offices, Holding Company: Bnp Paribas
- JPMorgan Chase Bank, National Association: Hanford Branch at 421 North Douty, branch established on 1965/12/17. Info updated 2011/11/10: Bank assets: $1,811,678.0 mil, Deposits: $1,190,738.0 mil, headquarters in Columbus, OH, positive income, International Specialization, 5577 total offices, Holding Company: Jpmorgan Chase & Co.
- Citibank, National Association: Redington Branch at 333 North Redington Street, branch established on 1998/07/12. Info updated 2012/01/10: Bank assets: $1,288,658.0 mil, Deposits: $882,541.0 mil, headquarters in Sioux Falls, SD, positive income, International Specialization, 1048 total offices, Holding Company: Citigroup Inc.
- Union Bank, National Association: Hanford Branch at 225 West Seventh Street, branch established on 1891/01/01. Info updated 2011/09/01: Bank assets: $88,967.5 mil, Deposits: $65,286.4 mil, headquarters in San Francisco, CA, positive income, Commercial Lending Specialization, 403 total offices, Holding Company: Mitsubishi Ufj Financial Group, Inc.
- Wells Fargo Bank, National Association: Hanford Branch at 200 West Seventh Street, branch established on 1935/02/02. Info updated 2011/04/05: Bank assets: $1,161,490.0 mil, Deposits: $905,653.0 mil, headquarters in Sioux Falls, SD, positive income, 6395 total offices, Holding Company: Wells Fargo & Company
- Bank of the Sierra: Hanford Branch at 427 West Lacey Boulevard, branch established on 1999/01/12. Info updated 2006/11/03: Bank assets: $1,332.3 mil, Deposits: $1,091.7 mil, headquarters in Porterville, CA, positive income, Commercial Lending Specialization, 26 total offices, Holding Company: Sierra Bancorp
- Finance and Thrift Company: Hanford Branch at 116 7th Street, branch established on 2009/12/24. Info updated 2010/02/16: Bank assets: $129.7 mil, Deposits: $98.5 mil, headquarters in Porterville, CA, positive income, Consumer Lending Specialization, 9 total offices
- Westamerica Bank: Hanford Branch at 890 West Lacey Boulevard, branch established on 1988/11/21. Info updated 2011/06/21: Bank assets: $4,998.1 mil, Deposits: $4,253.2 mil, headquarters in San Rafael, CA, positive income, Commercial Lending Specialization, 98 total offices, Holding Company: Westamerica Bancorporation
- CapitalSource Bank: Hanford Branch at 512 North Irwin Street, branch established on 1962/08/01. Info updated 2009/02/05: Bank assets: $6,783.6 mil, Deposits: $5,125.0 mil, headquarters in Los Angeles, CA, positive income, Commercial Lending Specialization, 24 total offices
- 2 other banks with 2 local branches
For population 15 years and over in Hanford:
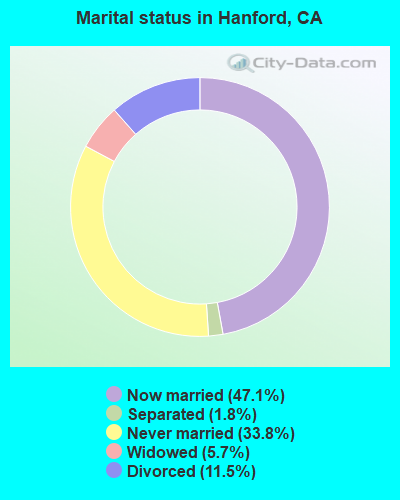
- Never married: 33.8%
- Now married: 47.1%
- Separated: 1.8%
- Widowed: 5.7%
- Divorced: 11.5%
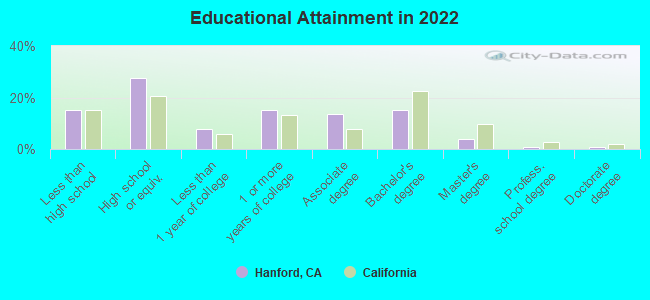
For population 25 years and over in Hanford:
- High school or higher: 81.8%
- Bachelor's degree or higher: 19.1%
- Graduate or professional degree: 6.0%
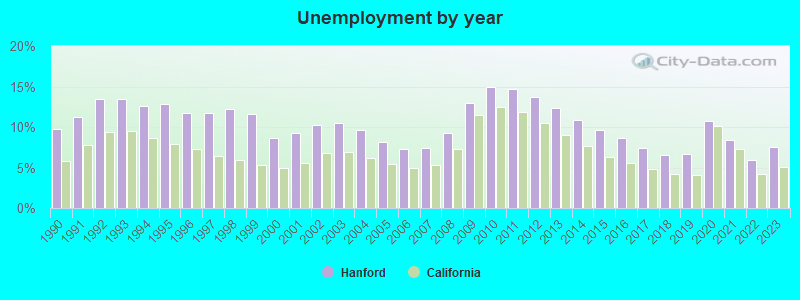
- Unemployed: 11.6%
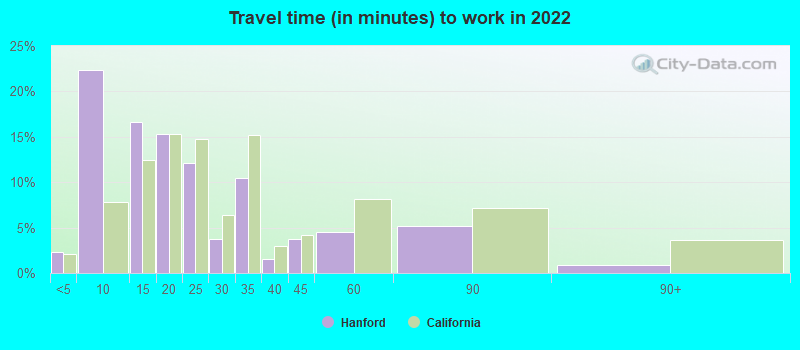
- Mean travel time to work (commute): 20.0 minutes
| Here: | 12.8 |
| California average: | 15.5 |
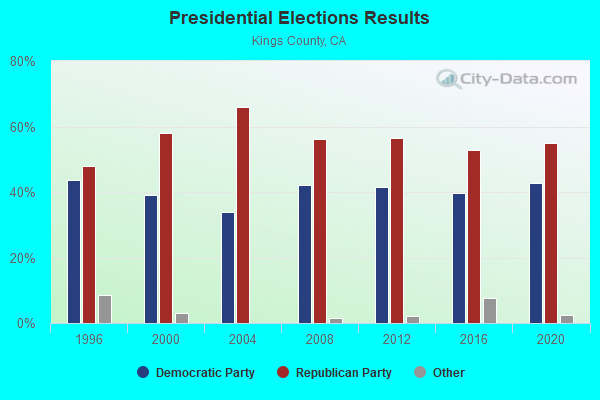
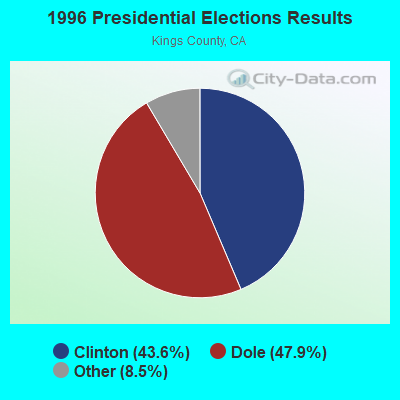
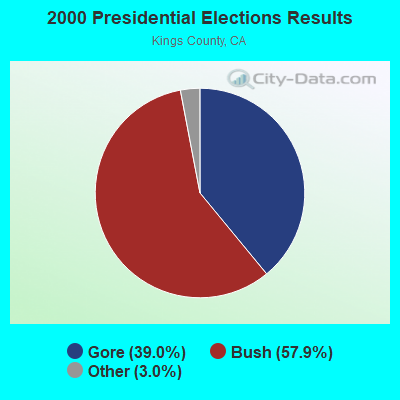
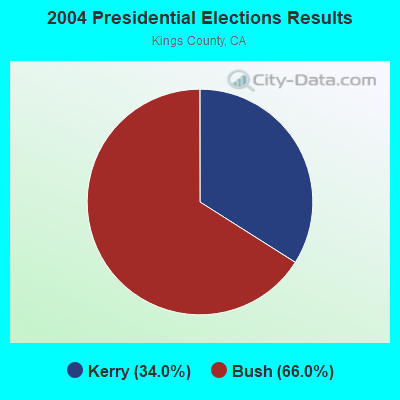
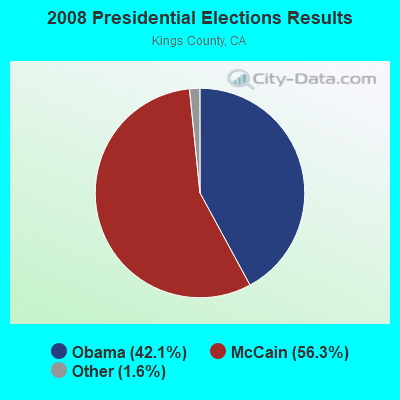
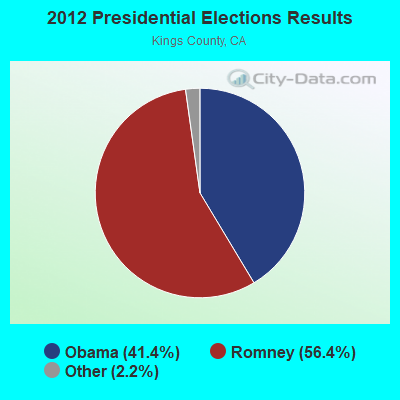
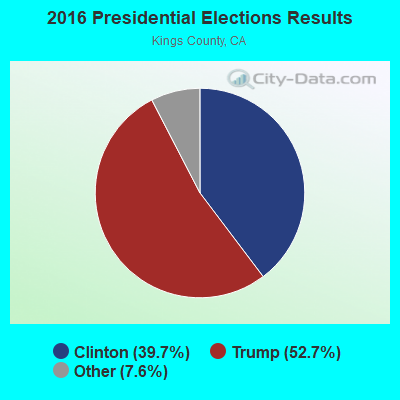
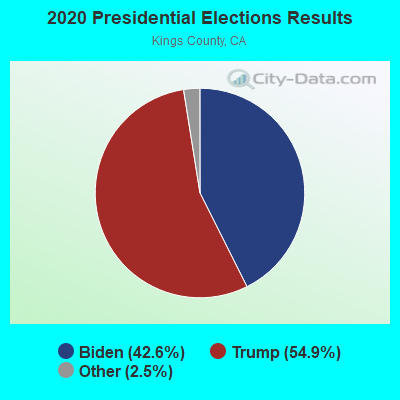
Graphs represent county-level data. Detailed 2008 Election Results
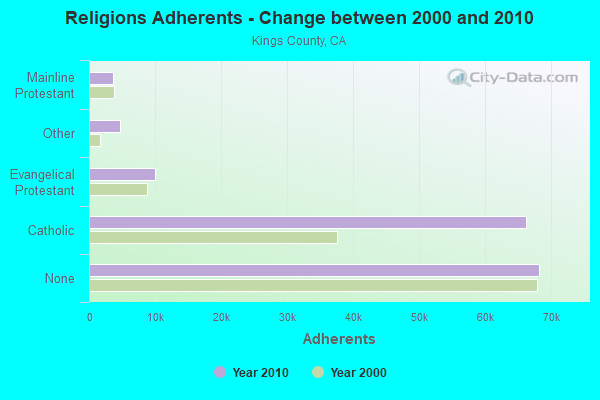
Religion statistics for Hanford, CA (based on Kings County data)
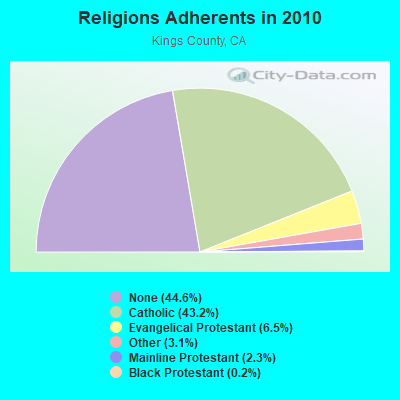
| Religion | Adherents | Congregations |
|---|---|---|
| Catholic | 66,133 | 8 |
| Evangelical Protestant | 10,014 | 78 |
| Other | 4,742 | 11 |
| Mainline Protestant | 3,586 | 13 |
| Black Protestant | 320 | 2 |
| None | 68,187 | - |
Food Environment Statistics:
| Kings County: | 2.02 / 10,000 pop. |
| California: | 2.14 / 10,000 pop. |
| Kings County: | 0.61 / 10,000 pop. |
| California: | 0.62 / 10,000 pop. |
| This county: | 1.55 / 10,000 pop. |
| California: | 1.49 / 10,000 pop. |
| Kings County: | 3.24 / 10,000 pop. |
| State: | 7.42 / 10,000 pop. |
| Kings County: | 6.4% |
| State: | 7.3% |
| Kings County: | 26.2% |
| California: | 21.3% |
| This county: | 21.4% |
| State: | 17.9% |
Health and Nutrition:
| This city: | 47.6% |
| California: | 49.4% |
| Hanford: | 46.1% |
| California: | 48.0% |
| Hanford: | 28.5 |
| California: | 28.1 |
| Hanford: | 22.1% |
| State: | 20.2% |
| Hanford: | 10.6% |
| California: | 11.2% |
| Hanford: | 6.8 |
| State: | 6.8 |
| Here: | 32.7% |
| California: | 31.5% |
| Hanford: | 54.9% |
| California: | 56.4% |
| This city: | 80.3% |
| State: | 80.9% |
More about Health and Nutrition of Hanford, CA Residents
| Local government employment and payroll (March 2022) | |||||
| Function | Full-time employees | Monthly full-time payroll | Average yearly full-time wage | Part-time employees | Monthly part-time payroll |
|---|---|---|---|---|---|
| Police Protection - Officers | 67 | $725,484 | $129,937 | 0 | $0 |
| Firefighters | 33 | $162,108 | $58,948 | 2 | $2,250 |
| Solid Waste Management | 31 | $188,427 | $72,939 | 2 | $4,207 |
| Water Supply | 25 | $164,504 | $78,962 | 0 | $0 |
| Streets and Highways | 24 | $214,485 | $107,243 | 1 | $562 |
| Other and Unallocable | 22 | $156,058 | $85,123 | 3 | $4,316 |
| Sewerage | 20 | $147,835 | $88,701 | 0 | $0 |
| Police - Other | 19 | $80,531 | $50,862 | 3 | $2,697 |
| Parks and Recreation | 17 | $116,954 | $82,556 | 17 | $21,195 |
| Other Government Administration | 8 | $42,745 | $64,118 | 4 | $1,887 |
| Housing and Community Development (Local) | 7 | $35,220 | $60,377 | 0 | $0 |
| Financial Administration | 6 | $26,056 | $52,112 | 2 | $7,079 |
| Health | 2 | $6,359 | $38,154 | 0 | $0 |
| Fire - Other | 1 | $8,607 | $103,284 | 0 | $0 |
| Airports | 0 | $0 | 1 | $1,878 | |
| Totals for Government | 282 | $2,075,373 | $88,314 | 35 | $46,070 |
Hanford government finances - Expenditure in 2017 (per resident):
- Construction - Regular Highways: $4,174,000 ($71.39)
Sewerage: $1,296,000 ($22.17)
Police Protection: $304,000 ($5.20)
General - Other: $240,000 ($4.10)
Protective Inspection and Regulation - Other: $183,000 ($3.13)
Parks and Recreation: $140,000 ($2.39)
- Current Operations - Police Protection: $11,503,000 ($196.73)
Protective Inspection and Regulation - Other: $8,738,000 ($149.44)
Solid Waste Management: $7,516,000 ($128.54)
Local Fire Protection: $4,830,000 ($82.61)
Water Utilities: $4,333,000 ($74.11)
Sewerage: $4,191,000 ($71.68)
Parks and Recreation: $3,130,000 ($53.53)
Central Staff Services: $2,391,000 ($40.89)
Regular Highways: $2,198,000 ($37.59)
Housing and Community Development: $1,005,000 ($17.19)
Health - Other: $516,000 ($8.83)
Financial Administration: $374,000 ($6.40)
General - Other: $289,000 ($4.94)
Air Transportation: $140,000 ($2.39)
- General - Interest on Debt: $838,000 ($14.33)
- Intergovernmental to Local - Other - Sewerage: $2,612,000 ($44.67)
Other - Libraries: $434,000 ($7.42)
Other - Health - Other: $363,000 ($6.21)
- Other Capital Outlay - Water Utilities: $851,000 ($14.55)
Parks and Recreation: $507,000 ($8.67)
Central Staff Services: $154,000 ($2.63)
Air Transportation: $36,000 ($0.62)
Solid Waste Management: $12,000 ($0.21)
- Water Utilities - Interest on Debt: $693,000 ($11.85)
Hanford government finances - Revenue in 2017 (per resident):
- Charges - Sewerage: $7,778,000 ($133.03)
Solid Waste Management: $6,960,000 ($119.04)
Other: $2,601,000 ($44.48)
Parks and Recreation: $214,000 ($3.66)
Air Transportation: $172,000 ($2.94)
- Federal Intergovernmental - Housing and Community Development: $783,000 ($13.39)
Other: $474,000 ($8.11)
Air Transportation: $354,000 ($6.05)
- Miscellaneous - Interest Earnings: $733,000 ($12.54)
General Revenue - Other: $577,000 ($9.87)
Special Assessments: $417,000 ($7.13)
Rents: $244,000 ($4.17)
Fines and Forfeits: $148,000 ($2.53)
Donations From Private Sources: $64,000 ($1.09)
- Revenue - Water Utilities: $9,621,000 ($164.55)
- State Intergovernmental - Highways: $1,315,000 ($22.49)
Water Utilities: $347,000 ($5.93)
Other: $302,000 ($5.17)
Sewerage: $98,000 ($1.68)
General Local Government Support: $52,000 ($0.89)
- Tax - General Sales and Gross Receipts: $10,180,000 ($174.11)
Property: $9,968,000 ($170.48)
Other: $5,107,000 ($87.34)
Other License: $1,257,000 ($21.50)
Public Utilities Sales: $952,000 ($16.28)
Occupation and Business License - Other: $590,000 ($10.09)
Other Selective Sales: $381,000 ($6.52)
Documentary and Stock Transfer: $165,000 ($2.82)
Hanford government finances - Debt in 2017 (per resident):
- Long Term Debt - Beginning Outstanding - Unspecified Public Purpose: $44,280,000 ($757.31)
Outstanding Unspecified Public Purpose: $41,569,000 ($710.95)
Retired Unspecified Public Purpose: $2,711,000 ($46.37)
Hanford government finances - Cash and Securities in 2017 (per resident):
- Bond Funds - Cash and Securities: $5,089,000 ($87.04)
- Other Funds - Cash and Securities: $71,733,000 ($1226.83)
7.18% of this county's 2021 resident taxpayers lived in other counties in 2020 ($37,717 average adjusted gross income)
| Here: | 7.18% |
| California average: | 5.19% |
0.18% of residents moved from foreign countries ($1,419 average AGI)
Kings County: 0.18% California average: 0.03%
Top counties from which taxpayers relocated into this county between 2020 and 2021:
| from Fresno County, CA | |
| from Tulare County, CA | |
| from Los Angeles County, CA |
7.32% of this county's 2020 resident taxpayers moved to other counties in 2021 ($55,523 average adjusted gross income)
| Here: | 7.32% |
| California average: | 6.14% |
0.15% of residents moved to foreign countries ($1,240 average AGI)
Kings County: 0.15% California average: 0.02%
Top counties to which taxpayers relocated from this county between 2020 and 2021:
| to Fresno County, CA | |
| to Tulare County, CA | |
| to San Diego County, CA |
| Businesses in Hanford, CA | ||||
| Name | Count | Name | Count | |
|---|---|---|---|---|
| 7-Eleven | 1 | Lane Furniture | 1 | |
| 99 Cents Only Stores | 1 | Little Caesars Pizza | 1 | |
| AT&T | 3 | Long John Silver's | 1 | |
| Applebee's | 1 | Lowe's | 1 | |
| Arby's | 1 | Marshalls | 1 | |
| AutoZone | 1 | MasterBrand Cabinets | 2 | |
| Baskin-Robbins | 1 | Maurices | 1 | |
| Bath & Body Works | 1 | McDonald's | 4 | |
| Best Western | 1 | Motherhood Maternity | 1 | |
| Blockbuster | 1 | Nike | 8 | |
| Burger King | 1 | Old Navy | 1 | |
| CVS | 2 | Pac Sun | 1 | |
| Carl\s Jr. | 1 | Panda Express | 1 | |
| Chevrolet | 1 | Panera Bread | 1 | |
| Circle K | 1 | Payless | 2 | |
| Cold Stone Creamery | 1 | PetSmart | 1 | |
| Comfort Inn | 1 | Pizza Hut | 1 | |
| Cricket Wireless | 4 | Popeyes | 1 | |
| Curves | 1 | Quiznos | 1 | |
| Dairy Queen | 1 | RadioShack | 1 | |
| Dennys | 1 | Rite Aid | 2 | |
| Domino's Pizza | 1 | Rue21 | 1 | |
| El Pollo Loco | 1 | SAS Shoes | 1 | |
| Famous Footwear | 1 | SONIC Drive-In | 1 | |
| Fashion Bug | 1 | Sears | 2 | |
| FedEx | 5 | Sprint Nextel | 1 | |
| Foot Locker | 1 | Staples | 1 | |
| Ford | 1 | Starbucks | 3 | |
| Forever 21 | 1 | Super 8 | 1 | |
| GNC | 3 | T-Mobile | 3 | |
| GameStop | 2 | Taco Bell | 2 | |
| H&R Block | 1 | Target | 1 | |
| Home Depot | 1 | Toyota | 1 | |
| Hot Topic | 1 | U-Haul | 3 | |
| IHOP | 1 | UPS | 11 | |
| JCPenney | 1 | Vans | 3 | |
| Jack In The Box | 2 | Verizon Wireless | 1 | |
| Jamba Juice | 1 | Walmart | 1 | |
| Journeys | 1 | Wendy's | 1 | |
| KFC | 1 | Wet Seal | 1 | |
| Kohl's | 1 | YMCA | 1 | |
| Kroger | 1 | |||
Strongest AM radio stations in Hanford:
- KWRU (940 AM; 50 kW; FRESNO, CA)
- KMJ (580 AM; 50 kW; FRESNO, CA; Owner: INFINITY RADIO OPERATIONS INC.)
- KIGS (620 AM; 1 kW; HANFORD, CA; Owner: PERREIRA BROADCASTING)
- KJOP (1240 AM; 1 kW; LEMOORE, CA; Owner: IHR EDUCATIONAL BROADCASTING)
- KERI (1180 AM; 50 kW; WASCO-GREENACRES, CA; Owner: KWSO, INC.)
- KRDU (1130 AM; 6 kW; DINUBA, CA; Owner: CAPSTAR TX LIMITED PARTNERSHIP)
- KOOR (790 AM; 10 kW; CLOVIS, CA; Owner: INFINITY RADIO OPERATIONS INC.)
- KIRV (1510 AM; daytime; 10 kW; FRESNO, CA; Owner: GORE-OVERGAARD BROADCASTING, INC)
- KJUG (1270 AM; 5 kW; TULARE, CA; Owner: WESTCOAST BROADCASTING, INC.)
- KGDP (660 AM; 50 kW; ORCUTT, CA; Owner: RADIO REPRESENTATIVES, INC.)
- KXEX (1550 AM; 10 kW; FRESNO, CA; Owner: RAK COMMUNICATIONS, INC.)
- KAVT (1680 AM; 10 kW; FRESNO, CA; Owner: RAK COMMUNICATIONS, INC.)
- KCBC (770 AM; 50 kW; RIVERBANK, CA; Owner: KIERTRON, INC.)
Strongest FM radio stations in Hanford:
- KQKL (88.5 FM; SELMA, CA; Owner: EDUCATIONAL MEDIA FOUNDATION)
- KFYE (106.3 FM; KINGSBURG, CA; Owner: EDUCATIONAL MEDIA FOUNDATION)
- KZPO (103.3 FM; LINDSAY, CA; Owner: LINDSAY BROADCASTING)
- KMAK (100.3 FM; ORANGE COVE, CA; Owner: RICHARD B. SMITH)
- KGEN-FM (94.5 FM; HANFORD, CA; Owner: AZTECA BROADCASTING CORPORATION)
- K203CM (88.5 FM; SANGER, CA; Owner: EDUCATIONAL MEDIA FOUNDATION)
- KDUV (88.9 FM; VISALIA, CA; Owner: COMMUNITY EDUCATIONAL B/CASTNG, INC.)
- K217EQ (91.3 FM; COALINGA, CA; Owner: CALVARY CHAPEL OF TWIN FALLS, INC.)
- KJUG-FM (106.7 FM; TULARE, CA; Owner: WESTCOAST BROADCASTING, INC.)
- K220EY (91.9 FM; PORTERVILLE, CA; Owner: FAMILY STATIONS, INC.)
- KUFW (90.5 FM; WOODLAKE, CA; Owner: NATIONAL FARM WORKERS SERVICE CENTER)
- KWYE (101.1 FM; FRESNO, CA; Owner: INFINITY RADIO OPERATIONS INC.)
- K203AQ (88.5 FM; HELM, ETC., CA; Owner: FAMILY STATIONS, INC.)
- KMGV (97.9 FM; FRESNO, CA; Owner: INFINITY RADIO OPERATIONS INC.)
- KMQA (100.5 FM; EAST PORTERVILLE, CA; Owner: MOON BROADCASTING PORTERVILLE L.L.C.)
- KRZR (103.7 FM; HANFORD, CA; Owner: CAPSTAR TX LIMITED PARTNERSHIP)
- KDKL (88.3 FM; COALINGA, CA; Owner: EDUCATIONAL MEDIA FOUNDATION)
- K266AH (101.1 FM; BENA, CA; Owner: CALVARY CHAPEL OF TWIN FALLS, INC.)
- KFNO (90.3 FM; FRESNO, CA; Owner: FAMILY STATIONS, INC.)
- KLBN (105.1 FM; AUBERRY, CA; Owner: LOTUS COMMUNICATIONS CORP.)
TV broadcast stations around Hanford:
- K02OH (Channel 2; FRESNO, CA; Owner: W. R. PORTEE AND LORRAINE PORTEE)
Medal of Honor Recipients
Medal of Honor Recipient born in Hanford: George Alan Ingalls.
- National Bridge Inventory (NBI) Statistics
- 19Number of bridges
- 138ft / 41.9mTotal length
- $2,704,000Total costs
- 198,207Total average daily traffic
- 21,538Total average daily truck traffic
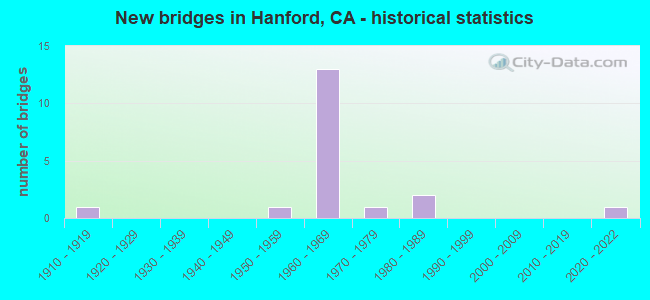
- New bridges - historical statistics
- 11910-1919
- 11950-1959
- 131960-1969
- 11970-1979
- 21980-1989
- 12020-2022
FCC Registered Antenna Towers: 228 (See the full list of FCC Registered Antenna Towers)
FCC Registered Commercial Land Mobile Towers: 1 (See the full list of FCC Registered Commercial Land Mobile Towers in Hanford, CA)
FCC Registered Private Land Mobile Towers: 1 (See the full list of FCC Registered Private Land Mobile Towers)
FCC Registered Broadcast Land Mobile Towers: 56 (See the full list of FCC Registered Broadcast Land Mobile Towers)
FCC Registered Microwave Towers: 115 (See the full list of FCC Registered Microwave Towers in this town)
FCC Registered Paging Towers: 3 (See the full list of FCC Registered Paging Towers)
FCC Registered Amateur Radio Licenses: 265 (See the full list of FCC Registered Amateur Radio Licenses in Hanford)
FAA Registered Aircraft Manufacturers and Dealers: 5 (See the full list of FAA Registered Manufacturers and Dealers in Hanford)
FAA Registered Aircraft: 55 (See the full list of FAA Registered Aircraft)
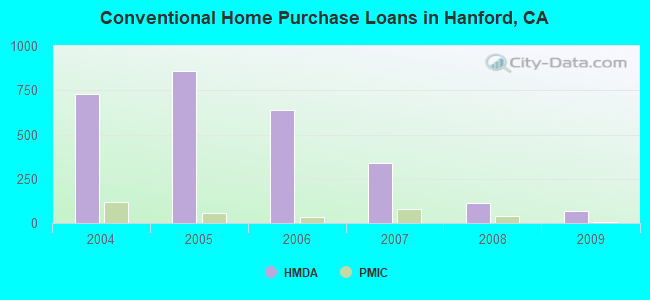
| Home Mortgage Disclosure Act Aggregated Statistics For Year 2009 (Based on 2 full and 8 partial tracts) | ||||||||||
| A) FHA, FSA/RHS & VA Home Purchase Loans | B) Conventional Home Purchase Loans | C) Refinancings | D) Home Improvement Loans | F) Non-occupant Loans on < 5 Family Dwellings (A B C & D) | ||||||
|---|---|---|---|---|---|---|---|---|---|---|
| Number | Average Value | Number | Average Value | Number | Average Value | Number | Average Value | Number | Average Value | |
| LOANS ORIGINATED | 196 | $172,814 | 69 | $141,093 | 323 | $169,745 | 29 | $67,607 | 49 | $93,160 |
| APPLICATIONS APPROVED, NOT ACCEPTED | 16 | $171,008 | 6 | $155,782 | 52 | $193,230 | 5 | $63,358 | 9 | $110,023 |
| APPLICATIONS DENIED | 16 | $168,936 | 12 | $115,002 | 185 | $172,458 | 21 | $68,412 | 29 | $107,821 |
| APPLICATIONS WITHDRAWN | 22 | $206,433 | 12 | $121,898 | 97 | $194,927 | 2 | $101,150 | 21 | $140,042 |
| FILES CLOSED FOR INCOMPLETENESS | 2 | $190,945 | 4 | $114,362 | 20 | $191,998 | 2 | $71,490 | 1 | $125,660 |
Detailed mortgage data for all 10 tracts in Hanford, CA
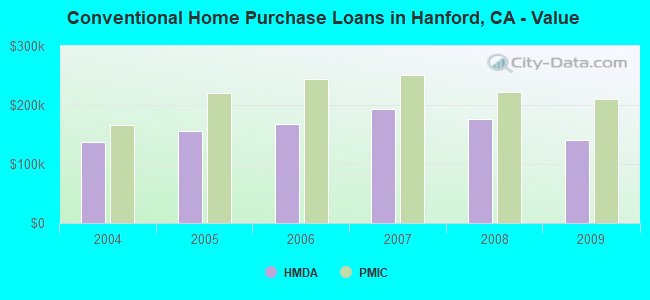
| Private Mortgage Insurance Companies Aggregated Statistics For Year 2009 (Based on 1 full and 6 partial tracts) | ||||
| A) Conventional Home Purchase Loans | B) Refinancings | |||
|---|---|---|---|---|
| Number | Average Value | Number | Average Value | |
| LOANS ORIGINATED | 6 | $210,663 | 2 | $212,490 |
| APPLICATIONS APPROVED, NOT ACCEPTED | 0 | $0 | 3 | $227,073 |
| APPLICATIONS DENIED | 1 | $118,950 | 0 | $0 |
| APPLICATIONS WITHDRAWN | 0 | $0 | 1 | $145,090 |
| FILES CLOSED FOR INCOMPLETENESS | 0 | $0 | 0 | $0 |
2005 - 2018 National Fire Incident Reporting System (NFIRS) incidents
- Fire incident types reported to NFIRS in Hanford, CA
- 1,27552.6%Outside Fires
- 57123.6%Structure Fires
- 48219.9%Mobile Property/Vehicle Fires
- 964.0%Other
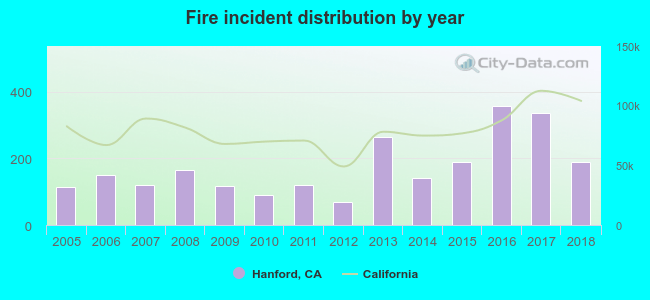 Based on the data from the years 2005 - 2018 the average number of fire incidents per year is 173. The highest number of reported fire incidents - 358 took place in 2016, and the least - 70 in 2012. The data has a growing trend.
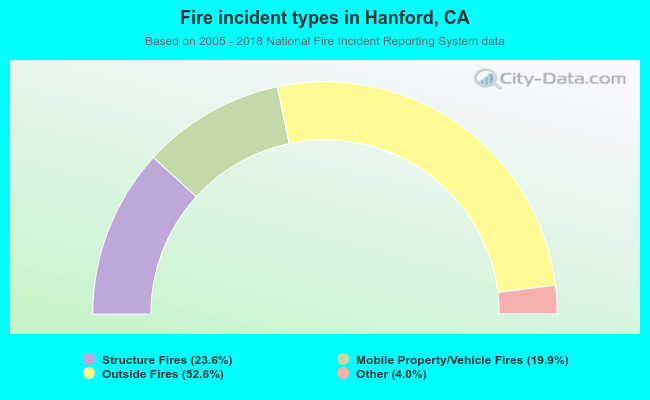 When looking into fire subcategories, the most reports belonged to: Outside Fires (52.6%), and Structure Fires (23.6%).
Fire-safe hotels and motels in Hanford, California:
- Sequoia Inn Of Hanford, 1655 Mall Dr, Hanford, California 93230 , Phone: (559) 582-0338, Fax: (559) 582-1392
- Comfort Inn, 10 N Irwin St, Hanford, California 93230 , Phone: (559) 584-9300, Fax: (559) 584-0300
- Home2 Suites by Hilton Hanford Lemoore, 1589 Glendale Ave, Hanford, California 93230 , Phone: (559) 587-9957, Fax: (559) 587-9956
| Most common first names in Hanford, CA among deceased individuals | ||
| Name | Count | Lived (average) |
|---|---|---|
| Mary | 333 | 81.0 years |
| John | 258 | 75.9 years |
| William | 162 | 74.0 years |
| James | 159 | 72.5 years |
| Manuel | 157 | 76.1 years |
| Robert | 149 | 69.3 years |
| Frank | 126 | 75.0 years |
| Joe | 125 | 75.4 years |
| George | 115 | 77.3 years |
| Maria | 104 | 81.2 years |
| Most common last names in Hanford, CA among deceased individuals | ||
| Last name | Count | Lived (average) |
|---|---|---|
| Smith | 85 | 76.2 years |
| Silva | 81 | 77.6 years |
| Garcia | 80 | 71.5 years |
| Brown | 68 | 74.8 years |
| Johnson | 62 | 73.7 years |
| Davis | 56 | 73.9 years |
| Bettencourt | 50 | 78.5 years |
| Miller | 48 | 80.5 years |
| Wilson | 47 | 72.9 years |
| Sanchez | 47 | 74.4 years |
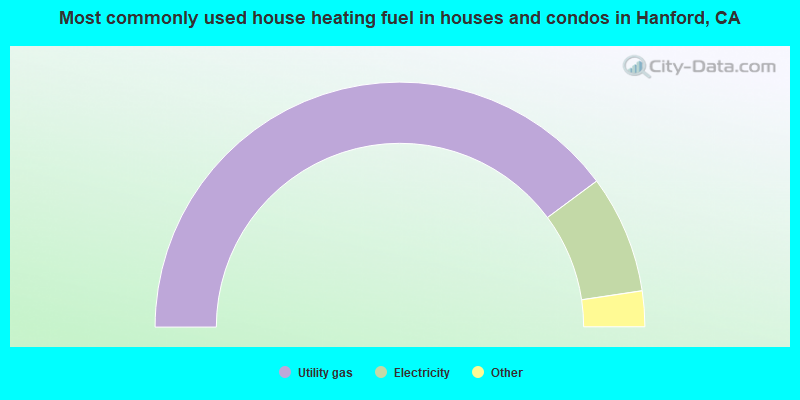
- 79.7%Utility gas
- 15.6%Electricity
- 4.0%Solar energy
- 0.2%Bottled, tank, or LP gas
- 0.2%Other fuel
- 0.1%Wood
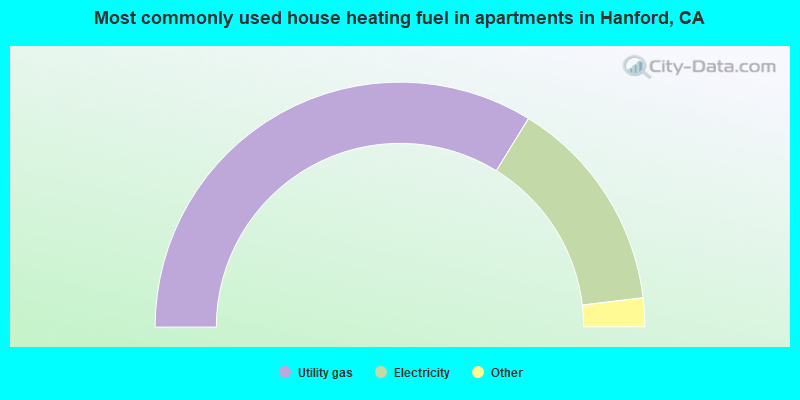
- 67.6%Utility gas
- 28.6%Electricity
- 1.5%No fuel used
- 1.3%Bottled, tank, or LP gas
- 0.6%Solar energy
- 0.2%Fuel oil, kerosene, etc.
- 0.2%Other fuel
Hanford compared to California state average:
- Median house value significantly below state average.
- Hispanic race population percentage above state average.
- Length of stay since moving in above state average.
Hanford on our top lists:
- #1 on the list of "Top 101 cities with the largest city-data.com crime index increase from 2011 to 2012 (population 50,000+)"
- #2 on the list of "Top 101 cities with largest percentage of females in occupations: law enforcement workers including supervisors (population 50,000+)"
- #4 on the list of "Top 101 cities with the largest differences between morning and afternoon humidity (population 50,000+)"
- #4 on the list of "Top 101 cities with the largest humidity differences during a year (population 50,000+)"
- #5 on the list of "Top 101 cities with largest percentage of males in occupations: law enforcement workers including supervisors (population 50,000+)"
- #10 on the list of "Top 101 cities with the largest sunshine amount differences during a year (population 50,000+)"
- #12 on the list of "Top 101 cities with largest percentage of males in occupations: farming, fishing, and forestry occupations (population 50,000+)"
- #12 on the list of "Top 101 cities with the highest maximum monthly sunshine amount (population 50,000+)"
- #15 on the list of "Top 101 cities with largest percentage of males in industries: agriculture, forestry, fishing and hunting (population 50,000+)"
- #19 on the list of "Top 101 cities with largest percentage of females in industries: public administration (population 50,000+)"
- #25 on the list of "Top 101 cities with largest percentage of females in industries: agriculture, forestry, fishing and hunting (population 50,000+)"
- #26 on the list of "Top 101 cities with largest percentage of workers with very short commute times (9 minutes or less) (population 50,000+)"
- #29 on the list of "Top 101 cities with largest percentage of females in occupations: farming, fishing, and forestry occupations (population 50,000+)"
- #29 on the list of "Top 101 cities with largest percentage of males in industries: public administration (population 50,000+)"
- #30 on the list of "Top 101 cities with the lowest average yearly precipitation (population 50,000+)"
- #31 on the list of "Top 101 cities with the highest number of days clear of clouds (population 50,000+)"
- #31 on the list of "Top 101 cities with the lowest number of days clear of clouds (population 50,000+)"
- #35 on the list of "Top 101 cities with the lowest number of police officers per 1000 residents (population 50,000+)"
- #36 on the list of "Top 101 cities with the largest city-data.com crime index per police officer (population 50,000+)"
- #38 on the list of "Top 101 cities with the highest average sunshine amount (population 50,000+)"
- #69 (93230) on the list of "Top 101 zip codes with the largest percentage of Portuguese first ancestries (pop 5,000+)"
- #4 on the list of "Top 101 counties with the highest Particulate Matter (PM10) Annual air pollution readings in 2012 (µg/m3)"
- #4 on the list of "Top 101 counties with the highest Particulate Matter (PM2.5) Annual air pollution readings in 2012 (µg/m3)"
- #25 on the list of "Top 101 counties with the highest Nitrogen Dioxide air pollution readings in 2012 (ppm)"
- #25 on the list of "Top 101 counties with the highest percentage of residents relocating from foreign countries between 2010 and 2011 (pop. 50,000+)"
- #28 on the list of "Top 101 counties with the highest percentage of residents relocating to foreign countries in 2011 (pop. 50,000+)"

|
|
Total of 29 patent applications in 2008-2024.