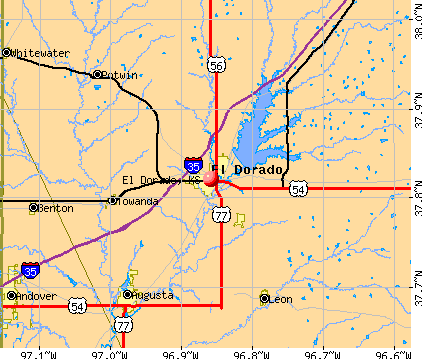
El Dorado, Kansas
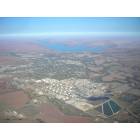
El Dorado: El Dorado, El Dorado Lake and Frontier Refinery
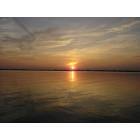
El Dorado: Eldorado Lake sunset
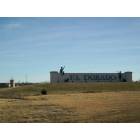
El Dorado: Welcome to El Dorado
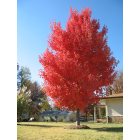
El Dorado: Fall Color in El Dorado, 2010
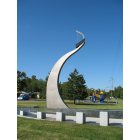
El Dorado: Tornado Memorial
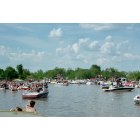
El Dorado: ElDorado Lake/ State Park 67042
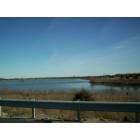
El Dorado: El Dorado Lake
- add
your
Submit your own pictures of this city and show them to the world
- OSM Map
- General Map
- Google Map
- MSN Map
Population change since 2000: +6.7%
 |
| Males: 6,372 | |
| Females: 6,493 |
| Median resident age: | 34.8 years |
| Kansas median age: | 37.6 years |
Zip codes: 67042.
| El Dorado: | $55,051 |
| KS: | $68,925 |
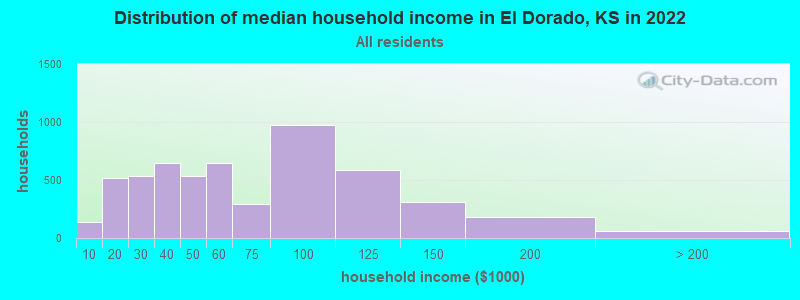
Estimated per capita income in 2022: $27,169 (it was $18,458 in 2000)
El Dorado city income, earnings, and wages data
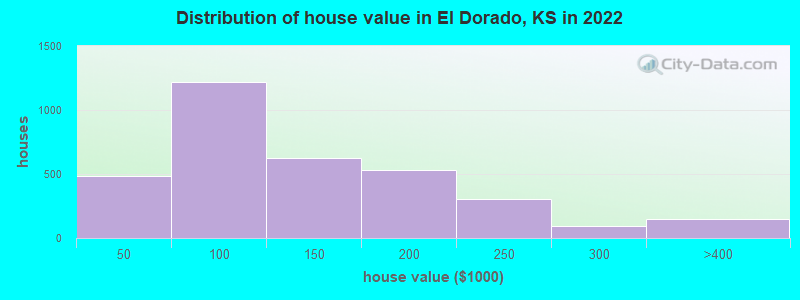
Estimated median house or condo value in 2022: $109,304 (it was $61,000 in 2000)
| El Dorado: | $109,304 |
| KS: | $206,600 |
Mean prices in 2022: all housing units: $159,958; detached houses: $162,224; in 2-unit structures: $325,781; mobile homes: $23,515
Median gross rent in 2022: $892.
(13.6% for White Non-Hispanic residents, 61.4% for Black residents, 41.2% for Hispanic or Latino residents, 65.6% for other race residents, 34.1% for two or more races residents)
Detailed information about poverty and poor residents in El Dorado, KS

Compare current foreclosures near El Dorado, KS:
| Photo | Address | Area | Beds / Baths | Price | Details |
|---|---|---|---|---|---|

|
#1
NE 53rd St
El Dorado, KS 67042
|
1,767 sq. feet
|
2 baths 3 beds |
$242,500
|
show details |

|
#2
S Alleghany St
El Dorado, KS 67042
|
1,446 sq. feet
|
2 baths 2 beds |
show details | |

|
#3
State St
El Dorado, KS 67042
|
1,773 sq. feet
|
2 baths 3 beds |
show details | |

|
#4
Harvard Ave
El Dorado, KS 67042
|
1,216 sq. feet
|
1 baths 3 beds |
show details | |

|
#5
Simpson Rd
El Dorado, KS 67042
|
2,668 sq. feet
|
2 baths 1 beds |
show details | |

|
#6
Hazlett St
El Dorado, KS 67042
|
1,518 sq. feet
|
2 baths 3 beds |
show details | |

|
#7
Residence St
El Dorado, KS 67042
|
1,248 sq. feet
|
1 baths 3 beds |
show details | |

|
#8
Skyview Dr
El Dorado, KS 67042
|
1,143 sq. feet
|
1 baths 3 beds |
show details | |

|
#9
Terrace Dr
El Dorado, KS 67042
|
1,754 sq. feet
|
2 baths 4 beds |
show details | |

|
#10
Country Club Rd Lot 51
El Dorado, KS 67042
|
- sq. feet
|
- baths - beds |
show details |
| Photo | Address | Area | Beds / Baths | Price | Details |
|---|---|---|---|---|---|

|
#11
S High St Apt 10
El Dorado, KS 67042
|
- sq. feet
|
- baths - beds |
show details | |

|
#12
SE Stone Rd # 279976
El Dorado, KS 67042
|
- sq. feet
|
- baths - beds |
show details | |

|
#13
E Locust Ave Lot 10
El Dorado, KS 67042
|
- sq. feet
|
- baths - beds |
show details | |

|
#14
S Denver St
El Dorado, KS 67042
|
- sq. feet
|
- baths - beds |
show details | |

|
#15
Arlington St
El Dorado, KS 67042
|
- sq. feet
|
- baths - beds |
show details | |

|
#16
NE Bluestem Rd
El Dorado, KS 67042
|
- sq. feet
|
- baths - beds |
show details | |

|
#17
SW Haverhill Rd
Leon, KS 67074
|
1,296 sq. feet
|
2 baths 3 beds |
$238,500
|
show details |

|
#18
Washington Ln
Augusta, KS 67010
|
1,189 sq. feet
|
1 baths 3 beds |
show details | |

|
#19
SW Horseshoe Trail Rd
Andover, KS 67002
|
1,580 sq. feet
|
1 baths 3 beds |
show details | |

|
#20
E Clark Ave
Augusta, KS 67010
|
1,377 sq. feet
|
1 baths 3 beds |
show details |
| Photo | Address | Area | Beds / Baths | Price | Details |
|---|---|---|---|---|---|

|
#21
SW Boyer Rd
Augusta, KS 67010
|
2,933 sq. feet
|
2 baths 4 beds |
show details | |

|
#22
Dearborn St
Augusta, KS 67010
|
1,117 sq. feet
|
2 baths 4 beds |
show details | |

|
#23
Loomis Dr
Augusta, KS 67010
|
2,729 sq. feet
|
3 baths 3 beds |
show details | |

|
#24
Country Lane Dr
Augusta, KS 67010
|
2,287 sq. feet
|
2 baths 4 beds |
show details | |

|
#25
SE Highway 400
Leon, KS 67074
|
1,040 sq. feet
|
2 baths 2 beds |
show details | |

|
#26
Danbury Rd
Augusta, KS 67010
|
2,452 sq. feet
|
3 baths 5 beds |
show details | |

|
#27
N 8th St
Towanda, KS 67144
|
1,398 sq. feet
|
2 baths 2 beds |
show details | |

|
#28
Renee Dr
Andover, KS 67002
|
2,275 sq. feet
|
2 baths 4 beds |
show details | |

|
#29
S Main St
Leon, KS 67074
|
- sq. feet
|
- baths - beds |
show details | |

|
#30
Grand Ave
Augusta, KS 67010
|
- sq. feet
|
- baths - beds |
show details |
| Photo | Address | Area | Beds / Baths | Price | Details |
|---|---|---|---|---|---|

|
#31
SW 100th St
Augusta, KS 67010
|
- sq. feet
|
- baths - beds |
show details | |

|
#32
SW 90th St
Augusta, KS 67010
|
- sq. feet
|
- baths - beds |
show details | |

|
#33
Money St Lot 29
Augusta, KS 67010
|
- sq. feet
|
- baths - beds |
show details | |

|
#34
W Clark Ave
Augusta, KS 67010
|
- sq. feet
|
- baths - beds |
show details | |

|
#35
Mechanic St
Towanda, KS 67144
|
- sq. feet
|
- baths - beds |
show details | |

|
#36
N Springbrook St
Andover, KS 67002
|
- sq. feet
|
- baths - beds |
show details | |

|
#37
SW Purity Springs Rd
Douglass, KS 67039
|
- sq. feet
|
- baths - beds |
show details | |

|
#38
SW Boyer Rd
Augusta, KS 67010
|
- sq. feet
|
- baths - beds |
show details | |

|
#39
S Pleasantview Dr
Andover, KS 67002
|
- sq. feet
|
- baths - beds |
show details | |

|
Check over 1 million property listings on Foreclosure.com!
|
browse all offers | |||


- 11,20886.2%White alone
- 6154.7%Hispanic
- 4873.7%Two or more races
- 2782.1%Asian alone
- 1921.5%Black alone
- 1771.4%American Indian alone
- 300.2%Other race alone
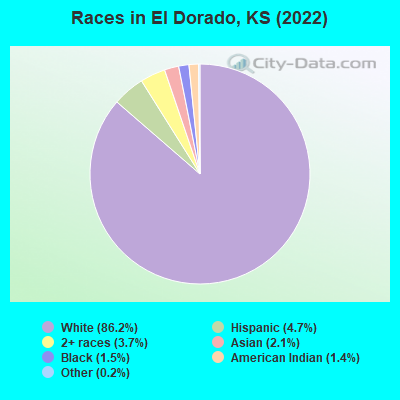
Races in El Dorado detailed stats: ancestries, foreign born residents, place of birth
According to our research of Kansas and other state lists, there were 66 registered sex offenders living in El Dorado, Kansas as of May 23, 2024.
The ratio of all residents to sex offenders in El Dorado is 199 to 1.
Type |
2009 |
2010 |
2011 |
2012 |
2013 |
2014 |
2015 |
2016 |
2017 |
2018 |
2019 |
2020 |
2021 |
2022 |
|---|---|---|---|---|---|---|---|---|---|---|---|---|---|---|
| Murders (per 100,000) | 0 (0.0) | 0 (0.0) | 0 (0.0) | 0 (0.0) | 1 (7.8) | 0 (0.0) | 0 (0.0) | 1 (7.7) | 0 (0.0) | 0 (0.0) | 0 (0.0) | 0 (0.0) | 0 (0.0) | 1 (7.8) |
| Rapes (per 100,000) | 6 (47.7) | 10 (76.8) | 5 (38.2) | 7 (53.5) | 2 (15.6) | 6 (46.8) | 11 (85.6) | 9 (69.7) | 8 (61.0) | 4 (30.9) | 3 (23.3) | 4 (31.0) | 4 (31.2) | 4 (31.2) |
| Robberies (per 100,000) | 8 (63.7) | 4 (30.7) | 6 (45.8) | 3 (22.9) | 2 (15.6) | 2 (15.6) | 3 (23.4) | 2 (15.5) | 5 (38.1) | 3 (23.1) | 5 (38.8) | 2 (15.5) | 1 (7.8) | 3 (23.4) |
| Assaults (per 100,000) | 40 (318.3) | 31 (238.1) | 66 (503.7) | 47 (359.5) | 47 (365.5) | 28 (218.6) | 36 (280.3) | 12 (92.9) | 15 (114.3) | 22 (169.8) | 9 (69.8) | 22 (170.2) | 23 (179.4) | 29 (226.2) |
| Burglaries (per 100,000) | 111 (883.3) | 90 (691.2) | 77 (587.6) | 127 (971.4) | 84 (653.2) | 177 (1,382) | 222 (1,729) | 82 (635.0) | 60 (457.1) | 97 (748.5) | 103 (798.5) | 132 (1,021) | 364 (2,840) | 24 (187.2) |
| Thefts (per 100,000) | 293 (2,332) | 313 (2,404) | 328 (2,503) | 303 (2,318) | 259 (2,014) | 253 (1,975) | 238 (1,853) | 227 (1,758) | 221 (1,684) | 244 (1,883) | 226 (1,752) | 168 (1,300) | 193 (1,506) | 213 (1,661) |
| Auto thefts (per 100,000) | 43 (342.2) | 33 (253.4) | 23 (175.5) | 29 (221.8) | 16 (124.4) | 28 (218.6) | 38 (295.9) | 40 (309.8) | 36 (274.3) | 46 (354.9) | 34 (263.6) | 37 (286.3) | 37 (288.6) | 37 (288.6) |
| Arson (per 100,000) | 1 (8.0) | 1 (7.7) | 2 (15.3) | 2 (15.3) | 0 (0.0) | 2 (15.6) | 2 (15.6) | 2 (15.5) | 0 (0.0) | 9 (69.4) | 2 (15.5) | 1 (7.7) | 2 (15.6) | 2 (15.6) |
| City-Data.com crime index | 303.4 | 283.1 | 300.3 | 300.1 | 242.0 | 279.1 | 350.4 | 234.0 | 204.3 | 221.7 | 191.3 | 209.8 | 345.3 | 195.5 |
The City-Data.com crime index weighs serious crimes and violent crimes more heavily. Higher means more crime, U.S. average is 246.1. It adjusts for the number of visitors and daily workers commuting into cities.
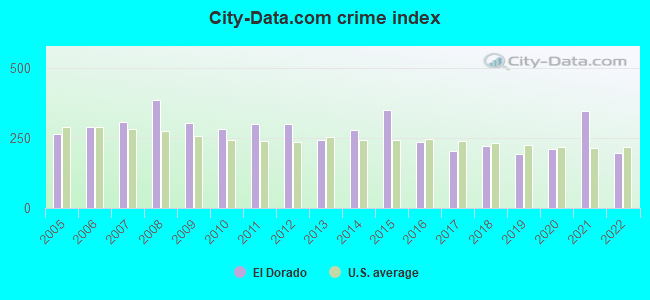
Crime rate in El Dorado detailed stats: murders, rapes, robberies, assaults, burglaries, thefts, arson
Full-time law enforcement employees in 2021, including police officers: 28 (25 officers - 21 male; 4 female).
| Officers per 1,000 residents here: | 1.95 |
| Kansas average: | 2.70 |
 Recent articles from our blog. Our writers, many of them Ph.D. graduates or candidates, create easy-to-read articles on a wide variety of topics.

 | Living here sucks...here's why (120 replies) |
| Why would I hate Wichita? (31 replies) |
| Kansas Passes New Budget With Tax Increases (88 replies) |
| Landlord + landlord association blackballing tenants (10 replies) |
| Moving to Wichita - Couple, no kids - groups, activities to join? (8 replies) |
| El Dorado Background (1 reply) |
Latest news from El Dorado, KS collected exclusively by city-data.com from local newspapers, TV, and radio stations
Ancestries: American (18.1%), German (16.5%), Irish (9.2%), English (9.0%), European (6.3%), Greek (1.8%).
Current Local Time: CST time zone
Incorporated on 09/12/1871
Elevation: 1344 feet
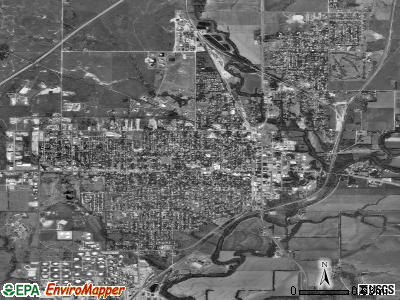
Land area: 6.37 square miles.
Population density: 2,021 people per square mile (low).
286 residents are foreign born (1.4% Asia, 0.5% Europe).
| This city: | 2.2% |
| Kansas: | 7.1% |
Median real estate property taxes paid for housing units with mortgages in 2022: $2,455 (1.8%)
Median real estate property taxes paid for housing units with no mortgage in 2022: $1,744 (2.1%)
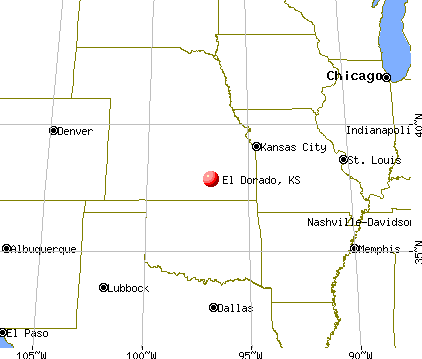
Nearest city with pop. 50,000+: Wichita, KS  (27.7 miles , pop. 344,284).
Nearest city with pop. 1,000,000+: Dallas, TX (347.4 miles , pop. 1,188,580).
Nearest cities:
), ), )Latitude: 37.82 N, Longitude: 96.86 W
Daytime population change due to commuting: -239 (-1.8%)
Workers who live and work in this city: 3,830 (55.5%)
Area code: 316
El Dorado, Kansas accommodation & food services, waste management - Economy and Business Data
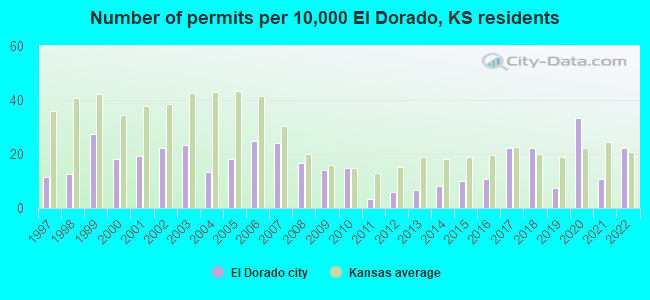
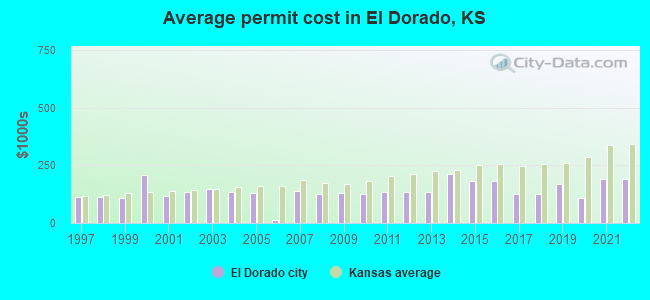
Single-family new house construction building permits:
- 2022: 27 buildings, average cost: $190,300
- 2021: 13 buildings, average cost: $190,000
- 2020: 40 buildings, average cost: $108,700
- 2019: 9 buildings, average cost: $168,900
- 2018: 27 buildings, average cost: $124,000
- 2017: 27 buildings, average cost: $124,000
- 2016: 13 buildings, average cost: $179,500
- 2015: 12 buildings, average cost: $179,500
- 2014: 10 buildings, average cost: $212,000
- 2013: 8 buildings, average cost: $133,200
- 2012: 7 buildings, average cost: $133,100
- 2011: 4 buildings, average cost: $133,800
- 2010: 18 buildings, average cost: $127,200
- 2009: 17 buildings, average cost: $127,600
- 2008: 20 buildings, average cost: $126,100
- 2007: 29 buildings, average cost: $138,800
- 2006: 30 buildings, average cost: $12,000
- 2005: 22 buildings, average cost: $130,600
- 2004: 16 buildings, average cost: $132,900
- 2003: 28 buildings, average cost: $145,600
- 2002: 27 buildings, average cost: $134,300
- 2001: 23 buildings, average cost: $117,100
- 2000: 22 buildings, average cost: $207,100
- 1999: 33 buildings, average cost: $108,900
- 1998: 15 buildings, average cost: $112,000
- 1997: 14 buildings, average cost: $112,000
| Here: | 2.1% |
| Kansas: | 2.0% |
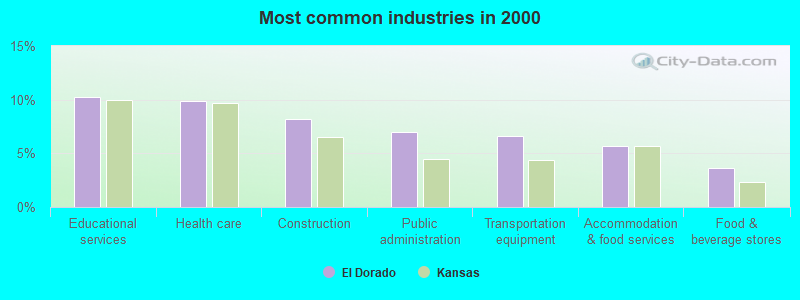
- Educational services (10.3%)
- Health care (9.9%)
- Construction (8.2%)
- Public administration (7.0%)
- Transportation equipment (6.6%)
- Accommodation & food services (5.7%)
- Food & beverage stores (3.6%)
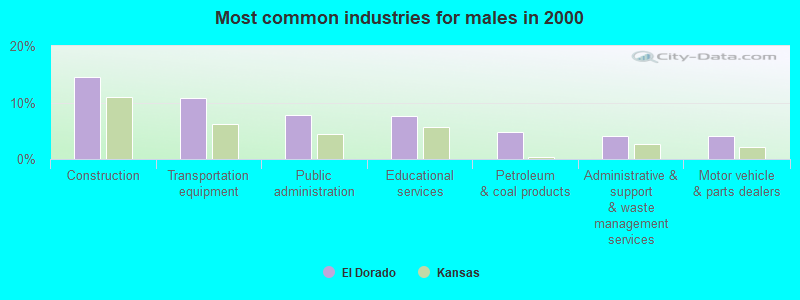
- Construction (14.5%)
- Transportation equipment (10.7%)
- Public administration (7.8%)
- Educational services (7.7%)
- Petroleum & coal products (4.8%)
- Administrative & support & waste management services (4.1%)
- Motor vehicle & parts dealers (4.0%)
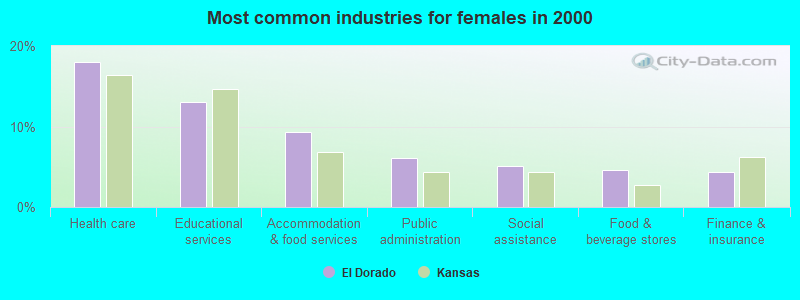
- Health care (18.0%)
- Educational services (13.1%)
- Accommodation & food services (9.3%)
- Public administration (6.1%)
- Social assistance (5.1%)
- Food & beverage stores (4.6%)
- Finance & insurance (4.4%)
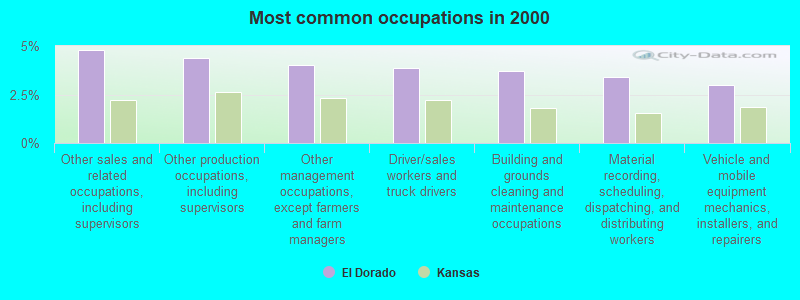
- Other sales and related occupations, including supervisors (4.8%)
- Other production occupations, including supervisors (4.4%)
- Other management occupations, except farmers and farm managers (4.0%)
- Driver/sales workers and truck drivers (3.9%)
- Building and grounds cleaning and maintenance occupations (3.7%)
- Material recording, scheduling, dispatching, and distributing workers (3.4%)
- Vehicle and mobile equipment mechanics, installers, and repairers (3.0%)
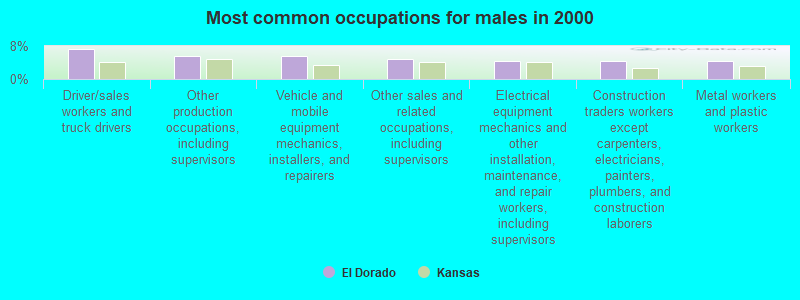
- Driver/sales workers and truck drivers (7.2%)
- Other production occupations, including supervisors (5.7%)
- Vehicle and mobile equipment mechanics, installers, and repairers (5.6%)
- Other sales and related occupations, including supervisors (4.9%)
- Electrical equipment mechanics and other installation, maintenance, and repair workers, including supervisors (4.4%)
- Construction traders workers except carpenters, electricians, painters, plumbers, and construction laborers (4.4%)
- Metal workers and plastic workers (4.4%)
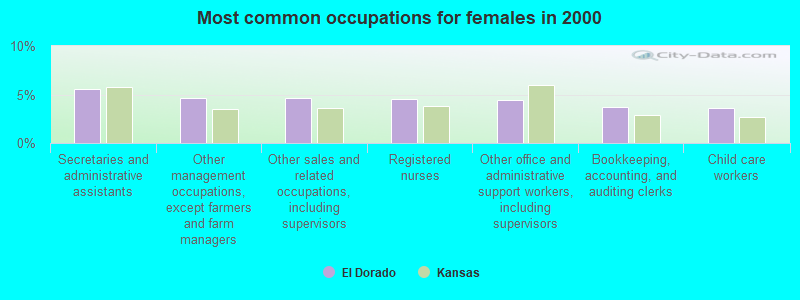
- Secretaries and administrative assistants (5.5%)
- Other management occupations, except farmers and farm managers (4.7%)
- Other sales and related occupations, including supervisors (4.6%)
- Registered nurses (4.5%)
- Other office and administrative support workers, including supervisors (4.4%)
- Bookkeeping, accounting, and auditing clerks (3.7%)
- Child care workers (3.6%)
Average climate in El Dorado, Kansas
Based on data reported by over 4,000 weather stations


|
|


Tornado activity:
El Dorado-area historical tornado activity is near Kansas state average. It is 86% greater than the overall U.S. average.
On 4/26/1991, a category F5 (max. wind speeds 261-318 mph) tornado 5.5 miles away from the El Dorado city center killed 17 people and injured 225 people and caused between $50,000,000 and $500,000,000 in damages.
On 6/10/1958, a category F4 (max. wind speeds 207-260 mph) tornado 0.8 miles away from the city center killed 15 people and injured 5 people and caused between $500,000 and $5,000,000 in damages.
Earthquake activity:
El Dorado-area historical earthquake activity is significantly above Kansas state average. It is 780% greater than the overall U.S. average.On 9/3/2016 at 12:02:44, a magnitude 5.8 (5.8 MW, Depth: 3.5 mi, Class: Moderate, Intensity: VI - VII) earthquake occurred 96.6 miles away from the city center
On 11/6/2011 at 03:53:10, a magnitude 5.7 (5.7 MW, Depth: 3.2 mi) earthquake occurred 158.4 miles away from El Dorado center
On 11/12/2014 at 21:40:00, a magnitude 4.9 (4.9 MW, Depth: 2.5 mi, Class: Light, Intensity: IV - V) earthquake occurred 56.5 miles away from the city center
On 2/13/2016 at 17:07:06, a magnitude 5.1 (5.1 MW, Depth: 5.2 mi) earthquake occurred 137.4 miles away from the city center
On 11/7/2016 at 01:44:24, a magnitude 5.0 (5.0 MW, Depth: 2.8 mi) earthquake occurred 126.6 miles away from the city center
On 11/30/2015 at 09:49:12, a magnitude 4.7 (4.7 MW, Depth: 3.5 mi) earthquake occurred 99.1 miles away from the city center
Magnitude types: moment magnitude (MW)
Natural disasters:
The number of natural disasters in Butler County (23) is greater than the US average (15).Major Disasters (Presidential) Declared: 19
Emergencies Declared: 2
Causes of natural disasters: Floods: 15, Storms: 14, Tornadoes: 9, Winds: 5, Winter Storms: 5, Heavy Rain: 1, Hurricane: 1, Ice Storm: 1, Landslide: 1, Mudslide: 1, Snow: 1, Snowstorm: 1, Other: 1 (Note: some incidents may be assigned to more than one category).

Hospitals and medical centers in El Dorado:
Airports located in El Dorado:
- El Dorado/Captain Jack Thomas Memorial Airport (EQA) (Runways: 2, Itinerant Ops: 3,500, Local Ops: 9,700, Military Ops: 25)
- Patty Field Airport (9K6) (Runways: 1, Itinerant Ops: 50, Local Ops: 600)
- Foster Field Airport (SN58) (Runways: 1)
College/University in El Dorado:
Other colleges/universities with over 2000 students near El Dorado:
- Wichita Area Technical College (about 21 miles; Wichita, KS; Full-time enrollment: 2,220)
- Wichita State University (about 26 miles; Wichita, KS; FT enrollment: 11,743)
- Friends University (about 30 miles; Wichita, KS; FT enrollment: 2,024)
- Newman University (about 31 miles; Wichita, KS; FT enrollment: 2,066)
- Wichita Technical Institute (about 31 miles; Wichita, KS; FT enrollment: 2,015)
- Cowley County Community College (about 54 miles; Arkansas City, KS; FT enrollment: 3,173)
- Emporia State University (about 56 miles; Emporia, KS; FT enrollment: 4,687)
Public high school in El Dorado:
- EL DORADO HIGH (Students: 619, Location: 401 MCCOLLUM ROAD, Grades: 9-12)
Public elementary/middle schools in El Dorado:
- EL DORADO MIDDLE (Students: 487, Location: 440 E WILDCAT WAY, Grades: 6-8)
- GRANDVIEW ELEM (Students: 259, Location: 1300 LAWNDALE ST, Grades: PK-5)
- SKELLY ELEMENTARY SCHOOL (Students: 226, Location: 951 SKELLY STREET, Grades: PK-5)
- JEFFERSON ELEM (Students: 192, Location: 1216 W THIRD, Grades: PK-2)
- LINCOLN ELEM (Location: 522 WEST FIFTH STREET, Grades: 3-5)
- CIRCLE OIL HILL ELEMENTARY (Location: 2700 W 6TH AVE, Grades: PK-6)
Points of interest:
Notable locations in El Dorado: American Legion Golf Course (A), Prairie Trails Golf and Country Club (B), El Dorado Wastewater Treatment Facility (C), McDonald Baseball Stadium (D), El Dorado Business Park (E), Fifth and Main Plaza (F), El Dorado Plaza (G), Butler County Community Building (H), Butler County Sheriff's Office (I), El Dorado Police Department (J), Butler County Judicial Center (K), Bradford Memorial Library (L), Butler County Emergency Medical Services (M), Butler County Courthouse (N), Butler County Health Department (O), Butler County History Center and Kansas Oil Museum (P), Rolla A Clymer Research Facility (Q), Playhouse Doll Museum (R), Coutts Memorial Museum of Art (S), El Dorado City Hall (T). Display/hide their locations on the map
Shopping Center: North Main Shopping Center (1). Display/hide its location on the map
Churches in El Dorado include: Seventh Day Adventist Church of El Dorado (A), Family Worship Center Assembly of God Church (B), The Church of Jesus Christ of Latter Day Saints (C), Salvation Army (D), Pentecostal Lighthouse Church (E), Antioch Baptist Church (F), Calvary Tabernacle First United Pentecostal Church (G), Church of Christ (H), Church of God in Prophecy (I). Display/hide their locations on the map
Cemeteries: Walnut Valley Memorial Park (1), Belle Vista Cemetery (2). Display/hide their locations on the map
Parks in El Dorado include: Summit Park (1), Southwest Park (2), Rice Park (3), Main Park (4), Knutson Park (5), Central Park (6), Gordy Park (7), Graham Park (8), Forest Park (9). Display/hide their locations on the map
Tourist attractions: Butler County Historical Society Museum (383 East Central Avenue), Coutts Memorial Museum (Cultural Attractions- Events- & Facilities; 110 N Main Street), Flint Hills Overland Trips (Recreational Trips & Guides; P O Box 1076).
Hotels: Sunset Inn (1901 West Central Avenue), Heritage Inn (2515 West Central Avenue), Super 8 Motel of El Dorado (2530 West Central Avenue), Country Cottage Square (115 West Kansas Avenue), Red Coach Inns - El Dorado (2525 West Central Avenue), Free & Easy Travel (212 East Central Avenue), El Dorado Motel El Sarape Restaurant (1111 West Central Avenue), Patel I C (1111 West Central Avenue), Stardust Motel (1127 North Main Street).
Courts: Kansas State - El Dorado- District Court Offices- Highway Commission- District (205 Oil Hill Road), Butler-County - Court Services (201 West Pine Avenue), Butler-County - District Court- Clerk Of District Court (201 West Pine Avenue), Kansas State - El Dorado- Materials Dept- District Court Offices- Highway Commis (205 Oil Hill Road), Butler County - Court Services- Adult Probation (121 South Gordy Street), Kansas State - El Dorado- District Court Offices- Highway Commission- Resident Engi (205 Oil Hill Road).
Birthplace of: Daniel Biles - Judge, Beals Becker - Major League Baseball outfielder, Maude Fulton - Actor, Mort Walker - (born 1923), cartoonist, Steve Brodie (actor) - Stevenson, Clarence Beers - Baseball player, Jack Marshall (composer) - Musician, Larry Hartshorn - Player of and football, Tom Borland - Baseball player.
Drinking water stations with addresses in El Dorado and their reported violations in the past:
EL DORADO, CITY OF (Population served: 12,900, Surface water):Past monitoring violations:BUTLER CO RWD 6 (Population served: 2,586, Purch surface water):
- Treatment Technique Precursor Removal - Between APR-2006 and JUN-2006, Contaminant: CARBON, TOTAL. Follow-up actions: St Compliance achieved (JUL-17-2006), St Public Notif requested (AUG-03-2006), St Violation/Reminder Notice (AUG-03-2006), St Public Notif received (OCT-06-2006)
- Treatment Technique Precursor Removal - Between JAN-2006 and MAR-2006, Contaminant: CARBON, TOTAL. Follow-up actions: St Public Notif requested (MAY-12-2006), St Violation/Reminder Notice (MAY-12-2006), St Public Notif received (JUN-09-2006), St Compliance achieved (JUL-17-2006)
- Treatment Technique Precursor Removal - Between OCT-2005 and DEC-2005, Contaminant: CARBON, TOTAL. Follow-up actions: St Public Notif requested (JAN-31-2006), St Violation/Reminder Notice (JAN-31-2006), St Public Notif received (MAR-21-2006), St Compliance achieved (JUL-17-2006)
- Treatment Technique Precursor Removal - Between JUL-2005 and SEP-2005, Contaminant: CARBON, TOTAL. Follow-up actions: St Public Notif requested (NOV-07-2005), St Violation/Reminder Notice (NOV-07-2005), St Public Notif received (DEC-07-2005), St Compliance achieved (JUL-17-2006)
- Treatment Technique Precursor Removal - Between APR-2005 and JUN-2005, Contaminant: CARBON, TOTAL. Follow-up actions: St Public Notif requested (JUL-29-2005), St Violation/Reminder Notice (JUL-29-2005), St Public Notif received (AUG-15-2005), St Compliance achieved (JUL-17-2006)
- One other older monitoring violation
Past health violations:BUTLER CO RWD 2 (Population served: 1,775, Purch surface water):Past monitoring violations:
- MCL, Monthly (TCR) - In JUL-2010, Contaminant: Coliform. Follow-up actions: St Compliance Meeting conducted (JUL-21-2010), St Public Notif requested (JUL-29-2010), St Violation/Reminder Notice (JUL-29-2010), St Public Notif received (AUG-06-2010), St Compliance achieved (AUG-31-2010)
- MCL, Monthly (TCR) - In NOV-2009, Contaminant: Coliform. Follow-up actions: St Violation/Reminder Notice (DEC-07-2009), St Compliance achieved (DEC-31-2009), St Public Notif received (JAN-15-2010)
- MCL, Average - Between OCT-2009 and DEC-2009, Contaminant: TTHM. Follow-up actions: St Compliance achieved (MAR-31-2010)
- MCL, Average - Between OCT-2009 and DEC-2009, Contaminant: Total Haloacetic Acids (HAA5). Follow-up actions: St Compliance achieved (MAR-31-2010)
- MCL, Average - Between JUL-2009 and SEP-2009, Contaminant: TTHM. Follow-up actions: St Public Notif requested (JAN-09-2010), St Violation/Reminder Notice (JAN-09-2010), St Public Notif received (JAN-25-2010), St Compliance achieved (MAR-31-2010)
- MCL, Average - Between JUL-2009 and SEP-2009, Contaminant: Total Haloacetic Acids (HAA5). Follow-up actions: St Public Notif requested (JAN-09-2010), St Violation/Reminder Notice (JAN-09-2010), St Public Notif received (JAN-25-2010), St Compliance achieved (MAR-31-2010)
- Follow-up Or Routine LCR Tap M/R - In OCT-01-2012, Contaminant: Lead and Copper Rule. Follow-up actions: St Public Notif requested (FEB-02-2013), St Violation/Reminder Notice (FEB-02-2013), St Public Notif received (JAN-24-2014)
- Failure Submit IDSE/Subpart V Plan Rpt - In JAN-02-2010, Contaminant: DBP STAGE 2. Follow-up actions: Fed FAO issued (APR-26-2010), Fed Public Notif requested (APR-26-2010), Fed Compliance achieved (JUN-06-2011)
- Monitoring, Routine (IDSE) - Between OCT-2008 and SEP-2009, Contaminant: Total Haloacetic Acids (HAA5). Follow-up actions: Fed FAO issued (APR-26-2010), Fed Public Notif requested (APR-26-2010), Fed Compliance achieved (JUN-06-2011)
- Monitoring, Routine (IDSE) - Between OCT-2008 and SEP-2009, Contaminant: TTHM. Follow-up actions: Fed FAO issued (APR-26-2010), Fed Public Notif requested (APR-26-2010), Fed Compliance achieved (JUN-06-2011)
- One minor monitoring violation
Past monitoring violations:BUTLER CO RWD 1 (Population served: 726, Purch surface water):
- Follow-up Or Routine LCR Tap M/R - In JUL-01-2013, Contaminant: Lead and Copper Rule. Follow-up actions: St Public Notif requested (AUG-17-2013), St Violation/Reminder Notice (AUG-17-2013), St Public Notif received (JUN-30-2014)
- Follow-up Or Routine LCR Tap M/R - In JUL-01-2013, Contaminant: Lead and Copper Rule. Follow-up actions: St Public Notif requested (AUG-17-2013), St Violation/Reminder Notice (AUG-17-2013), St Public Notif received (JUN-30-2014)
- Follow-up Or Routine LCR Tap M/R - In JAN-01-2013, Contaminant: Lead and Copper Rule. Follow-up actions: St Public Notif requested (MAR-11-2013), St Violation/Reminder Notice (MAR-11-2013), St Public Notif received (JUN-30-2014)
- Follow-up Or Routine LCR Tap M/R - In JUL-01-2012, Contaminant: Lead and Copper Rule. Follow-up actions: St Violation/Reminder Notice (AUG-16-2012), St Public Notif requested (AUG-16-2012)
- Follow-up Or Routine LCR Tap M/R - In JAN-01-2012, Contaminant: Lead and Copper Rule. Follow-up actions: St Public Notif requested (AUG-16-2012), St Violation/Reminder Notice (AUG-16-2012), St Public Notif received (JUN-30-2014)
- 3 minor monitoring violations
- 5 other older monitoring violations
Past monitoring violations:
- Failure Submit IDSE/Subpart V Plan Rpt - In JAN-02-2010, Contaminant: DBP STAGE 2. Follow-up actions: Fed FAO issued (APR-26-2010), Fed Public Notif requested (APR-26-2010), Fed Compliance achieved (MAY-25-2011)
- Monitoring, Routine (IDSE) - Between OCT-2008 and SEP-2009, Contaminant: Total Haloacetic Acids (HAA5)
- Monitoring, Routine (IDSE) - Between OCT-2008 and SEP-2009, Contaminant: TTHM
- One minor monitoring violation
| This city: | 2.4 people |
| Kansas: | 2.5 people |
| This city: | 62.7% |
| Whole state: | 66.0% |
| This city: | 6.4% |
| Whole state: | 5.8% |
Likely homosexual households (counted as self-reported same-sex unmarried-partner households)
- Lesbian couples: 0.1% of all households
- Gay men: 0.1% of all households
People in group quarters in El Dorado in 2010:
- 368 people in college/university student housing
- 129 people in nursing facilities/skilled-nursing facilities
- 44 people in group homes intended for adults
People in group quarters in El Dorado in 2000:
- 205 people in nursing homes
- 30 people in local jails and other confinement facilities (including police lockups)
- 13 people in other noninstitutional group quarters
- 12 people in homes for the mentally retarded
- 6 people in homes for the physically handicapped
Banks with branches in El Dorado (2011 data):
- Intrust Bank, National Association: El Dorado Branch at 100 South Main Street, branch established on 1985/07/25; El Dorado West Branch at 2723 West Central, branch established on 2005/08/08. Info updated 2007/03/28: Bank assets: $4,066.0 mil, Deposits: $3,310.3 mil, headquarters in Wichita, KS, positive income, Commercial Lending Specialization, 48 total offices, Holding Company: Intrust Financial Corporation
- Verus Bank: Downtown Branch at 640 North Main Street, branch established on 1998/02/26; West Central Branch at 225 Village Road, branch established on 1995/04/24. Info updated 2012/01/05: Bank assets: $115.8 mil, Deposits: $103.9 mil, headquarters in Derby, KS, positive income, 6 total offices, Holding Company: First Team Resources Corporation
- Community National Bank & Trust: El Dorado Branch at 2815 West Central, branch established on 2001/10/22; El Dorado Branch at 301 North Main Street, branch established on 1998/04/10. Info updated 2011/01/06: Bank assets: $766.3 mil, Deposits: $636.2 mil, headquarters in Chanute, KS, positive income, Commercial Lending Specialization, 25 total offices, Holding Company: Community Bancorp, Inc.
- Emprise Bank: El Dorado Branch at 200 North Main, branch established on 2002/08/19. Info updated 2011/04/13: Bank assets: $1,461.9 mil, Deposits: $1,282.4 mil, headquarters in Wichita, KS, positive income, Commercial Lending Specialization, 42 total offices, Holding Company: Emprise Financial Corporation
- Commerce Bank: El Dorado Branch at 625 W Central, branch established on 1923/05/16. Info updated 2011/07/07: Bank assets: $20,493.6 mil, Deposits: $16,805.3 mil, headquarters in Kansas City, MO, positive income, 206 total offices, Holding Company: Commerce Bancshares, Inc.
- Bank of America, National Association: El Dorado West Central Branch at 2314 West Central, branch established on 1974/12/26. Info updated 2009/11/18: Bank assets: $1,451,969.3 mil, Deposits: $1,077,176.8 mil, headquarters in Charlotte, NC, positive income, 5782 total offices, Holding Company: Bank Of America Corporation
- Bank of the West: El Dorado - Butler at 405 North Main, branch established on 1925/01/01. Info updated 2009/11/16: Bank assets: $62,408.3 mil, Deposits: $43,995.2 mil, headquarters in San Francisco, CA, positive income, 647 total offices, Holding Company: Bnp Paribas
For population 15 years and over in El Dorado:
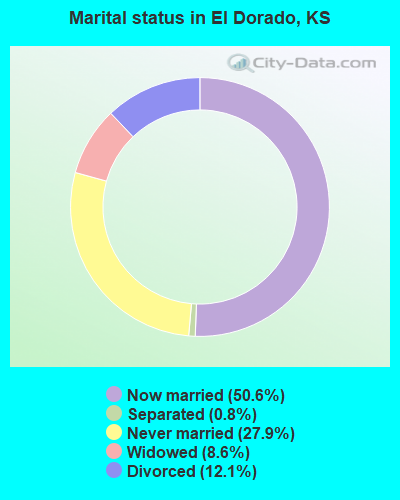
- Never married: 27.9%
- Now married: 50.6%
- Separated: 0.8%
- Widowed: 8.6%
- Divorced: 12.1%
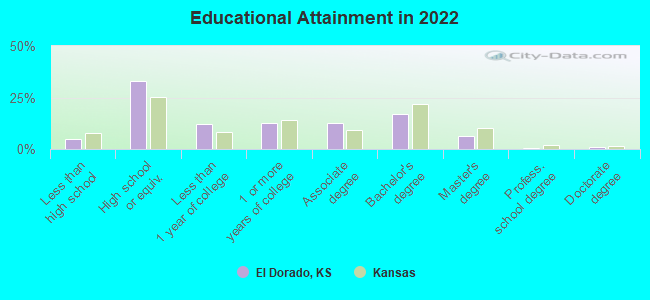
For population 25 years and over in El Dorado:
- High school or higher: 95.0%
- Bachelor's degree or higher: 27.2%
- Graduate or professional degree: 8.3%
- Unemployed: 3.7%
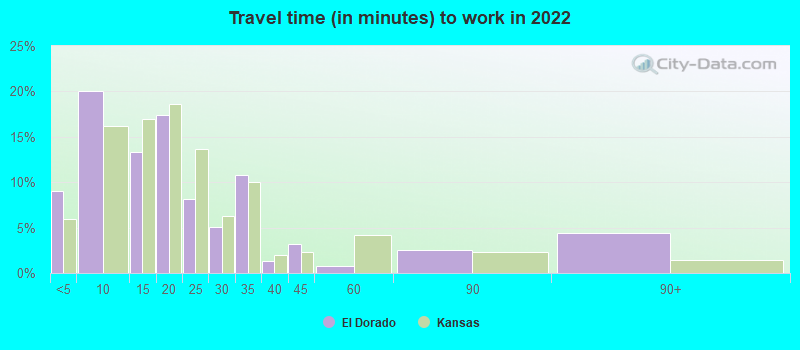
- Mean travel time to work (commute): 16.7 minutes
| Here: | 8.3 |
| Kansas average: | 11.5 |
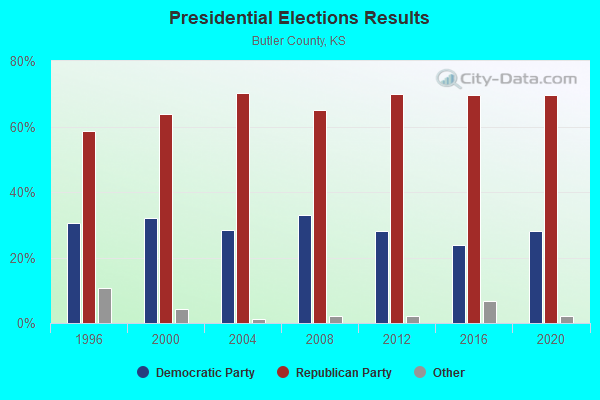
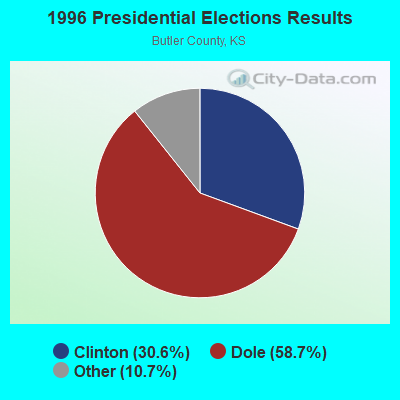

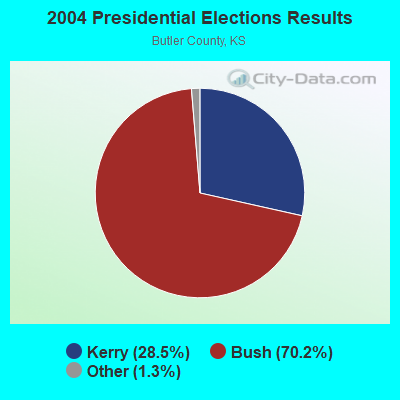
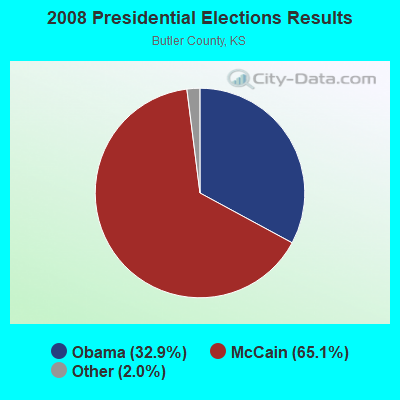

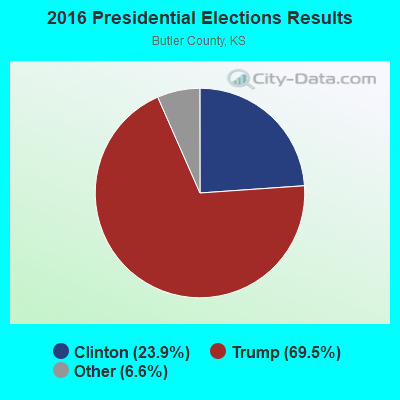

Graphs represent county-level data. Detailed 2008 Election Results
Religion statistics for El Dorado, KS (based on Butler County data)
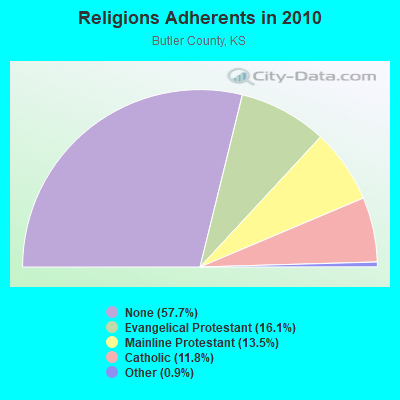
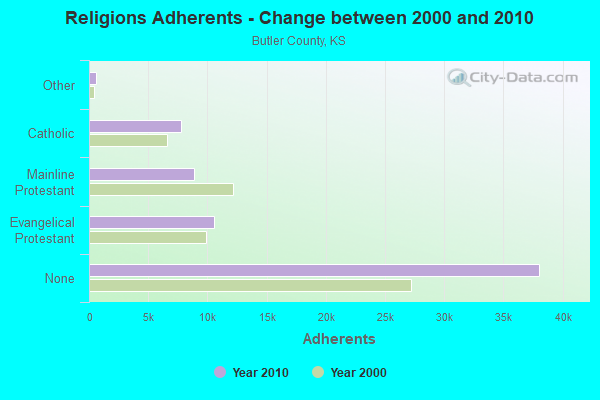
| Religion | Adherents | Congregations |
|---|---|---|
| Evangelical Protestant | 10,598 | 55 |
| Mainline Protestant | 8,866 | 26 |
| Catholic | 7,800 | 3 |
| Other | 571 | 4 |
| None | 38,045 | - |
Food Environment Statistics:
| Here: | 1.11 / 10,000 pop. |
| State: | 1.96 / 10,000 pop. |
| Butler County: | 0.32 / 10,000 pop. |
| State: | 0.51 / 10,000 pop. |
| Butler County: | 3.34 / 10,000 pop. |
| Kansas: | 3.84 / 10,000 pop. |
| Butler County: | 5.25 / 10,000 pop. |
| Kansas: | 7.33 / 10,000 pop. |
| Here: | 8.8% |
| Kansas: | 8.1% |
| This county: | 28.5% |
| State: | 27.9% |
| Butler County: | 9.3% |
| Kansas: | 13.4% |
Health and Nutrition:
| This city: | 50.7% |
| Kansas: | 49.2% |
| This city: | 47.5% |
| Kansas: | 46.3% |
| This city: | 28.7 |
| State: | 28.6 |
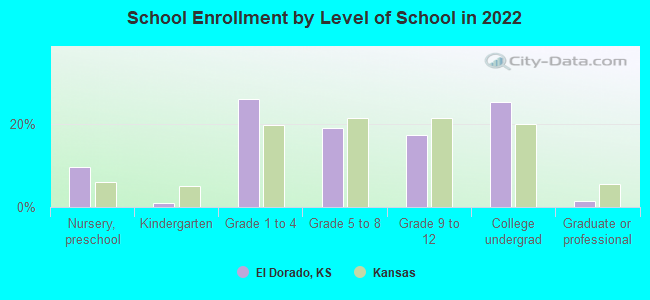
| El Dorado: | 19.8% |
| Kansas: | 21.2% |
| El Dorado: | 11.3% |
| State: | 10.5% |
| Here: | 6.8 |
| State: | 6.8 |
| El Dorado: | 35.3% |
| Kansas: | 33.5% |
| El Dorado: | 56.8% |
| State: | 56.0% |
| This city: | 77.8% |
| State: | 78.6% |
More about Health and Nutrition of El Dorado, KS Residents
| Local government employment and payroll (March 2022) | |||||
| Function | Full-time employees | Monthly full-time payroll | Average yearly full-time wage | Part-time employees | Monthly part-time payroll |
|---|---|---|---|---|---|
| Police Protection - Officers | 23 | $114,339 | $59,655 | 0 | $0 |
| Other and Unallocable | 17 | $69,940 | $49,369 | 1 | $2,013 |
| Streets and Highways | 15 | $61,154 | $48,923 | 1 | $2,860 |
| Firefighters | 15 | $71,197 | $56,958 | 0 | $0 |
| Parks and Recreation | 12 | $52,113 | $52,113 | 42 | $23,846 |
| Water Supply | 11 | $55,516 | $60,563 | 6 | $5,731 |
| Sewerage | 10 | $47,576 | $57,091 | 2 | $8,147 |
| Other Government Administration | 9 | $70,603 | $94,137 | 0 | $0 |
| Solid Waste Management | 8 | $30,510 | $45,765 | 0 | $0 |
| Financial Administration | 8 | $40,263 | $60,395 | 0 | $0 |
| Police - Other | 3 | $12,348 | $49,392 | 0 | $0 |
| Local Libraries | 2 | $8,353 | $50,118 | 20 | $32,199 |
| Judicial and Legal | 2 | $8,985 | $53,910 | 0 | $0 |
| Electric Power | 1 | $4,866 | $58,392 | 0 | $0 |
| Airports | 1 | $5,405 | $64,860 | 0 | $0 |
| Totals for Government | 137 | $653,168 | $57,212 | 72 | $74,796 |
El Dorado government finances - Expenditure in 2021 (per resident):
- Construction - General - Other: $1,736,000 ($134.94)
- Current Operations - Water Utilities: $2,542,000 ($197.59)
Police Protection: $2,369,000 ($184.14)
Local Fire Protection: $1,897,000 ($147.45)
Sewerage: $1,803,000 ($140.15)
General - Other: $1,649,000 ($128.18)
Financial Administration: $1,574,000 ($122.35)
Solid Waste Management: $1,471,000 ($114.34)
Parks and Recreation: $1,274,000 ($99.03)
Air Transportation: $633,000 ($49.20)
Regular Highways: $600,000 ($46.64)
Central Staff Services: $581,000 ($45.16)
Libraries: $547,000 ($42.52)
Health - Other: $274,000 ($21.30)
Judicial and Legal Services: $231,000 ($17.96)
Miscellaneous Commercial Activities - Other: $178,000 ($13.84)
Gas Utilities: $20,000 ($1.55)
- General - Interest on Debt: $3,737,000 ($290.48)
- Other Capital Outlay - General - Other: $274,000 ($21.30)
Air Transportation: $97,000 ($7.54)
Water Utilities: $51,000 ($3.96)
Sewerage: $36,000 ($2.80)
Libraries: $5,000 ($0.39)
- Total Salaries and Wages: $5,015,000 ($389.82)
- Water Utilities - Interest on Debt: $1,950,000 ($151.57)
El Dorado government finances - Revenue in 2021 (per resident):
- Charges - Sewerage: $2,626,000 ($204.12)
Solid Waste Management: $1,604,000 ($124.68)
Other: $762,000 ($59.23)
Air Transportation: $180,000 ($13.99)
Parks and Recreation: $2,000 ($0.16)
- Miscellaneous - Interest Earnings: $3,901,000 ($303.23)
General Revenue - Other: $1,079,000 ($83.87)
Special Assessments: $920,000 ($71.51)
Fines and Forfeits: $840,000 ($65.29)
Royalties: $57,000 ($4.43)
- Revenue - Water Utilities: $4,399,000 ($341.94)
Gas Utilities: $27,000 ($2.10)
- State Intergovernmental - Highways: $424,000 ($32.96)
Other: $307,000 ($23.86)
Health and Hospitals: $102,000 ($7.93)
General Local Government Support: $36,000 ($2.80)
- Tax - Property: $5,485,000 ($426.35)
General Sales and Gross Receipts: $2,607,000 ($202.64)
Public Utilities Sales: $1,216,000 ($94.52)
Other Selective Sales: $367,000 ($28.53)
Other License: $202,000 ($15.70)
El Dorado government finances - Debt in 2021 (per resident):
- Long Term Debt - Beginning Outstanding - Unspecified Public Purpose: $75,727,000 ($5886.28)
Outstanding Unspecified Public Purpose: $73,264,000 ($5694.83)
Beginning Outstanding - Public Debt for Private Purpose: $50,981,000 ($3962.77)
Outstanding Nonguaranteed - Industrial Revenue: $48,857,000 ($3797.67)
Retired Unspecified Public Purpose: $2,463,000 ($191.45)
Retired Nonguaranteed - Public Debt for Private Purpose: $2,124,000 ($165.10)
El Dorado government finances - Cash and Securities in 2021 (per resident):
- Other Funds - Cash and Securities: $13,303,000 ($1034.05)
- Sinking Funds - Cash and Securities: $97,454,000 ($7575.13)
| Businesses in El Dorado, KS | ||||
| Name | Count | Name | Count | |
|---|---|---|---|---|
| AT&T | 1 | MasterBrand Cabinets | 3 | |
| Ace Hardware | 1 | McDonald's | 2 | |
| Arby's | 1 | Nike | 2 | |
| Best Western | 1 | Pizza Hut | 2 | |
| Blockbuster | 1 | RadioShack | 1 | |
| Burger King | 1 | SONIC Drive-In | 1 | |
| Cricket Wireless | 1 | Sears | 1 | |
| Dairy Queen | 1 | Subway | 2 | |
| FedEx | 1 | Super 8 | 1 | |
| GameStop | 1 | T-Mobile | 2 | |
| Goodwill | 1 | Taco Bell | 1 | |
| H&R Block | 1 | U-Haul | 3 | |
| Holiday Inn | 1 | UPS | 2 | |
| KFC | 1 | Walgreens | 1 | |
| Kroger | 1 | Walmart | 1 | |
| Long John Silver's | 1 | YMCA | 1 | |
Strongest AM radio stations in El Dorado:
- KAHS (1360 AM; 1 kW; EL DORADO, KS; Owner: REUNION BROADCASTING L.L.C.)
- KFTI (1070 AM; 10 kW; WICHITA, KS; Owner: JOURNAL BROADCAST CORPORATION)
- KFH (1330 AM; 5 kW; WICHITA, KS; Owner: ENTERCOM WICHITA LICENSE, LLC)
- KQAM (1480 AM; 5 kW; WICHITA, KS; Owner: ABC, INC.)
- KMYR (1410 AM; 5 kW; WICHITA, KS; Owner: AGAPE COMMUNICATIONS, INC.)
- KRMG (740 AM; 50 kW; TULSA, OK; Owner: CXR HOLDINGS, INC.)
- KFAQ (1170 AM; 50 kW; TULSA, OK; Owner: JOURNAL BROADCAST CORPORATION)
- WHB (810 AM; 50 kW; KANSAS CITY, MO; Owner: UNION BROADCASTING, INC.)
- KGGF (690 AM; 10 kW; COFFEYVILLE, KS; Owner: KGGF-KUSN, INC.)
- KTBZ (1430 AM; 25 kW; TULSA, OK; Owner: CLEAR CHANNEL BROADCASTING LICENSES, INC.)
- KOMA (1520 AM; 50 kW; OKLAHOMA CITY, OK; Owner: RENDA BROADCASTING CORP. OF NEVADA)
- KMUS (1380 AM; 20 kW; MUSKOGEE, OK; Owner: ABC, INC.)
- KRVN (880 AM; 50 kW; LEXINGTON, NE; Owner: NEBRASKA RURAL RADIO ASSOCIATION)
Strongest FM radio stations in El Dorado:
- KTLI (99.1 FM; EL DORADO, KS; Owner: ADONAI RADIO GROUP, INC.)
- KFXJ (104.5 FM; AUGUSTA, KS; Owner: JOURNAL BROADCAST CORPORATION)
- KBTL (88.1 FM; EL DORADO, KS; Owner: BUTLER COUNTY COMMUNITY COLLEGE)
- KYQQ (106.5 FM; ARKANSAS CITY, KS; Owner: JOURNAL BROADCAST CORPORATION)
- KEYN-FM (103.7 FM; WICHITA, KS; Owner: ENTERCOM WICHITA LICENSE, LLC)
- KFDI-FM (101.3 FM; WICHITA, KS; Owner: JOURNAL BROADCAST CORPORATION)
- KRBB (97.9 FM; WICHITA, KS; Owner: CAPSTAR TX LIMITED PARTNERSHIP)
- KZSN (102.1 FM; HUTCHINSON, KS; Owner: CAPSTAR TX LIMITED PARTNERSHIP)
- KFBZ (105.3 FM; HAYSVILLE, KS; Owner: ENTERCOM WICHITA LICENSE, LLC)
- KICT-FM (95.1 FM; WICHITA, KS; Owner: JOURNAL BROADCAST CORPORATION)
- KKRD (107.3 FM; WICHITA, KS; Owner: CAPSTAR TX LIMITED PARTNERSHIP)
- KRZZ-FM (96.3 FM; DERBY, KS; Owner: CAPSTAR TX LIMITED PARTNERSHIP)
- KMXW (92.3 FM; NEWTON, KS; Owner: JOURNAL BROADCAST CORPORATION)
- KMUW (89.1 FM; WICHITA, KS; Owner: WICHITA STATE UNIVERSITY)
- KBDD (91.9 FM; WINFILED, KS; Owner: AMERICAN FAMILY ASSOCIATION)
TV broadcast stations around El Dorado:
- KSNW (Channel 3; WICHITA, KS; Owner: EMMIS TELEVISION LICENSE CORPORATION OF WICHITA)
- KSAS-TV (Channel 24; WICHITA, KS; Owner: CLEAR CHANNEL BROADCASTING LICENSES, INC.)
- KWCV (Channel 33; WICHITA, KS; Owner: WLBB BROADCASTING, L.L.C.)
- KTQW-LP (Channel 53; WICHITA, KS; Owner: KNOWLEDGE L.C.)
- KSCC (Channel 36; HUTCHINSON, KS; Owner: MERCURY BROADCASTING COMPANY, INC.)
- KAKE-TV (Channel 10; WICHITA, KS; Owner: GRAY MIDAMERICA TV LICENSEE CORP.)
- KWCH-TV (Channel 12; HUTCHINSON, KS; Owner: MEDIA GENERAL BROADCASTING OF SO. CAROLINA HOLDINGS, INC.)
- KCTU-LP (Channel 55; WICHITA, KS; Owner: RIVER CITY BROADCASTING CORP.)
- KSMI-LP (Channel 51; WICHITA, KS; Owner: RIVER CITY BROADCASTING CORP.)
- KFVT-LP (Channel 40; WICHITA, KS; Owner: LOCKE SUPPLY CO.)
- National Bridge Inventory (NBI) Statistics
- 94Number of bridges
- 909ft / 277mTotal length
- $1,805,000Total costs
- 293,127Total average daily traffic
- 57,139Total average daily truck traffic
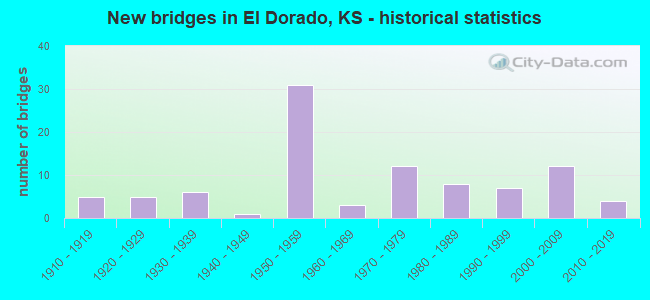
- New bridges - historical statistics
- 51910-1919
- 51920-1929
- 61930-1939
- 11940-1949
- 311950-1959
- 31960-1969
- 121970-1979
- 81980-1989
- 71990-1999
- 122000-2009
- 42010-2019
FCC Registered Antenna Towers: 113 (See the full list of FCC Registered Antenna Towers)
FCC Registered Commercial Land Mobile Towers: 1 (See the full list of FCC Registered Commercial Land Mobile Towers in El Dorado, KS)
FCC Registered Private Land Mobile Towers: 1 (See the full list of FCC Registered Private Land Mobile Towers)
FCC Registered Broadcast Land Mobile Towers: 35 (See the full list of FCC Registered Broadcast Land Mobile Towers)
FCC Registered Microwave Towers: 33 (See the full list of FCC Registered Microwave Towers in this town)
FCC Registered Paging Towers: 3 (See the full list of FCC Registered Paging Towers)
FCC Registered Maritime Coast & Aviation Ground Towers: 4 (See the full list of FCC Registered Maritime Coast & Aviation Ground Towers)
FCC Registered Amateur Radio Licenses: 98 (See the full list of FCC Registered Amateur Radio Licenses in El Dorado)
FAA Registered Aircraft: 41 (See the full list of FAA Registered Aircraft in El Dorado)
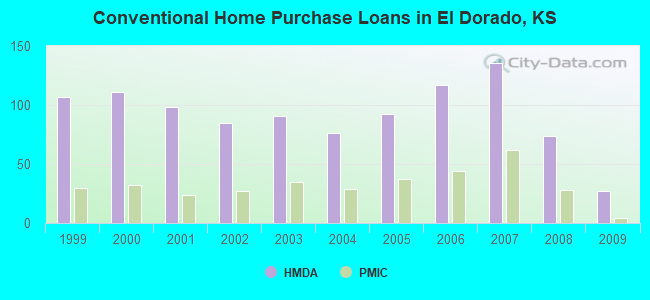
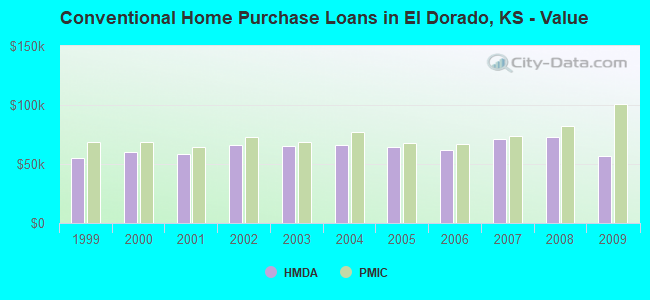
| Home Mortgage Disclosure Act Aggregated Statistics For Year 2009 (Based on 1 full and 7 partial tracts) | ||||||||||||||
| A) FHA, FSA/RHS & VA Home Purchase Loans | B) Conventional Home Purchase Loans | C) Refinancings | D) Home Improvement Loans | E) Loans on Dwellings For 5+ Families | F) Non-occupant Loans on < 5 Family Dwellings (A B C & D) | G) Loans On Manufactured Home Dwelling (A B C & D) | ||||||||
|---|---|---|---|---|---|---|---|---|---|---|---|---|---|---|
| Number | Average Value | Number | Average Value | Number | Average Value | Number | Average Value | Number | Average Value | Number | Average Value | Number | Average Value | |
| LOANS ORIGINATED | 52 | $80,494 | 27 | $56,471 | 78 | $80,532 | 39 | $19,498 | 2 | $99,040 | 29 | $57,036 | 1 | $38,970 |
| APPLICATIONS APPROVED, NOT ACCEPTED | 3 | $76,197 | 1 | $75,570 | 10 | $119,201 | 3 | $8,427 | 0 | $0 | 1 | $353,700 | 0 | $0 |
| APPLICATIONS DENIED | 11 | $68,384 | 7 | $52,474 | 32 | $84,813 | 17 | $36,496 | 0 | $0 | 4 | $30,090 | 0 | $0 |
| APPLICATIONS WITHDRAWN | 6 | $74,828 | 2 | $37,885 | 21 | $71,918 | 6 | $22,953 | 0 | $0 | 1 | $35,180 | 2 | $32,795 |
| FILES CLOSED FOR INCOMPLETENESS | 2 | $91,210 | 0 | $0 | 4 | $100,282 | 0 | $0 | 0 | $0 | 0 | $0 | 0 | $0 |
Detailed HMDA statistics for the following Tracts: 0201.00 , 0202.01, 0203.00, 0204.00, 0205.00
| Private Mortgage Insurance Companies Aggregated Statistics For Year 2009 (Based on 7 partial tracts) | ||||
| A) Conventional Home Purchase Loans | B) Refinancings | |||
|---|---|---|---|---|
| Number | Average Value | Number | Average Value | |
| LOANS ORIGINATED | 4 | $100,862 | 5 | $75,854 |
| APPLICATIONS APPROVED, NOT ACCEPTED | 1 | $96,840 | 0 | $0 |
| APPLICATIONS DENIED | 0 | $0 | 0 | $0 |
| APPLICATIONS WITHDRAWN | 0 | $0 | 0 | $0 |
| FILES CLOSED FOR INCOMPLETENESS | 0 | $0 | 0 | $0 |
Detailed PMIC statistics for the following Tracts: 0201.00 , 0202.01, 0203.00, 0204.00, 0205.00
2002 - 2018 National Fire Incident Reporting System (NFIRS) incidents
- Fire incident types reported to NFIRS in El Dorado, KS
- 1,56661.7%Outside Fires
- 58623.1%Structure Fires
- 32212.7%Mobile Property/Vehicle Fires
- 652.6%Other
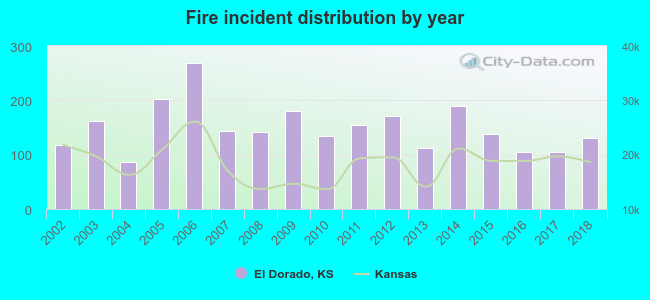 Based on the data from the years 2002 - 2018 the average number of fires per year is 149. The highest number of fires - 268 took place in 2006, and the least - 86 in 2004. The data has a growing trend.
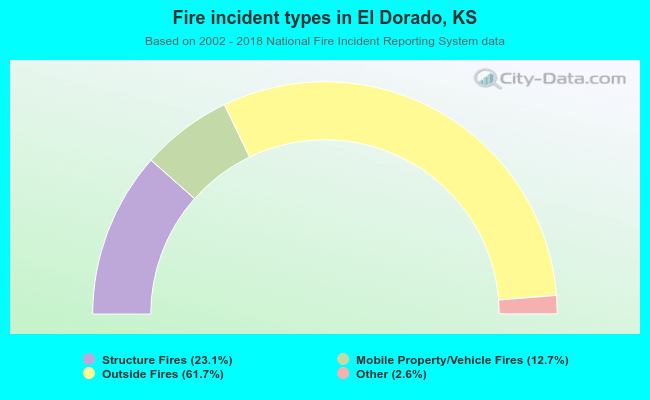 When looking into fire subcategories, the most reports belonged to: Outside Fires (61.7%), and Structure Fires (23.1%).
Fire-safe hotels and motels in El Dorado, Kansas:
- El Dorado Motel & Restaurant, 1111 E Central, El Dorado, Kansas 67042 , Phone: (316) 321-3610
- Holiday Inn Express Hotel & Suites, 3100 W El Dorado Ave, El Dorado, Kansas 67042 , Phone: (316) 322-7275, Fax: (316) 321-0580
| Most common first names in El Dorado, KS among deceased individuals | ||
| Name | Count | Lived (average) |
|---|---|---|
| Mary | 132 | 79.8 years |
| William | 114 | 76.4 years |
| John | 110 | 76.8 years |
| James | 98 | 72.8 years |
| Charles | 92 | 79.1 years |
| Robert | 91 | 69.3 years |
| George | 67 | 78.4 years |
| Dorothy | 53 | 77.8 years |
| Anna | 48 | 86.9 years |
| Ruth | 46 | 80.8 years |
| Most common last names in El Dorado, KS among deceased individuals | ||
| Last name | Count | Lived (average) |
|---|---|---|
| Smith | 86 | 79.5 years |
| Jones | 49 | 75.4 years |
| Wilson | 41 | 72.7 years |
| Miller | 38 | 75.9 years |
| Johnson | 35 | 78.8 years |
| Brown | 32 | 76.7 years |
| Thompson | 32 | 77.6 years |
| Anderson | 30 | 76.2 years |
| Williams | 29 | 75.2 years |
| Baker | 26 | 81.7 years |
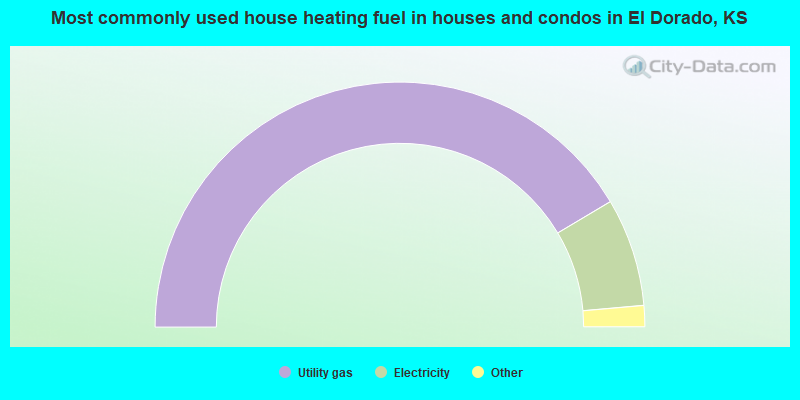
- 82.9%Utility gas
- 14.3%Electricity
- 1.8%Other fuel
- 0.6%No fuel used
- 0.4%Bottled, tank, or LP gas
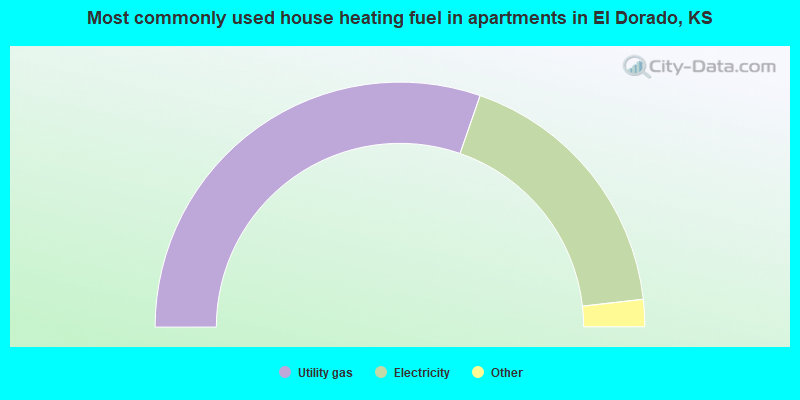
- 60.7%Utility gas
- 35.8%Electricity
- 3.2%Bottled, tank, or LP gas
- 0.4%No fuel used
El Dorado compared to Kansas state average:
- Median house value below state average.
- Unemployed percentage significantly below state average.
- Black race population percentage significantly below state average.
- Hispanic race population percentage below state average.
- Foreign-born population percentage significantly below state average.
- Length of stay since moving in significantly above state average.
El Dorado on our top lists:
- #61 on the list of "Top 101 cities with the smallest percentage of likely homosexual households (counted as self-reported same-sex unmarried-partner households) (population 5,000+)"
- #46 on the list of "Top 101 counties with the lowest ground withdrawal of fresh water for public supply (pop. 50,000+)"
- #101 on the list of "Top 101 counties with highest percentage of residents voting for Romney (Republican) in the 2012 Presidential Election (pop. 50,000+)"

|
|
Total of 10 patent applications in 2008-2024.