El Centro, California Submit your own pictures of this city and show them to the world
OSM Map
General Map
Google Map
MSN Map
OSM Map
General Map
Google Map
MSN Map
OSM Map
General Map
Google Map
MSN Map
OSM Map
General Map
Google Map
MSN Map
Please wait while loading the map...
Population in 2022: 43,811 (100% urban, 0% rural). Population change since 2000: +15.8%Males: 21,767 Females: 22,044
March 2022 cost of living index in El Centro: 93.9 (less than average, U.S. average is 100) Percentage of residents living in poverty in 2022: 21.1%for White Non-Hispanic residents , 22.4% for Black residents , 21.5% for Hispanic or Latino residents , 57.1% for American Indian residents , 5.3% for Native Hawaiian and other Pacific Islander residents , 20.6% for other race residents , 26.8% for two or more races residents )
Profiles of local businesses
Business Search - 14 Million verified businesses
Data:
Median household income ($)
Median household income (% change since 2000)
Household income diversity
Ratio of average income to average house value (%)
Ratio of average income to average rent
Median household income ($) - White
Median household income ($) - Black or African American
Median household income ($) - Asian
Median household income ($) - Hispanic or Latino
Median household income ($) - American Indian and Alaska Native
Median household income ($) - Multirace
Median household income ($) - Other Race
Median household income for houses/condos with a mortgage ($)
Median household income for apartments without a mortgage ($)
Races - White alone (%)
Races - White alone (% change since 2000)
Races - Black alone (%)
Races - Black alone (% change since 2000)
Races - American Indian alone (%)
Races - American Indian alone (% change since 2000)
Races - Asian alone (%)
Races - Asian alone (% change since 2000)
Races - Hispanic (%)
Races - Hispanic (% change since 2000)
Races - Native Hawaiian and Other Pacific Islander alone (%)
Races - Native Hawaiian and Other Pacific Islander alone (% change since 2000)
Races - Two or more races (%)
Races - Two or more races (% change since 2000)
Races - Other race alone (%)
Races - Other race alone (% change since 2000)
Racial diversity
Unemployment (%)
Unemployment (% change since 2000)
Unemployment (%) - White
Unemployment (%) - Black or African American
Unemployment (%) - Asian
Unemployment (%) - Hispanic or Latino
Unemployment (%) - American Indian and Alaska Native
Unemployment (%) - Multirace
Unemployment (%) - Other Race
Population density (people per square mile)
Population - Males (%)
Population - Females (%)
Population - Males (%) - White
Population - Males (%) - Black or African American
Population - Males (%) - Asian
Population - Males (%) - Hispanic or Latino
Population - Males (%) - American Indian and Alaska Native
Population - Males (%) - Multirace
Population - Males (%) - Other Race
Population - Females (%) - White
Population - Females (%) - Black or African American
Population - Females (%) - Asian
Population - Females (%) - Hispanic or Latino
Population - Females (%) - American Indian and Alaska Native
Population - Females (%) - Multirace
Population - Females (%) - Other Race
Coronavirus confirmed cases (May 23, 2024)
Deaths caused by coronavirus (May 23, 2024)
Coronavirus confirmed cases (per 100k population) (May 23, 2024)
Deaths caused by coronavirus (per 100k population) (May 23, 2024)
Daily increase in number of cases (May 23, 2024)
Weekly increase in number of cases (May 23, 2024)
Cases doubled (in days) (May 23, 2024)
Hospitalized patients (Apr 18, 2022)
Negative test results (Apr 18, 2022)
Total test results (Apr 18, 2022)
COVID Vaccine doses distributed (per 100k population) (Sep 19, 2023)
COVID Vaccine doses administered (per 100k population) (Sep 19, 2023)
COVID Vaccine doses distributed (Sep 19, 2023)
COVID Vaccine doses administered (Sep 19, 2023)
Likely homosexual households (%)
Likely homosexual households (% change since 2000)
Likely homosexual households - Lesbian couples (%)
Likely homosexual households - Lesbian couples (% change since 2000)
Likely homosexual households - Gay men (%)
Likely homosexual households - Gay men (% change since 2000)
Cost of living index
Median gross rent ($)
Median contract rent ($)
Median monthly housing costs ($)
Median house or condo value ($)
Median house or condo value ($ change since 2000)
Mean house or condo value by units in structure - 1, detached ($)
Mean house or condo value by units in structure - 1, attached ($)
Mean house or condo value by units in structure - 2 ($)
Mean house or condo value by units in structure by units in structure - 3 or 4 ($)
Mean house or condo value by units in structure - 5 or more ($)
Mean house or condo value by units in structure - Boat, RV, van, etc. ($)
Mean house or condo value by units in structure - Mobile home ($)
Median house or condo value ($) - White
Median house or condo value ($) - Black or African American
Median house or condo value ($) - Asian
Median house or condo value ($) - Hispanic or Latino
Median house or condo value ($) - American Indian and Alaska Native
Median house or condo value ($) - Multirace
Median house or condo value ($) - Other Race
Median resident age
Resident age diversity
Median resident age - Males
Median resident age - Females
Median resident age - White
Median resident age - Black or African American
Median resident age - Asian
Median resident age - Hispanic or Latino
Median resident age - American Indian and Alaska Native
Median resident age - Multirace
Median resident age - Other Race
Median resident age - Males - White
Median resident age - Males - Black or African American
Median resident age - Males - Asian
Median resident age - Males - Hispanic or Latino
Median resident age - Males - American Indian and Alaska Native
Median resident age - Males - Multirace
Median resident age - Males - Other Race
Median resident age - Females - White
Median resident age - Females - Black or African American
Median resident age - Females - Asian
Median resident age - Females - Hispanic or Latino
Median resident age - Females - American Indian and Alaska Native
Median resident age - Females - Multirace
Median resident age - Females - Other Race
Commute - mean travel time to work (minutes)
Travel time to work - Less than 5 minutes (%)
Travel time to work - Less than 5 minutes (% change since 2000)
Travel time to work - 5 to 9 minutes (%)
Travel time to work - 5 to 9 minutes (% change since 2000)
Travel time to work - 10 to 19 minutes (%)
Travel time to work - 10 to 19 minutes (% change since 2000)
Travel time to work - 20 to 29 minutes (%)
Travel time to work - 20 to 29 minutes (% change since 2000)
Travel time to work - 30 to 39 minutes (%)
Travel time to work - 30 to 39 minutes (% change since 2000)
Travel time to work - 40 to 59 minutes (%)
Travel time to work - 40 to 59 minutes (% change since 2000)
Travel time to work - 60 to 89 minutes (%)
Travel time to work - 60 to 89 minutes (% change since 2000)
Travel time to work - 90 or more minutes (%)
Travel time to work - 90 or more minutes (% change since 2000)
Marital status - Never married (%)
Marital status - Now married (%)
Marital status - Separated (%)
Marital status - Widowed (%)
Marital status - Divorced (%)
Median family income ($)
Median family income (% change since 2000)
Median non-family income ($)
Median non-family income (% change since 2000)
Median per capita income ($)
Median per capita income (% change since 2000)
Median family income ($) - White
Median family income ($) - Black or African American
Median family income ($) - Asian
Median family income ($) - Hispanic or Latino
Median family income ($) - American Indian and Alaska Native
Median family income ($) - Multirace
Median family income ($) - Other Race
Median year house/condo built
Median year apartment built
Year house built - Built 2005 or later (%)
Year house built - Built 2000 to 2004 (%)
Year house built - Built 1990 to 1999 (%)
Year house built - Built 1980 to 1989 (%)
Year house built - Built 1970 to 1979 (%)
Year house built - Built 1960 to 1969 (%)
Year house built - Built 1950 to 1959 (%)
Year house built - Built 1940 to 1949 (%)
Year house built - Built 1939 or earlier (%)
Average household size
Household density (households per square mile)
Average household size - White
Average household size - Black or African American
Average household size - Asian
Average household size - Hispanic or Latino
Average household size - American Indian and Alaska Native
Average household size - Multirace
Average household size - Other Race
Occupied housing units (%)
Vacant housing units (%)
Owner occupied housing units (%)
Renter occupied housing units (%)
Vacancy status - For rent (%)
Vacancy status - For sale only (%)
Vacancy status - Rented or sold, not occupied (%)
Vacancy status - For seasonal, recreational, or occasional use (%)
Vacancy status - For migrant workers (%)
Vacancy status - Other vacant (%)
Residents with income below the poverty level (%)
Residents with income below 50% of the poverty level (%)
Children below poverty level (%)
Poor families by family type - Married-couple family (%)
Poor families by family type - Male, no wife present (%)
Poor families by family type - Female, no husband present (%)
Poverty status for native-born residents (%)
Poverty status for foreign-born residents (%)
Poverty among high school graduates not in families (%)
Poverty among people who did not graduate high school not in families (%)
Residents with income below the poverty level (%) - White
Residents with income below the poverty level (%) - Black or African American
Residents with income below the poverty level (%) - Asian
Residents with income below the poverty level (%) - Hispanic or Latino
Residents with income below the poverty level (%) - American Indian and Alaska Native
Residents with income below the poverty level (%) - Multirace
Residents with income below the poverty level (%) - Other Race
Air pollution - Air Quality Index (AQI)
Air pollution - CO
Air pollution - NO2
Air pollution - SO2
Air pollution - Ozone
Air pollution - PM10
Air pollution - PM25
Air pollution - Pb
Crime - Murders per 100,000 population
Crime - Rapes per 100,000 population
Crime - Robberies per 100,000 population
Crime - Assaults per 100,000 population
Crime - Burglaries per 100,000 population
Crime - Thefts per 100,000 population
Crime - Auto thefts per 100,000 population
Crime - Arson per 100,000 population
Crime - City-data.com crime index
Crime - Violent crime index
Crime - Property crime index
Crime - Murders per 100,000 population (5 year average)
Crime - Rapes per 100,000 population (5 year average)
Crime - Robberies per 100,000 population (5 year average)
Crime - Assaults per 100,000 population (5 year average)
Crime - Burglaries per 100,000 population (5 year average)
Crime - Thefts per 100,000 population (5 year average)
Crime - Auto thefts per 100,000 population (5 year average)
Crime - Arson per 100,000 population (5 year average)
Crime - City-data.com crime index (5 year average)
Crime - Violent crime index (5 year average)
Crime - Property crime index (5 year average)
1996 Presidential Elections Results (%) - Democratic Party (Clinton)
1996 Presidential Elections Results (%) - Republican Party (Dole)
1996 Presidential Elections Results (%) - Other
2000 Presidential Elections Results (%) - Democratic Party (Gore)
2000 Presidential Elections Results (%) - Republican Party (Bush)
2000 Presidential Elections Results (%) - Other
2004 Presidential Elections Results (%) - Democratic Party (Kerry)
2004 Presidential Elections Results (%) - Republican Party (Bush)
2004 Presidential Elections Results (%) - Other
2008 Presidential Elections Results (%) - Democratic Party (Obama)
2008 Presidential Elections Results (%) - Republican Party (McCain)
2008 Presidential Elections Results (%) - Other
2012 Presidential Elections Results (%) - Democratic Party (Obama)
2012 Presidential Elections Results (%) - Republican Party (Romney)
2012 Presidential Elections Results (%) - Other
2016 Presidential Elections Results (%) - Democratic Party (Clinton)
2016 Presidential Elections Results (%) - Republican Party (Trump)
2016 Presidential Elections Results (%) - Other
2020 Presidential Elections Results (%) - Democratic Party (Biden)
2020 Presidential Elections Results (%) - Republican Party (Trump)
2020 Presidential Elections Results (%) - Other
Ancestries Reported - Arab (%)
Ancestries Reported - Czech (%)
Ancestries Reported - Danish (%)
Ancestries Reported - Dutch (%)
Ancestries Reported - English (%)
Ancestries Reported - French (%)
Ancestries Reported - French Canadian (%)
Ancestries Reported - German (%)
Ancestries Reported - Greek (%)
Ancestries Reported - Hungarian (%)
Ancestries Reported - Irish (%)
Ancestries Reported - Italian (%)
Ancestries Reported - Lithuanian (%)
Ancestries Reported - Norwegian (%)
Ancestries Reported - Polish (%)
Ancestries Reported - Portuguese (%)
Ancestries Reported - Russian (%)
Ancestries Reported - Scotch-Irish (%)
Ancestries Reported - Scottish (%)
Ancestries Reported - Slovak (%)
Ancestries Reported - Subsaharan African (%)
Ancestries Reported - Swedish (%)
Ancestries Reported - Swiss (%)
Ancestries Reported - Ukrainian (%)
Ancestries Reported - United States (%)
Ancestries Reported - Welsh (%)
Ancestries Reported - West Indian (%)
Ancestries Reported - Other (%)
Educational Attainment - No schooling completed (%)
Educational Attainment - Less than high school (%)
Educational Attainment - High school or equivalent (%)
Educational Attainment - Less than 1 year of college (%)
Educational Attainment - 1 or more years of college (%)
Educational Attainment - Associate degree (%)
Educational Attainment - Bachelor's degree (%)
Educational Attainment - Master's degree (%)
Educational Attainment - Professional school degree (%)
Educational Attainment - Doctorate degree (%)
School Enrollment - Nursery, preschool (%)
School Enrollment - Kindergarten (%)
School Enrollment - Grade 1 to 4 (%)
School Enrollment - Grade 5 to 8 (%)
School Enrollment - Grade 9 to 12 (%)
School Enrollment - College undergrad (%)
School Enrollment - Graduate or professional (%)
School Enrollment - Not enrolled in school (%)
School enrollment - Public schools (%)
School enrollment - Private schools (%)
School enrollment - Not enrolled (%)
Median number of rooms in houses and condos
Median number of rooms in apartments
Housing units lacking complete plumbing facilities (%)
Housing units lacking complete kitchen facilities (%)
Density of houses
Urban houses (%)
Rural houses (%)
Households with people 60 years and over (%)
Households with people 65 years and over (%)
Households with people 75 years and over (%)
Households with one or more nonrelatives (%)
Households with no nonrelatives (%)
Population in households (%)
Family households (%)
Nonfamily households (%)
Population in families (%)
Family households with own children (%)
Median number of bedrooms in owner occupied houses
Mean number of bedrooms in owner occupied houses
Median number of bedrooms in renter occupied houses
Mean number of bedrooms in renter occupied houses
Median number of vehichles in owner occupied houses
Mean number of vehichles in owner occupied houses
Median number of vehichles in renter occupied houses
Mean number of vehichles in renter occupied houses
Mortgage status - with mortgage (%)
Mortgage status - with second mortgage (%)
Mortgage status - with home equity loan (%)
Mortgage status - with both second mortgage and home equity loan (%)
Mortgage status - without a mortgage (%)
Average family size
Average family size - White
Average family size - Black or African American
Average family size - Asian
Average family size - Hispanic or Latino
Average family size - American Indian and Alaska Native
Average family size - Multirace
Average family size - Other Race
Geographical mobility - Same house 1 year ago (%)
Geographical mobility - Moved within same county (%)
Geographical mobility - Moved from different county within same state (%)
Geographical mobility - Moved from different state (%)
Geographical mobility - Moved from abroad (%)
Place of birth - Born in state of residence (%)
Place of birth - Born in other state (%)
Place of birth - Native, outside of US (%)
Place of birth - Foreign born (%)
Housing units in structures - 1, detached (%)
Housing units in structures - 1, attached (%)
Housing units in structures - 2 (%)
Housing units in structures - 3 or 4 (%)
Housing units in structures - 5 to 9 (%)
Housing units in structures - 10 to 19 (%)
Housing units in structures - 20 to 49 (%)
Housing units in structures - 50 or more (%)
Housing units in structures - Mobile home (%)
Housing units in structures - Boat, RV, van, etc. (%)
House/condo owner moved in on average (years ago)
Renter moved in on average (years ago)
Year householder moved into unit - Moved in 1999 to March 2000 (%)
Year householder moved into unit - Moved in 1995 to 1998 (%)
Year householder moved into unit - Moved in 1990 to 1994 (%)
Year householder moved into unit - Moved in 1980 to 1989 (%)
Year householder moved into unit - Moved in 1970 to 1979 (%)
Year householder moved into unit - Moved in 1969 or earlier (%)
Means of transportation to work - Drove car alone (%)
Means of transportation to work - Carpooled (%)
Means of transportation to work - Public transportation (%)
Means of transportation to work - Bus or trolley bus (%)
Means of transportation to work - Streetcar or trolley car (%)
Means of transportation to work - Subway or elevated (%)
Means of transportation to work - Railroad (%)
Means of transportation to work - Ferryboat (%)
Means of transportation to work - Taxicab (%)
Means of transportation to work - Motorcycle (%)
Means of transportation to work - Bicycle (%)
Means of transportation to work - Walked (%)
Means of transportation to work - Other means (%)
Working at home (%)
Industry diversity
Most Common Industries - Agriculture, forestry, fishing and hunting, and mining (%)
Most Common Industries - Agriculture, forestry, fishing and hunting (%)
Most Common Industries - Mining, quarrying, and oil and gas extraction (%)
Most Common Industries - Construction (%)
Most Common Industries - Manufacturing (%)
Most Common Industries - Wholesale trade (%)
Most Common Industries - Retail trade (%)
Most Common Industries - Transportation and warehousing, and utilities (%)
Most Common Industries - Transportation and warehousing (%)
Most Common Industries - Utilities (%)
Most Common Industries - Information (%)
Most Common Industries - Finance and insurance, and real estate and rental and leasing (%)
Most Common Industries - Finance and insurance (%)
Most Common Industries - Real estate and rental and leasing (%)
Most Common Industries - Professional, scientific, and management, and administrative and waste management services (%)
Most Common Industries - Professional, scientific, and technical services (%)
Most Common Industries - Management of companies and enterprises (%)
Most Common Industries - Administrative and support and waste management services (%)
Most Common Industries - Educational services, and health care and social assistance (%)
Most Common Industries - Educational services (%)
Most Common Industries - Health care and social assistance (%)
Most Common Industries - Arts, entertainment, and recreation, and accommodation and food services (%)
Most Common Industries - Arts, entertainment, and recreation (%)
Most Common Industries - Accommodation and food services (%)
Most Common Industries - Other services, except public administration (%)
Most Common Industries - Public administration (%)
Occupation diversity
Most Common Occupations - Management, business, science, and arts occupations (%)
Most Common Occupations - Management, business, and financial occupations (%)
Most Common Occupations - Management occupations (%)
Most Common Occupations - Business and financial operations occupations (%)
Most Common Occupations - Computer, engineering, and science occupations (%)
Most Common Occupations - Computer and mathematical occupations (%)
Most Common Occupations - Architecture and engineering occupations (%)
Most Common Occupations - Life, physical, and social science occupations (%)
Most Common Occupations - Education, legal, community service, arts, and media occupations (%)
Most Common Occupations - Community and social service occupations (%)
Most Common Occupations - Legal occupations (%)
Most Common Occupations - Education, training, and library occupations (%)
Most Common Occupations - Arts, design, entertainment, sports, and media occupations (%)
Most Common Occupations - Healthcare practitioners and technical occupations (%)
Most Common Occupations - Health diagnosing and treating practitioners and other technical occupations (%)
Most Common Occupations - Health technologists and technicians (%)
Most Common Occupations - Service occupations (%)
Most Common Occupations - Healthcare support occupations (%)
Most Common Occupations - Protective service occupations (%)
Most Common Occupations - Fire fighting and prevention, and other protective service workers including supervisors (%)
Most Common Occupations - Law enforcement workers including supervisors (%)
Most Common Occupations - Food preparation and serving related occupations (%)
Most Common Occupations - Building and grounds cleaning and maintenance occupations (%)
Most Common Occupations - Personal care and service occupations (%)
Most Common Occupations - Sales and office occupations (%)
Most Common Occupations - Sales and related occupations (%)
Most Common Occupations - Office and administrative support occupations (%)
Most Common Occupations - Natural resources, construction, and maintenance occupations (%)
Most Common Occupations - Farming, fishing, and forestry occupations (%)
Most Common Occupations - Construction and extraction occupations (%)
Most Common Occupations - Installation, maintenance, and repair occupations (%)
Most Common Occupations - Production, transportation, and material moving occupations (%)
Most Common Occupations - Production occupations (%)
Most Common Occupations - Transportation occupations (%)
Most Common Occupations - Material moving occupations (%)
People in Group quarters - Institutionalized population (%)
People in Group quarters - Correctional institutions (%)
People in Group quarters - Federal prisons and detention centers (%)
People in Group quarters - Halfway houses (%)
People in Group quarters - Local jails and other confinement facilities (including police lockups) (%)
People in Group quarters - Military disciplinary barracks (%)
People in Group quarters - State prisons (%)
People in Group quarters - Other types of correctional institutions (%)
People in Group quarters - Nursing homes (%)
People in Group quarters - Hospitals/wards, hospices, and schools for the handicapped (%)
People in Group quarters - Hospitals/wards and hospices for chronically ill (%)
People in Group quarters - Hospices or homes for chronically ill (%)
People in Group quarters - Military hospitals or wards for chronically ill (%)
People in Group quarters - Other hospitals or wards for chronically ill (%)
People in Group quarters - Hospitals or wards for drug/alcohol abuse (%)
People in Group quarters - Mental (Psychiatric) hospitals or wards (%)
People in Group quarters - Schools, hospitals, or wards for the mentally retarded (%)
People in Group quarters - Schools, hospitals, or wards for the physically handicapped (%)
People in Group quarters - Institutions for the deaf (%)
People in Group quarters - Institutions for the blind (%)
People in Group quarters - Orthopedic wards and institutions for the physically handicapped (%)
People in Group quarters - Wards in general hospitals for patients who have no usual home elsewhere (%)
People in Group quarters - Wards in military hospitals for patients who have no usual home elsewhere (%)
People in Group quarters - Juvenile institutions (%)
People in Group quarters - Long-term care (%)
People in Group quarters - Homes for abused, dependent, and neglected children (%)
People in Group quarters - Residential treatment centers for emotionally disturbed children (%)
People in Group quarters - Training schools for juvenile delinquents (%)
People in Group quarters - Short-term care, detention or diagnostic centers for delinquent children (%)
People in Group quarters - Type of juvenile institution unknown (%)
People in Group quarters - Noninstitutionalized population (%)
People in Group quarters - College dormitories (includes college quarters off campus) (%)
People in Group quarters - Military quarters (%)
People in Group quarters - On base (%)
People in Group quarters - Barracks, unaccompanied personnel housing (UPH), (Enlisted/Officer), ;and similar group living quarters for military personnel (%)
People in Group quarters - Transient quarters for temporary residents (%)
People in Group quarters - Military ships (%)
People in Group quarters - Group homes (%)
People in Group quarters - Homes or halfway houses for drug/alcohol abuse (%)
People in Group quarters - Homes for the mentally ill (%)
People in Group quarters - Homes for the mentally retarded (%)
People in Group quarters - Homes for the physically handicapped (%)
People in Group quarters - Other group homes (%)
People in Group quarters - Religious group quarters (%)
People in Group quarters - Dormitories (%)
People in Group quarters - Agriculture workers' dormitories on farms (%)
People in Group quarters - Job Corps and vocational training facilities (%)
People in Group quarters - Other workers' dormitories (%)
People in Group quarters - Crews of maritime vessels (%)
People in Group quarters - Other nonhousehold living situations (%)
People in Group quarters - Other noninstitutional group quarters (%)
Residents speaking English at home (%)
Residents speaking English at home - Born in the United States (%)
Residents speaking English at home - Native, born elsewhere (%)
Residents speaking English at home - Foreign born (%)
Residents speaking Spanish at home (%)
Residents speaking Spanish at home - Born in the United States (%)
Residents speaking Spanish at home - Native, born elsewhere (%)
Residents speaking Spanish at home - Foreign born (%)
Residents speaking other language at home (%)
Residents speaking other language at home - Born in the United States (%)
Residents speaking other language at home - Native, born elsewhere (%)
Residents speaking other language at home - Foreign born (%)
Class of Workers - Employee of private company (%)
Class of Workers - Self-employed in own incorporated business (%)
Class of Workers - Private not-for-profit wage and salary workers (%)
Class of Workers - Local government workers (%)
Class of Workers - State government workers (%)
Class of Workers - Federal government workers (%)
Class of Workers - Self-employed workers in own not incorporated business and Unpaid family workers (%)
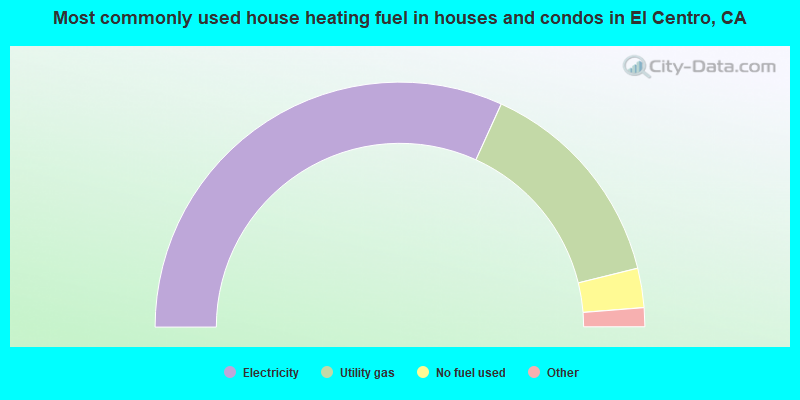
House heating fuel used in houses and condos - Utility gas (%)
House heating fuel used in houses and condos - Bottled, tank, or LP gas (%)
House heating fuel used in houses and condos - Electricity (%)
House heating fuel used in houses and condos - Fuel oil, kerosene, etc. (%)
House heating fuel used in houses and condos - Coal or coke (%)
House heating fuel used in houses and condos - Wood (%)
House heating fuel used in houses and condos - Solar energy (%)
House heating fuel used in houses and condos - Other fuel (%)
House heating fuel used in houses and condos - No fuel used (%)
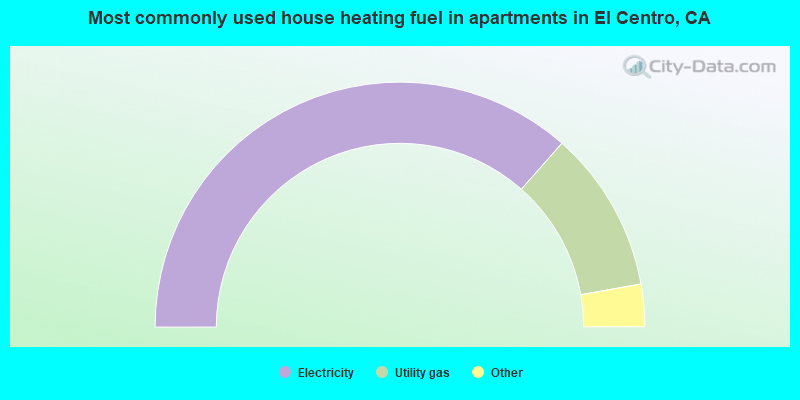
House heating fuel used in apartments - Utility gas (%)
House heating fuel used in apartments - Bottled, tank, or LP gas (%)
House heating fuel used in apartments - Electricity (%)
House heating fuel used in apartments - Fuel oil, kerosene, etc. (%)
House heating fuel used in apartments - Coal or coke (%)
House heating fuel used in apartments - Wood (%)
House heating fuel used in apartments - Solar energy (%)
House heating fuel used in apartments - Other fuel (%)
House heating fuel used in apartments - No fuel used (%)
Armed forces status - In Armed Forces (%)
Armed forces status - Civilian (%)
Armed forces status - Civilian - Veteran (%)
Armed forces status - Civilian - Nonveteran (%)
Fatal accidents locations in years 2005-2021
Fatal accidents locations in 2005
Fatal accidents locations in 2006
Fatal accidents locations in 2007
Fatal accidents locations in 2008
Fatal accidents locations in 2009
Fatal accidents locations in 2010
Fatal accidents locations in 2011
Fatal accidents locations in 2012
Fatal accidents locations in 2013
Fatal accidents locations in 2014
Fatal accidents locations in 2015
Fatal accidents locations in 2016
Fatal accidents locations in 2017
Fatal accidents locations in 2018
Fatal accidents locations in 2019
Fatal accidents locations in 2020
Fatal accidents locations in 2021
Alcohol use - People drinking some alcohol every month (%)
Alcohol use - People not drinking at all (%)
Alcohol use - Average days/month drinking alcohol
Alcohol use - Average drinks/week
Alcohol use - Average days/year people drink much
Audiometry - Average condition of hearing (%)
Audiometry - People that can hear a whisper from across a quiet room (%)
Audiometry - People that can hear normal voice from across a quiet room (%)
Audiometry - Ears ringing, roaring, buzzing (%)
Audiometry - Had a job exposure to loud noise (%)
Audiometry - Had off-work exposure to loud noise (%)
Blood Pressure & Cholesterol - Has high blood pressure (%)
Blood Pressure & Cholesterol - Checking blood pressure at home (%)
Blood Pressure & Cholesterol - Frequently checking blood cholesterol (%)
Blood Pressure & Cholesterol - Has high cholesterol level (%)
Consumer Behavior - Money monthly spent on food at supermarket/grocery store
Consumer Behavior - Money monthly spent on food at other stores
Consumer Behavior - Money monthly spent on eating out
Consumer Behavior - Money monthly spent on carryout/delivered foods
Consumer Behavior - Income spent on food at supermarket/grocery store (%)
Consumer Behavior - Income spent on food at other stores (%)
Consumer Behavior - Income spent on eating out (%)
Consumer Behavior - Income spent on carryout/delivered foods (%)
Current Health Status - General health condition (%)
Current Health Status - Blood donors (%)
Current Health Status - Has blood ever tested for HIV virus (%)
Current Health Status - Left-handed people (%)
Dermatology - People using sunscreen (%)
Diabetes - Diabetics (%)
Diabetes - Had a blood test for high blood sugar (%)
Diabetes - People taking insulin (%)
Diet Behavior & Nutrition - Diet health (%)
Diet Behavior & Nutrition - Milk product consumption (# of products/month)
Diet Behavior & Nutrition - Meals not home prepared (#/week)
Diet Behavior & Nutrition - Meals from fast food or pizza place (#/week)
Diet Behavior & Nutrition - Ready-to-eat foods (#/month)
Diet Behavior & Nutrition - Frozen meals/pizza (#/month)
Drug Use - People that ever used marijuana or hashish (%)
Drug Use - Ever used hard drugs (%)
Drug Use - Ever used any form of cocaine (%)
Drug Use - Ever used heroin (%)
Drug Use - Ever used methamphetamine (%)
Health Insurance - People covered by health insurance (%)
Kidney Conditions-Urology - Avg. # of times urinating at night
Medical Conditions - People with asthma (%)
Medical Conditions - People with anemia (%)
Medical Conditions - People with psoriasis (%)
Medical Conditions - People with overweight (%)
Medical Conditions - Elderly people having difficulties in thinking or remembering (%)
Medical Conditions - People who ever received blood transfusion (%)
Medical Conditions - People having trouble seeing even with glass/contacts (%)
Medical Conditions - People with arthritis (%)
Medical Conditions - People with gout (%)
Medical Conditions - People with congestive heart failure (%)
Medical Conditions - People with coronary heart disease (%)
Medical Conditions - People with angina pectoris (%)
Medical Conditions - People who ever had heart attack (%)
Medical Conditions - People who ever had stroke (%)
Medical Conditions - People with emphysema (%)
Medical Conditions - People with thyroid problem (%)
Medical Conditions - People with chronic bronchitis (%)
Medical Conditions - People with any liver condition (%)
Medical Conditions - People who ever had cancer or malignancy (%)
Mental Health - People who have little interest in doing things (%)
Mental Health - People feeling down, depressed, or hopeless (%)
Mental Health - People who have trouble sleeping or sleeping too much (%)
Mental Health - People feeling tired or having little energy (%)
Mental Health - People with poor appetite or overeating (%)
Mental Health - People feeling bad about themself (%)
Mental Health - People who have trouble concentrating on things (%)
Mental Health - People moving or speaking slowly or too fast (%)
Mental Health - People having thoughts they would be better off dead (%)
Oral Health - Average years since last visit a dentist
Oral Health - People embarrassed because of mouth (%)
Oral Health - People with gum disease (%)
Oral Health - General health of teeth and gums (%)
Oral Health - Average days a week using dental floss/device
Oral Health - Average days a week using mouthwash for dental problem
Oral Health - Average number of teeth
Pesticide Use - Households using pesticides to control insects (%)
Pesticide Use - Households using pesticides to kill weeds (%)
Physical Activity - People doing vigorous-intensity work activities (%)
Physical Activity - People doing moderate-intensity work activities (%)
Physical Activity - People walking or bicycling (%)
Physical Activity - People doing vigorous-intensity recreational activities (%)
Physical Activity - People doing moderate-intensity recreational activities (%)
Physical Activity - Average hours a day doing sedentary activities
Physical Activity - Average hours a day watching TV or videos
Physical Activity - Average hours a day using computer
Physical Functioning - People having limitations keeping them from working (%)
Physical Functioning - People limited in amount of work they can do (%)
Physical Functioning - People that need special equipment to walk (%)
Physical Functioning - People experiencing confusion/memory problems (%)
Physical Functioning - People requiring special healthcare equipment (%)
Prescription Medications - Average number of prescription medicines taking
Preventive Aspirin Use - Adults 40+ taking low-dose aspirin (%)
Reproductive Health - Vaginal deliveries (%)
Reproductive Health - Cesarean deliveries (%)
Reproductive Health - Deliveries resulted in a live birth (%)
Reproductive Health - Pregnancies resulted in a delivery (%)
Reproductive Health - Women breastfeeding newborns (%)
Reproductive Health - Women that had a hysterectomy (%)
Reproductive Health - Women that had both ovaries removed (%)
Reproductive Health - Women that have ever taken birth control pills (%)
Reproductive Health - Women taking birth control pills (%)
Reproductive Health - Women that have ever used Depo-Provera or injectables (%)
Reproductive Health - Women that have ever used female hormones (%)
Sexual Behavior - People 18+ that ever had sex (vaginal, anal, or oral) (%)
Sexual Behavior - Males 18+ that ever had vaginal sex with a woman (%)
Sexual Behavior - Males 18+ that ever performed oral sex on a woman (%)
Sexual Behavior - Males 18+ that ever had anal sex with a woman (%)
Sexual Behavior - Males 18+ that ever had any sex with a man (%)
Sexual Behavior - Females 18+ that ever had vaginal sex with a man (%)
Sexual Behavior - Females 18+ that ever performed oral sex on a man (%)
Sexual Behavior - Females 18+ that ever had anal sex with a man (%)
Sexual Behavior - Females 18+ that ever had any kind of sex with a woman (%)
Sexual Behavior - Average age people first had sex
Sexual Behavior - Average number of female sex partners in lifetime (males 18+)
Sexual Behavior - Average number of female vaginal sex partners in lifetime (males 18+)
Sexual Behavior - Average age people first performed oral sex on a woman (18+)
Sexual Behavior - Average number of woman performed oral sex on in lifetime (18+)
Sexual Behavior - Average number of male sex partners in lifetime (males 18+)
Sexual Behavior - Average number of male anal sex partners in lifetime (males 18+)
Sexual Behavior - Average age people first performed oral sex on a man (18+)
Sexual Behavior - Average number of male oral sex partners in lifetime (18+)
Sexual Behavior - People using protection when performing oral sex (%)
Sexual Behavior - Average number of times people have vaginal or anal sex a year
Sexual Behavior - People having sex without condom (%)
Sexual Behavior - Average number of male sex partners in lifetime (females 18+)
Sexual Behavior - Average number of male vaginal sex partners in lifetime (females 18+)
Sexual Behavior - Average number of female sex partners in lifetime (females 18+)
Sexual Behavior - Circumcised males 18+ (%)
Sleep Disorders - Average hours sleeping at night
Sleep Disorders - People that has trouble sleeping (%)
Smoking-Cigarette Use - People smoking cigarettes (%)
Taste & Smell - People 40+ having problems with smell (%)
Taste & Smell - People 40+ having problems with taste (%)
Taste & Smell - People 40+ that ever had wisdom teeth removed (%)
Taste & Smell - People 40+ that ever had tonsils teeth removed (%)
Taste & Smell - People 40+ that ever had a loss of consciousness because of a head injury (%)
Taste & Smell - People 40+ that ever had a broken nose or other serious injury to face or skull (%)
Taste & Smell - People 40+ that ever had two or more sinus infections (%)
Weight - Average height (inches)
Weight - Average weight (pounds)
Weight - Average BMI
Weight - People that are obese (%)
Weight - People that ever were obese (%)
Weight - People trying to lose weight (%)
39,083 88.9% Hispanic 2,978 6.8% White alone 1,094 2.5% Black alone 567 1.3% Asian alone 130 0.3% Two or more races 27 0.06% American Indian alone 19 0.04% Native Hawaiian and Other
Officers per 1,000 residents here:
0.98California average:
2.30
Latest news from El Centro, CA collected exclusively by city-data.com from local newspapers, TV, and radio stations
Ancestries: African (1.6%), American (1.1%).
Current Local Time:
Land area: 9.58 square miles.
Population density: 4,574 people per square mile (average).
12,799 residents are foreign born (27.8% Latin America ).
This city:
29.1%California:
26.5%
Median real estate property taxes paid for housing units with mortgages in 2022: $2,847 (0.9%)Median real estate property taxes paid for housing units with no mortgage in 2022: $2,090 (0.9%)
Nearest city with pop. 50,000+: Yuma, AZ
Nearest city with pop. 200,000+: San Diego, CA
Nearest cities:
Latitude: 32.79 N, Longitude: 115.56 W
Daytime population change due to commuting: +3,417 (+7.8%)Workers who live and work in this city: 8,774 (51.4%)
Single-family new house construction building permits:
2022: 3 buildings , average cost: $190,0002021: 18 buildings , average cost: $254,5002020: 28 buildings , average cost: $295,0002019: 14 buildings , average cost: $200,7002018: 16 buildings , average cost: $268,7002017: 6 buildings , average cost: $149,2002016: 6 buildings , average cost: $228,9002015: 12 buildings , average cost: $247,4002014: 43 buildings , average cost: $186,0002013: 5 buildings , average cost: $266,2002012: 2 buildings , average cost: $297,3002011: 2 buildings , average cost: $346,6002009: 2 buildings , average cost: $241,1002008: 56 buildings , average cost: $206,0002007: 64 buildings , average cost: $196,3002006: 89 buildings , average cost: $212,0002005: 479 buildings , average cost: $189,3002004: 558 buildings , average cost: $186,4002003: 209 buildings , average cost: $142,0002002: 64 buildings , average cost: $98,1002001: 58 buildings , average cost: $87,8002000: 46 buildings , average cost: $92,6001999: 33 buildings , average cost: $80,4001998: 39 buildings , average cost: $87,8001997: 39 buildings , average cost: $74,300Unemployment in December 2023: Here:
15.4%California:
5.1%
Population change in the 1990s: +4,351 (+13.0%).
Most common occupations in El Centro, CA (%)
Both Males Females
Agricultural workers, including supervisors (6.7%)
Law enforcement workers, including supervisors (5.1%)
Preschool, kindergarten, elementary, and middle school teachers (4.0%)
Other office and administrative support workers, including supervisors (3.9%)
Building and grounds cleaning and maintenance occupations (3.5%)
Other sales and related occupations, including supervisors (3.4%)
Cashiers (3.3%)
Agricultural workers, including supervisors (8.3%)
Law enforcement workers, including supervisors (8.2%)
Driver/sales workers and truck drivers (4.8%)
Electrical equipment mechanics and other installation, maintenance, and repair workers, including supervisors (4.5%)
Other sales and related occupations, including supervisors (4.0%)
Building and grounds cleaning and maintenance occupations (3.9%)
Material recording, scheduling, dispatching, and distributing workers (3.5%)
Other office and administrative support workers, including supervisors (7.2%)
Preschool, kindergarten, elementary, and middle school teachers (6.4%)
Cashiers (5.1%)
Agricultural workers, including supervisors (4.7%)
Secretaries and administrative assistants (4.6%)
Other teachers, instructors, education, training, and library occupations (4.4%)
Information and record clerks, except customer service representatives (4.0%)
Earthquake activity:
El Centro-area historical earthquake activity is significantly above California state average. It is 5303% greater than the overall U.S. average. On 6/28/1992 at 11:57:34, a magnitude 7.6 (6.2 MB, 7.6 MS, 7.3 MW, Depth: 0.7 mi, Class: Major, Intensity: VIII - XII) earthquake occurred 111.7 miles away from the city center, causing 3 deaths ( 1 shaking deaths, 2 other deaths) and 400 injuries, causing $100,000,000 total damage and $40,000,000 insured lossesOn 5/19/1940 at 04:36:40, a magnitude 7.2 (7.2 UK) earthquake occurred 31.1 miles away from the city center, causing $33,000,000 total damage On 12/31/1934 at 18:45:56, a magnitude 7.1 (7.1 UK) earthquake occurred 13.8 miles away from the city center On 10/15/1979 at 23:16:54, a magnitude 7.0 (5.7 MB, 6.9 MS, 7.0 ML, 6.4 MW) earthquake occurred 5.1 miles away from the city center On 10/16/1999 at 09:46:44, a magnitude 7.4 (6.3 MB, 7.4 MS, 7.2 MW, 7.3 ML) earthquake occurred 129.7 miles away from the city center On 7/21/1952 at 11:52:14, a magnitude 7.7 (7.7 UK) earthquake occurred 249.9 miles away from El Centro center, causing $50,000,000 total damage Magnitude types: body-wave magnitude (MB), local magnitude (ML), surface-wave magnitude (MS), moment magnitude (MW) Natural disasters: The number of natural disasters in Imperial County (10) is smaller than the US average (15).Major Disasters (Presidential) Declared: 8Emergencies Declared: 1Floods: 5, Winter Storms: 3, Earthquakes: 2, Landslides: 2, Freeze: 1, Hurricane: 1, Storm: 1, Tropical Storm: 1, Other: 1 (Note: some incidents may be assigned to more than one category). Hospitals in El Centro: EL CENTRO REGIONAL MEDICAL CENTER (Government - Local, provides emergency services, 1415 ROSS AVENUE) HELPING HANDS-HOSPICE (1310 S IMPERIAL AVE) HOMECHOICE HOSPICE SERVICES (2344 SOUTH 2ND SUITE A) HOSPICE OF IMPERIAL VALLEY (300 S IMPERIAL AVENUE SUITE 15) OLSTEN KIMBERLY QUALITY CARE (1850 W MAIN ST, SUITE C) Nursing Homes in El Centro: VALLEY CONVALESCENT CENTER (1700 S. IMPERIAL AVE) Dialysis Facilities in El Centro: FMC-EL CENTRO DESERT VALLEY DIALYSIS CENTER (110 S. FIFTH STREET) FMC-IMPERIAL COUNTY (200 WAKE AVENUE) FMC-IMPERIAL VALLEY HOME THERAPIES (2205 W. ROSS AVENUE, SUITE 3) Home Health Centers in El Centro: ACCENTCARE HOME HEALTH OF CALIFORNIA INC (2344 SOUTH 2ND, SUITE A) GENTIVA HEALTH SERVICES (1503 NORTH IMPERIAL AVE, SUITE 106) PCP HOME HEALTH SERVICES (1241 STATE STREET)
College/University in El Centro: CET-El Centro Full-time enrollment: 260; Location: 294 S 3rd St; Private, not-for-profit; Website: cetweb.org)
Colleges/universities with over 2000 students nearest to El Centro:
Imperial Valley College (about 5 miles; Imperial, CA ; Full-time enrollment: 5,313)
Arizona Western College (about 63 miles; Yuma, AZ ; FT enrollment: 5,454)
Cuyamaca College (about 81 miles; El Cajon, CA ; FT enrollment: 4,270)
College of the Desert (about 82 miles; Palm Desert, CA ; FT enrollment: 5,686)
Grossmont College (about 85 miles; El Cajon, CA ; FT enrollment: 10,461)
Southwestern College (about 85 miles; Chula Vista, CA ; FT enrollment: 10,761)
San Diego State University (about 89 miles; San Diego, CA ; FT enrollment: 27,516)
Public high schools in El Centro: SOUTHWEST HIGH Students: 1,539, Location: 2001 OCOTILLO DR., Grades: 9-12)CENTRAL UNION HIGH Students: 1,179, Location: 1001 BRIGHTON AVE., Grades: 9-12)IMPERIAL COUNTY JUVENILE HALL/COMMUNITY Students: 188, Location: 1398 SPERBER RD., Grades: KG-12)IMPERIAL COUNTY SPECIAL EDUCATION Students: 166, Location: 1398 SPERBER RD., Grades: KG-12)DESERT OASIS HIGH (CONTINUATION) Students: 36, Location: 1302 S. THIRD ST., Grades: 9-12)IMPERIAL VALLEY ROP Location: 687 STATE ST., Grades: 9-12)PHOENIX RISING HIGH Location: 1302 S. THIRD ST., Grades: 9-10)
VALLEY ACADEMY Location: 253 E. ROSS AVE., Grades: KG-12)
Biggest public elementary/middle schools in El Centro: WILSON JR. HIGH Students: 744, Location: 600 S. WILSON, Grades: 7-8)KENNEDY MIDDLE Students: 608, Location: 900 N. SIXTH ST., Grades: 7-8)MARGARET HEDRICK ELEMENTARY Students: 348, Location: 550 S. WATERMAN AVE., Grades: KG-6)SUNFLOWER ELEMENTARY Students: 348, Location: 2450 MAIN ST., Grades: KG-6)MEADOWS ELEMENTARY Students: 345, Location: 2059 BOWKER RD., Grades: KG-8)HARDING ELEMENTARY Students: 335, Location: 950 S. SEVENTH ST., Grades: KG-6)WASHINGTON ELEMENTARY Students: 319, Location: 223 E. FIRST ST., Grades: KG-6)DESERT GARDEN ELEMENTARY Students: 306, Location: 1900 S. SIXTH ST., Grades: KG-6)DE ANZA MAGNET Students: 253, Location: 1530 S. WATERMAN AVE., Grades: KG-8)MARTIN LUTHER KING JR. ELEMENTARY Students: 220, Location: 1950 VILLA AVE., Grades: KG-6)Private elementary/middle school in El Centro: ST MARY S SCHOOL Students: 232, Location: 700 S WATERMAN AVE, Grades: PK-8)
See full list of schools located in El Centro Libraries in El Centro: EL CENTRO PUBLIC LIBRARY Operating income: $585,456; Location: 539 STATE ST.; 113,492 books ; 793 audio materials ; 2,972 video materials ; 2 local licensed databases ; 47 print serial subscriptions )
IMPERIAL COUNTY LIBRARY Operating income: $286,488; Location: 1331 S. CLARK, BLDG 24; 45,630 books ; 899 audio materials ; 1,994 video materials ; 3 local licensed databases ; 1 state licensed databases ; 53 print serial subscriptions )
User-submitted facts and corrections:
Cher was born in EL Centro May 20, 1946 (birth name: Cheryl Sarkisian LaPiere). Actor Ken Howard (The White Shadow TV series)was also born in El Centro March 28,1944. Actor Donal Logue (The Tao of Steve, The Patriot, Just Like Heaven)lived in El Centro and attended El Centro High School graduating in 1984.
KQVO is owned by San Diego State University and Is broadcasting KPBS-FM
Notable locations in El Centro: (A) , Desert Trails Recreational Vehicle Park (B) , City of El Centro Water Plant (C) , Broken Spoke Country Club (D) , Veterans Memorial Hall (E) , Imperial County Law Library (F) , Imperial County Jail (G) , Imperial County Courthouse (H) , El Centro Fire Department Station 1 Headquarters (I) , El Centro Public Library (J) , El Centro Community Center Branch el Centro Public Library (K) , El Centro Community Center (L) , Schaefer Ambulance Service (M) , El Centro Fire Department Station 2 (N) . Display/hide their locations on the map
Shopping Centers: (1) , El Centro Center Shopping Center (2) . Display/hide their locations on the map
Churches in El Centro include: (A) , Apostolic Church of Jesus (B) , Central Baptist Church (C) , Church of Christ (D) , Church of God in Christ (E) , Church of the Nazarene (F) , Edwards Chapel Christian Methodist Episcopal Church (G) , El Centro Korean Church (H) , Emmanuel Asamblea de Dios Latina (I) . Display/hide their locations on the map
Parks in El Centro include: (1) , Bucklin Park (2) , Fraizer Field (3) , McGee Park (4) , North Park (5) , Swarthout Field (6) , West Main Park (7) , West Park (8) , Desert Gardens Park (9) . Display/hide their locations on the map
Hotels:
Court:
Birthplace of: Cher - Singer, Ken Howard - Actor, Dino Cazares - Heavy metal guitarist, Polish brothers - Film director, Robert Thomas - 2005 NFL player (Green Bay Packers, born : Jul 17, 1980), Robert Thomas (linebacker) - College football player, Dan Hacker - Ice hockey player, Glenn Cadrez - Football player, Paul Serna - Baseball player, Tommy Hinkley - Film actor.
Imperial County has a predicted average indoor radon screening level less than 2 pCi/L (pico curies per liter) - Low Potential Drinking water stations with addresses in El Centro and their reported violations in the past:
GORDON S WELL PARK # 2 (Address: B7939 Main Street Population served: 50, Groundwater):
Past monitoring violations:
3 regular monitoring violations
Drinking water stations with addresses in El Centro that have no violations reported:
OLD EUCALYPTUS SCHOOLHOUSE (Population served: 200, Primary Water Source Type: Surface water)
RED HILL MARINA (Population served: 30, Primary Water Source Type: Surface water)
WIEST LAKE (Population served: 30, Primary Water Source Type: Surface water)
SUNBEAM LAKE RV RESORT (Population served: 30, Primary Water Source Type: Purch surface water)
ONE-ELEVEN TRUCK PLAZA (Population served: 30, Primary Water Source Type: Surface water)
IVC DESERT MUSEUM SOCIETY INC. (Address: B7939 Main Street Population served: 25, Primary Water Source Type: Groundwater)
Average household size: This city:
3.2 peopleCalifornia:
2.9 people
Percentage of family households: This city:
77.9%Whole state:
68.7%
Percentage of households with unmarried partners: This city:
6.6%Whole state:
7.2%
Likely homosexual households (counted as self-reported same-sex unmarried-partner households)
Lesbian couples: 0.2% of all households Gay men: 0.2% of all households
People in group quarters in El Centro in 2010:
418 people in federal detention centers
123 people in other noninstitutional facilities
119 people in workers' group living quarters and job corps centers
98 people in nursing facilities/skilled-nursing facilities
28 people in group homes intended for adults
19 people in residential treatment centers for adults
7 people in emergency and transitional shelters (with sleeping facilities) for people experiencing homelessness
4 people in group homes for juveniles (non-correctional)
People in group quarters in El Centro in 2000:
557 people in federal prisons and detention centers
112 people in nursing homes
85 people in other noninstitutional group quarters
80 people in wards in general hospitals for patients who have no usual home elsewhere
21 people in homes or halfway houses for drug/alcohol abuse
16 people in other nonhousehold living situations
12 people in homes for the mentally retarded
4 people in religious group quarters
Banks with branches in El Centro (2011 data):
Wells Fargo Bank, National Association: El Centro Branch at 1200 West Main Street, branch established on 1980/03/21; Vons-El Centro at 750 North Imperial Avenue, branch established on 1995/08/21. Info updated 2011/04/05: Bank assets: $1,161,490.0 mil, Deposits: $905,653.0 mil, headquarters in Sioux Falls, SD, positive income , 6395 total offices , Holding Company: Wells Fargo & Company
Rabobank, National Association: El Centro (In Store Branch) Branch at 2150 North Waterman Ave., branch established on 2008/06/01; El Centro Main at 1448 Main Street, branch established on 1981/03/19. Info updated 2011/01/27: Bank assets: $11,745.0 mil, Deposits: $8,446.0 mil, headquarters in Roseville, CA, positive income , Agricultural Specialization, 124 total offices , Holding Company: Cooperatieve Centrale Raiffeisen-Boerenleenbank B.A., "rabobank Nederland
Bank of America, National Association: El Centro Branch at 1414 Main Street, branch established on 1925/03/26. Info updated 2009/11/18: Bank assets: $1,451,969.3 mil, Deposits: $1,077,176.8 mil, headquarters in Charlotte, NC, positive income , 5782 total offices , Holding Company: Bank Of America Corporation
Desert Commercial Bank: El Centro Branch at 1599 West Main Street, branch established on 2006/05/18. Info updated 2008/01/18: Bank assets: $140.9 mil, Deposits: $125.7 mil, headquarters in Palm Desert, CA, negative income in the last year , Commercial Lending Specialization, 2 total offices
Community Valley Bank: at 1443 Main Street, branch established on 2007/10/01. Info updated 2012/03/22: Bank assets: $86.6 mil, Deposits: $74.9 mil, local headquarters , positive income , Commercial Lending Specialization, 2 total offices
JPMorgan Chase Bank, National Association: North Cottonwood Drive Branch at 2303 North Cottonwood Drive, branch established on 2002/07/01. Info updated 2011/11/10: Bank assets: $1,811,678.0 mil, Deposits: $1,190,738.0 mil, headquarters in Columbus, OH, positive income , International Specialization, 5577 total offices , Holding Company: Jpmorgan Chase & Co.
Union Bank, National Association: El Centro Branch at 576 W Main Street, branch established on 1912/05/17. Info updated 2011/09/01: Bank assets: $88,967.5 mil, Deposits: $65,286.4 mil, headquarters in San Francisco, CA, positive income , Commercial Lending Specialization, 403 total offices , Holding Company: Mitsubishi Ufj Financial Group, Inc.
For population 15 years and over in El Centro:
Never married: 33.8%Now married: 48.3%Separated: 2.7%Widowed: 5.7%Divorced: 9.6% For population 25 years and over in El Centro:
High school or higher: 72.3%Bachelor's degree or higher: 16.2%Graduate or professional degree: 5.6%Unemployed: 11.8%Mean travel time to work (commute): 21.7 minutes
Education Gini index (Inequality in education) Here:
16.5California average:
15.5
Religion statistics for El Centro, CA (based on Imperial County data)
Religion Adherents Congregations Catholic 49,226 12 Evangelical Protestant 12,707 80 Other 3,633 14 Mainline Protestant 1,137 12 Black Protestant 669 5 None 107,156 -
Source: Clifford Grammich, Kirk Hadaway, Richard Houseal, Dale E.Jones, Alexei Krindatch, Richie Stanley and Richard H.Taylor. 2012. 2010 U.S.Religion Census: Religious Congregations & Membership Study. Association of Statisticians of American Religious Bodies. Jones, Dale E., et al. 2002. Congregations and Membership in the United States 2000. Nashville, TN: Glenmary Research Center. Graphs represent county-level data
Food Environment Statistics: Number of grocery stores : 40Imperial County :
2.49 / 10,000 pop.State :
2.14 / 10,000 pop.
Number of supercenters and club stores : 1Imperial County :
0.06 / 10,000 pop.California :
0.04 / 10,000 pop.
Number of convenience stores (no gas) : 10Here :
0.62 / 10,000 pop.State :
0.62 / 10,000 pop.
Number of convenience stores (with gas) : 52Imperial County :
3.23 / 10,000 pop.California :
1.49 / 10,000 pop.
Number of full-service restaurants : 78Imperial County :
4.85 / 10,000 pop.California :
7.42 / 10,000 pop.
Adult diabetes rate : Imperial County :
6.9%California :
7.3%
Adult obesity rate : This county :
25.4%California :
21.3%
Low-income preschool obesity rate : Imperial County :
16.6%California :
17.9%
Health and Nutrition: Healthy diet rate : El Centro:
47.6%California:
49.4%
Average overall health of teeth and gums : This city:
47.2%State:
48.0%
Average BMI : This city:
28.3California:
28.1
People feeling badly about themselves : People not drinking alcohol at all : El Centro:
10.2%California:
11.2%
Average hours sleeping at night : Overweight people : El Centro:
32.7%California:
31.5%
General health condition : El Centro:
54.0%State:
56.4%
Average condition of hearing : El Centro:
81.2%California:
80.9%
More about Health and Nutrition of El Centro, CA Residents
Local government employment and payroll (March 2022)
Function
Full-time employees
Monthly full-time payroll
Average yearly full-time wage
Part-time employees
Monthly part-time payroll
Hospitals
908 $4,874,442 $64,420 202 $431,387 Police Protection - Officers
40 $361,670 $108,501 1 $3,952 Firefighters
35 $381,566 $130,823 0 $0 Water Supply
30 $177,823 $71,129 0 $0 Parks and Recreation
19 $91,100 $57,537 41 $54,285 Streets and Highways
18 $97,143 $64,762 2 $4,318 Police - Other
14 $98,485 $84,416 13 $17,422 Financial Administration
14 $73,056 $62,619 1 $2,657 Other and Unallocable
13 $63,692 $58,793 2 $5,735 Other Government Administration
12 $67,080 $67,080 0 $0 Housing and Community Development (Local)
11 $58,630 $63,960 0 $0 Sewerage
7 $41,622 $71,352 0 $0 Local Libraries
4 $18,390 $55,170 4 $7,440 Fire - Other
2 $7,668 $46,008 0 $0
Totals for Government
1,127 $6,412,366 $68,277 266 $527,197
El Centro government finances - Expenditure in 2018 (per resident):
Construction - Hospitals: $15,688,000 ($358.08)
Regular Highways: $4,573,000 ($104.38)Housing and Community Development: $2,668,000 ($60.90)Parks and Recreation: $2,087,000 ($47.64)Police Protection: $911,000 ($20.79)Water Utilities: $776,000 ($17.71)Sewerage: $564,000 ($12.87)Local Fire Protection: $142,000 ($3.24)Current Operations - Hospitals: $150,536,000 ($3436.03)
Police Protection: $9,454,000 ($215.79)Local Fire Protection: $6,563,000 ($149.80)Sewerage: $5,311,000 ($121.23)Water Utilities: $5,055,000 ($115.38)Central Staff Services: $4,008,000 ($91.48)Parks and Recreation: $3,216,000 ($73.41)Protective Inspection and Regulation - Other: $2,006,000 ($45.79)Solid Waste Management: $1,886,000 ($43.05)Regular Highways: $1,719,000 ($39.24)Financial Administration: $607,000 ($13.85)Transit Utilities: $274,000 ($6.25)Housing and Community Development: $250,000 ($5.71)General - Interest on Debt: $10,516,000 ($240.03)
Other Capital Outlay - Health - Other: $6,015,000 ($137.29)
General - Other: $1,674,000 ($38.21)Hospitals: $1,444,000 ($32.96)Regular Highways: $1,343,000 ($30.65)Sewerage: $1,097,000 ($25.04)Transit Utilities: $444,000 ($10.13)Water Utilities: $164,000 ($3.74)Central Staff Services: $122,000 ($2.78)Protective Inspection and Regulation - Other: $42,000 ($0.96)Water Utilities - Interest on Debt: $1,233,000 ($28.14)
El Centro government finances - Revenue in 2018 (per resident):
Charges - Hospital Public: $313,603,000 ($7158.09)
Sewerage: $9,765,000 ($222.89)Other: $3,881,000 ($88.59)Solid Waste Management: $1,863,000 ($42.52)Parks and Recreation: $321,000 ($7.33)Federal Intergovernmental - Other: $1,747,000 ($39.88)
Sewerage: $800,000 ($18.26)Housing and Community Development: $662,000 ($15.11)Local Intergovernmental - Other: $1,182,000 ($26.98)
Miscellaneous - Interest Earnings: $6,610,000 ($150.88)
Special Assessments: $2,002,000 ($45.70)General Revenue - Other: $1,205,000 ($27.50)Fines and Forfeits: $941,000 ($21.48)Royalties: $89,000 ($2.03)Revenue - Water Utilities: $8,969,000 ($204.72)
State Intergovernmental - General Local Government Support: $1,214,000 ($27.71)
Highways: $897,000 ($20.47)Health and Hospitals: $476,000 ($10.86)Other: $100,000 ($2.28)Tax - General Sales and Gross Receipts: $20,770,000 ($474.08)
Property: $7,836,000 ($178.86)Other Selective Sales: $1,862,000 ($42.50)Other License: $424,000 ($9.68)Occupation and Business License - Other: $355,000 ($8.10)Public Utilities Sales: $298,000 ($6.80)Other: $277,000 ($6.32)Documentary and Stock Transfer: $83,000 ($1.89)
El Centro government finances - Debt in 2018 (per resident):
Long Term Debt - Outstanding Unspecified Public Purpose: $398,970,000 ($9106.62)
Issue, Unspecified Public Purpose: $253,608,000 ($5788.68)Beginning Outstanding - Unspecified Public Purpose: $245,297,000 ($5598.98)Retired Unspecified Public Purpose: $99,935,000 ($2281.05)
El Centro government finances - Cash and Securities in 2018 (per resident):
Bond Funds - Cash and Securities: $113,921,000 ($2600.28)
Other Funds - Cash and Securities: $50,528,000 ($1153.32)
Sinking Funds - Cash and Securities: $26,617,000 ($607.54)
Businesses in El Centro, CA
Name Count Name Count
7-Eleven 4 Hot Topic 1 99 Cents Only Stores 1 JCPenney 1 AT&T 2 Jones New York 4 Aeropostale 1 Journeys 1 American Eagle Outfitters 1 Justice 1 Applebee's 1 KFC 1 AutoZone 2 Kmart 1 Bakers 1 Kroger 1 Bath & Body Works 1 Lane Furniture 1 Bed Bath & Beyond 1 Little Caesars Pizza 1 Best Western 1 Lowe's 1 Brunswick Bowling & Billiards 1 Macy's 1 Burger King 2 Marriott 2 Burlington Coat Factory 1 McDonald's 3 Carl\s Jr. 2 Motherhood Maternity 2 Charlotte Russe 1 New York & Co 1 Chevrolet 1 Nike 2 Chuck E. Cheese's 1 Old Navy 1 Church's Chicken 1 Pac Sun 1 Circle K 1 Payless 3 Cold Stone Creamery 1 Penske 1 Comfort Inn 1 RadioShack 1 Costco 1 Rite Aid 1 Dairy Queen 1 SONIC Drive-In 1 Dennys 2 Sears 2 Discount Tire 2 Skechers USA 1 Domino's Pizza 1 Spencer Gifts 1 El Pollo Loco 1 Sprint Nextel 4 Express 1 Staples 2 FedEx 5 Starbucks 3 Finish Line 1 T-Mobile 4 Foot Locker 1 Taco Bell 2 GNC 2 Target 1 GameStop 2 U-Haul 1 Gap 1 UPS 10 Gymboree 1 Vans 6 H&R Block 2 Verizon Wireless 1 Holiday Inn 1 Vons 1 Hollister Co. 1 Walmart 1 Home Depot 1 Wendy's 1 Honda 1 Wet Seal 1
Strongest AM radio stations in El Centro:
KXO (1230 AM; 1 kW; EL CENTRO, CA; Owner: KXO, INC.)
KWST (1430 AM; 1 kW; EL CENTRO, CA; Owner: ENTRAVISION HOLDINGS, LLC)
KICO (1490 AM; 1 kW; CALEXICO, CA; Owner: HANSON BROADCASTING CO. OF CALIFORNIA)
KFMB (760 AM; 50 kW; SAN DIEGO, CA; Owner: MIDWEST TELEVISION, INC.)
KCBQ (1170 AM; 50 kW; SAN DIEGO, CA; Owner: RADIO 1210, INC.)
KROP (1300 AM; 1 kW; BRAWLEY, CA; Owner: COMMONWEALTH LICENSE SUBSIDIARY, LLC)
KLAC (570 AM; 50 kW; LOS ANGELES, CA; Owner: AMFM RADIO LICENSES, L.L.C.)
KPLS (830 AM; 50 kW; ORANGE, CA; Owner: CRN LICENSES, LLC)
KFI (640 AM; 50 kW; LOS ANGELES, CA; Owner: CAPSTAR TX LIMITED PARTNERSHIP)
KSPN (710 AM; 50 kW; LOS ANGELES, CA; Owner: KABC-AM RADIO, INC.)
KTNQ (1020 AM; 50 kW; LOS ANGELES, CA; Owner: KTNQ-AM LICENSE CORP.)
KPRZ (1210 AM; 20 kW; SAN MARCOS, CA; Owner: RADIO 1210, INC.)
KFWB (980 AM; 50 kW; LOS ANGELES, CA; Owner: INFINITY BROADCASTING OPERATIONS, INC.)
Strongest FM radio stations in El Centro:
KXO-FM (107.5 FM; EL CENTRO, CA; Owner: KXO, INC.)
KGBA (100.1 FM; HOLTVILLE, CA; Owner: THE VOICE OF INTERNATONAL CHRISTIAN EVANGELISM, INC.)
KUBO (88.7 FM; CALEXICO, CA; Owner: RADIO BILINGUE, INC.)
KMXX (99.3 FM; IMPERIAL, CA; Owner: ENTRAVISION HOLDINGS, LLC)
KQVO (97.7 FM; CALEXICO, CA; Owner: HANSON BROADCASTING CO. OF CALIFORNIA)
KSEH (94.5 FM; BRAWLEY, CA; Owner: ENTRAVISION HOLDINGS, LLC)
KSIQ (96.1 FM; BRAWLEY, CA; Owner: COMMONWEALTH LICENSE SUBSIDIARY, LLC)
KZAL (105.5 FM; DESERT CENTER, CA; Owner: WORLDWIDE MULTI-MEDIA B/C CO.)
KLVJ (100.1 FM; JULIAN, CA; Owner: EDUCATIONAL MEDIA FOUNDATION)
KSSB (100.9 FM; CALIPATRIA, CA; Owner: PHILLIP J. PLANK)
TV broadcast stations around El Centro:
K56GC (Channel 56; EL CENTRO-HOLTVILLE, CA; Owner: INSPIRATION TELEVISION, INC.)
K36FO (Channel 36; CALEXICO, CA; Owner: BROADCAST GROUP, LTD.)
National Bridge Inventory (NBI) Statistics 36 Number of bridges305ft / 93.3m Total length477,052 Total average daily traffic45,883 Total average daily truck traffic
New bridges - historical statistics
1 1930-1939 3 1940-1949 22 1960-1969 3 1970-1979 5 1990-1999 2 2010-2019
See full National Bridge Inventory statistics for El Centro, CA
Home Mortgage Disclosure Act Aggregated Statistics For Year 2009(Based on 6 full and 4 partial tracts) A) FHA, FSA/RHS & VA B) Conventional C) Refinancings D) Home Improvement Loans F) Non-occupant Loans on G) Loans On Manufactured Number Average Value Number Average Value Number Average Value Number Average Value Number Average Value Number Average Value
LOANS ORIGINATED 156 $127,296 59 $105,272 89 $163,726 12 $68,677 43 $79,357 0 $0 APPLICATIONS APPROVED, NOT ACCEPTED 15 $113,389 5 $93,210 16 $187,868 1 $142,350 5 $75,866 0 $0 APPLICATIONS DENIED 26 $126,852 29 $66,984 102 $143,900 14 $39,692 23 $92,317 17 $57,703 APPLICATIONS WITHDRAWN 47 $136,606 9 $106,200 58 $165,734 8 $112,990 11 $122,722 1 $184,720 FILES CLOSED FOR INCOMPLETENESS 4 $127,908 2 $27,995 15 $166,748 2 $105,265 3 $115,560 2 $40,200
Aggregated Statistics For Year 2008(Based on 6 full and 4 partial tracts) A) FHA, FSA/RHS & VA B) Conventional C) Refinancings D) Home Improvement Loans E) Loans on Dwellings For 5+ Families F) Non-occupant Loans on G) Loans On Manufactured Number Average Value Number Average Value Number Average Value Number Average Value Number Average Value Number Average Value Number Average Value
LOANS ORIGINATED 108 $174,722 78 $149,298 137 $142,131 26 $62,051 1 $125,000 45 $134,819 9 $75,731 APPLICATIONS APPROVED, NOT ACCEPTED 13 $180,975 22 $125,012 48 $157,679 7 $121,290 0 $0 10 $122,626 7 $56,256 APPLICATIONS DENIED 27 $186,575 35 $154,501 374 $179,837 74 $88,437 3 $305,333 46 $126,050 16 $93,909 APPLICATIONS WITHDRAWN 31 $162,726 28 $137,715 86 $172,091 21 $124,201 0 $0 13 $130,792 4 $59,092 FILES CLOSED FOR INCOMPLETENESS 3 $154,013 3 $305,350 28 $155,239 5 $140,912 0 $0 3 $235,600 1 $65,790
Aggregated Statistics For Year 2007(Based on 6 full and 4 partial tracts) A) FHA, FSA/RHS & VA B) Conventional C) Refinancings D) Home Improvement Loans E) Loans on Dwellings For 5+ Families F) Non-occupant Loans on G) Loans On Manufactured Number Average Value Number Average Value Number Average Value Number Average Value Number Average Value Number Average Value Number Average Value
LOANS ORIGINATED 4 $198,262 149 $163,130 509 $172,824 89 $96,341 7 $520,286 95 $151,935 7 $62,774 APPLICATIONS APPROVED, NOT ACCEPTED 2 $165,000 55 $161,620 162 $187,628 35 $89,974 0 $0 28 $192,769 9 $50,500 APPLICATIONS DENIED 4 $148,500 107 $173,889 691 $198,800 142 $119,481 2 $447,500 80 $188,133 19 $87,881 APPLICATIONS WITHDRAWN 3 $232,793 46 $176,062 298 $185,930 48 $145,327 3 $576,000 33 $164,860 2 $145,245 FILES CLOSED FOR INCOMPLETENESS 0 $0 23 $165,797 85 $208,044 3 $138,120 0 $0 7 $128,119 0 $0
Aggregated Statistics For Year 2006(Based on 6 full and 4 partial tracts) A) FHA, FSA/RHS & VA B) Conventional C) Refinancings D) Home Improvement Loans E) Loans on Dwellings For 5+ Families F) Non-occupant Loans on G) Loans On Manufactured Number Average Value Number Average Value Number Average Value Number Average Value Number Average Value Number Average Value Number Average Value
LOANS ORIGINATED 8 $249,011 584 $158,266 946 $176,390 162 $111,237 4 $797,800 180 $168,445 11 $110,956 APPLICATIONS APPROVED, NOT ACCEPTED 0 $0 162 $143,317 196 $184,693 26 $115,780 0 $0 48 $153,030 14 $66,336 APPLICATIONS DENIED 2 $365,190 260 $156,164 653 $188,084 148 $95,144 1 $600,000 91 $174,373 43 $91,834 APPLICATIONS WITHDRAWN 7 $199,887 151 $185,446 528 $188,613 60 $120,826 0 $0 43 $186,782 8 $89,434 FILES CLOSED FOR INCOMPLETENESS 1 $112,000 28 $173,495 107 $202,129 6 $87,592 0 $0 11 $172,888 1 $132,940
Aggregated Statistics For Year 2005(Based on 6 full and 4 partial tracts) A) FHA, FSA/RHS & VA B) Conventional C) Refinancings D) Home Improvement Loans E) Loans on Dwellings For 5+ Families F) Non-occupant Loans on G) Loans On Manufactured Number Average Value Number Average Value Number Average Value Number Average Value Number Average Value Number Average Value Number Average Value
LOANS ORIGINATED 14 $167,194 965 $158,491 1,044 $164,882 226 $112,167 5 $448,998 243 $148,461 16 $71,860 APPLICATIONS APPROVED, NOT ACCEPTED 2 $145,500 189 $139,545 205 $162,546 30 $61,344 0 $0 53 $152,360 18 $56,268 APPLICATIONS DENIED 0 $0 290 $146,328 559 $159,136 117 $91,933 0 $0 82 $142,984 41 $80,166 APPLICATIONS WITHDRAWN 1 $177,000 230 $171,218 448 $390,214 77 $140,337 0 $0 57 $1,906,151 12 $126,476 FILES CLOSED FOR INCOMPLETENESS 0 $0 46 $152,962 216 $159,653 11 $137,918 0 $0 13 $154,385 3 $105,833
Aggregated Statistics For Year 2004(Based on 6 full and 4 partial tracts) A) FHA, FSA/RHS & VA B) Conventional C) Refinancings D) Home Improvement Loans E) Loans on Dwellings For 5+ Families F) Non-occupant Loans on G) Loans On Manufactured Number Average Value Number Average Value Number Average Value Number Average Value Number Average Value Number Average Value Number Average Value
LOANS ORIGINATED 36 $144,149 445 $130,187 859 $124,302 138 $77,198 9 $813,399 144 $118,101 13 $90,726 APPLICATIONS APPROVED, NOT ACCEPTED 3 $136,333 95 $124,379 218 $130,497 16 $79,694 2 $192,000 23 $142,169 17 $54,305 APPLICATIONS DENIED 9 $112,933 158 $100,675 563 $118,655 114 $56,097 3 $281,667 74 $111,926 50 $55,622 APPLICATIONS WITHDRAWN 4 $138,445 106 $124,357 478 $124,896 30 $72,707 0 $0 39 $106,764 3 $71,933 FILES CLOSED FOR INCOMPLETENESS 4 $106,500 8 $186,928 164 $126,900 9 $73,704 0 $0 6 $103,667 3 $88,763
Detailed mortgage data for all 9 tracts in El Centro, CA
Private Mortgage Insurance Companies Aggregated Statistics For Year 2009(Based on 1 full and 4 partial tracts) A) Conventional B) Refinancings Number Average Value Number Average Value
LOANS ORIGINATED 4 $164,978 1 $252,980 APPLICATIONS APPROVED, NOT ACCEPTED 0 $0 3 $201,333 APPLICATIONS DENIED 1 $138,540 0 $0 APPLICATIONS WITHDRAWN 0 $0 0 $0 FILES CLOSED FOR INCOMPLETENESS 1 $111,000 0 $0
Aggregated Statistics For Year 2008(Based on 6 full and 4 partial tracts) A) Conventional B) Refinancings C) Non-occupant Loans on D) Loans On Manufactured Number Average Value Number Average Value Number Average Value Number Average Value
LOANS ORIGINATED 25 $195,879 15 $205,122 3 $116,703 1 $217,220 APPLICATIONS APPROVED, NOT ACCEPTED 12 $250,460 31 $230,911 4 $193,145 1 $217,220 APPLICATIONS DENIED 2 $140,840 0 $0 1 $226,910 0 $0 APPLICATIONS WITHDRAWN 0 $0 1 $221,740 0 $0 0 $0 FILES CLOSED FOR INCOMPLETENESS 1 $216,050 2 $228,000 1 $235,000 0 $0
Aggregated Statistics For Year 2007(Based on 6 full and 4 partial tracts) A) Conventional B) Refinancings C) Non-occupant Loans on D) Loans On Manufactured Number Average Value Number Average Value Number Average Value Number Average Value
LOANS ORIGINATED 31 $215,885 43 $246,852 7 $178,814 1 $219,150 APPLICATIONS APPROVED, NOT ACCEPTED 8 $239,148 20 $241,318 0 $0 1 $219,150 APPLICATIONS DENIED 0 $0 6 $204,248 0 $0 0 $0 APPLICATIONS WITHDRAWN 2 $178,000 7 $241,280 0 $0 0 $0 FILES CLOSED FOR INCOMPLETENESS 0 $0 0 $0 0 $0 0 $0
Aggregated Statistics For Year 2006(Based on 6 full and 4 partial tracts) A) Conventional B) Refinancings C) Non-occupant Loans on Number Average Value Number Average Value Number Average Value
LOANS ORIGINATED 10 $206,102 18 $235,672 1 $206,980 APPLICATIONS APPROVED, NOT ACCEPTED 3 $178,997 8 $219,188 0 $0 APPLICATIONS DENIED 0 $0 2 $274,500 1 $285,000 APPLICATIONS WITHDRAWN 0 $0 4 $245,098 0 $0 FILES CLOSED FOR INCOMPLETENESS 0 $0 0 $0 0 $0
Aggregated Statistics For Year 2005(Based on 6 full and 4 partial tracts) A) Conventional B) Refinancings C) Non-occupant Loans on Number Average Value Number Average Value Number Average Value
LOANS ORIGINATED 19 $209,997 30 $207,215 5 $161,684 APPLICATIONS APPROVED, NOT ACCEPTED 10 $187,771 6 $176,083 6 $209,278 APPLICATIONS DENIED 0 $0 0 $0 0 $0 APPLICATIONS WITHDRAWN 2 $296,145 2 $193,875 1 $162,000 FILES CLOSED FOR INCOMPLETENESS 0 $0 0 $0 0 $0
Aggregated Statistics For Year 2004(Based on 6 full and 4 partial tracts) A) Conventional B) Refinancings C) Non-occupant Loans on Number Average Value Number Average Value Number Average Value
LOANS ORIGINATED 63 $170,674 50 $161,175 14 $144,155 APPLICATIONS APPROVED, NOT ACCEPTED 15 $153,561 17 $146,773 4 $112,925 APPLICATIONS DENIED 1 $165,000 2 $121,960 0 $0 APPLICATIONS WITHDRAWN 0 $0 2 $204,320 0 $0 FILES CLOSED FOR INCOMPLETENESS 0 $0 1 $165,000 0 $0
Fire-safe hotels and motels in El Centro, California:
Executive Inn Of El Centro, 725 State St, El Centro, California 92243 Phone: (760) 352-8500
Travelodge El Centro, 2015 Cottonwood Cir, El Centro, California 92243 Phone: (760) 352-9700, Fax: (760) 353-7620
American Best Value Inn & Suites, 455 Wake Ave, El Centro, California 92243 Phone: (760) 352-6620, Fax: (760) 353-9747
Econo Lodge, 330 N Imperial Ave, El Centro, California 92243 Phone: (760) 353-0030, Fax: (760) 352-3223
Motel 6, 395 Smoketree Dr, El Centro, California 92243 Phone: (760) 353-6766, Fax: (760) 337-1123
Clarion Inn, 1455 Ocotillo Ave, El Centro, California 92243 Phone: (760) 352-5152, Fax: (760) 337-1567
Comfort Inn & Suites, 2354 S 4th St, El Centro, California 92243 Phone: (561) 845-8899, Fax: (760) 335-3505
Howard Johnson El Centro, 1575 Ocotillo Dr, El Centro, California 92243 Phone: (760) 336-2927, Fax: (760) 336-2959
6 other hotels and motels
All 14 fire-safe hotels and motels in El Centro, California
Most common first names in El Centro, CA among deceased individuals Name Count Lived (average)
Maria 148 74.2 years John 139 74.0 years James 129 72.5 years Jose 127 70.1 years William 112 72.9 years Robert 107 71.5 years Mary 90 77.2 years Charles 72 75.3 years George 64 75.5 years Frank 60 73.7 years
Most common last names in El Centro, CA among deceased individuals Last name Count Lived (average)
Lopez 76 73.3 years Garcia 75 73.8 years Smith 57 75.2 years Hernandez 46 71.4 years Gonzalez 44 72.1 years Rodriguez 43 72.7 years Martinez 40 72.8 years Johnson 39 72.5 years Jones 37 71.4 years Brown 36 75.6 years
El Centro compared to California state average:
Median household income below state average. Median house value significantly below state average. Black race population percentage below state average. Hispanic race population percentage above state average. Length of stay since moving in above state average. Percentage of population with a bachelor's degree or higher below state average.
#8 on the list of "Top 101 cities with the smallest percentage of high school students in private schools (3,000+ students)"
#14 on the list of "Top 101 cities with the largest racial income disparity between any two races with at least 200 householders"
#17 on the list of "Top 101 cities with the smallest percentage of elementary and middle school students in private schools (5,000+ students)"
#56 on the list of "Top 101 cities with the largest percentage of people in federal prisons and detention centers (population 1,000+)"
#59 (92243) on the list of "Top 101 zip codes with the largest percentage of Swiss first ancestries (pop 5,000+)"
#1 on the list of "Top 101 counties with the highest lead air pollution readings in 2012 (µg/m3 )"
#8 on the list of "Top 101 counties with the highest Particulate Matter (PM10 ) Annual air pollution readings in 2012 (µg/m3 )"
#13 on the list of "Top 101 counties with the highest number of births per 1000 residents 2007-2013"
#27 on the list of "Top 101 counties with the highest Particulate Matter (PM2.5 ) Annual air pollution readings in 2012 (µg/m3 )"
#37 on the list of "Top 101 counties with the largest decrease in the number of deaths per 1000 residents 2000-2006 to 2007-2013 (pop. 50,000+)"
Top Patent Applicants
John L. Featherstone (5)
Christopher Linden (3)
James Eric Taylor (2)
Cesar Flores (2)
Diego Villasenor (1)
Robert Edwin Robb (1)
Dan Kort (1)
Robert Emery (1)
Bobby Locke (1)
Preston Pete Richter (1)
Total of 20 patent applications in 2008-2024.

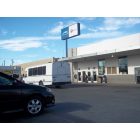

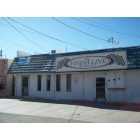

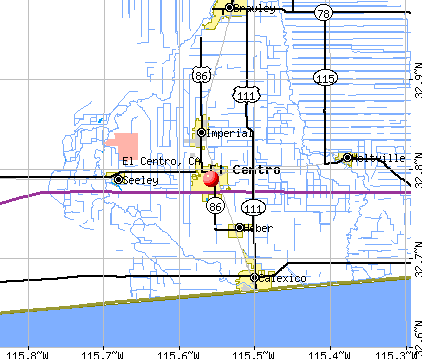


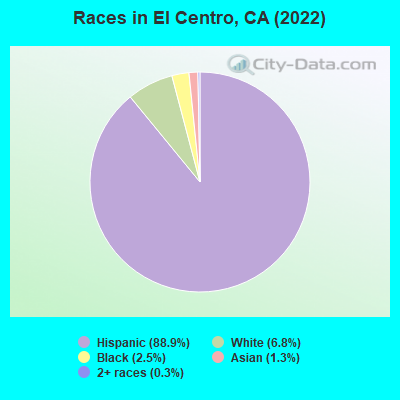
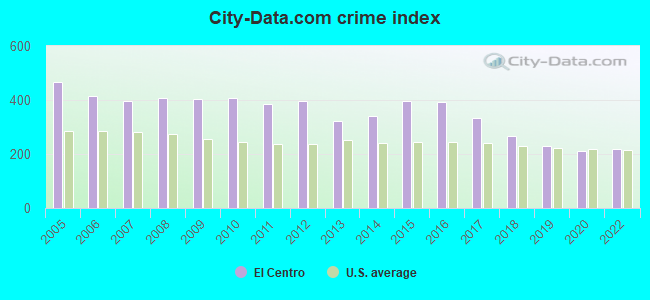
 Recent articles from our blog. Our writers, many of them Ph.D. graduates or candidates, create easy-to-read articles on a wide variety of topics.

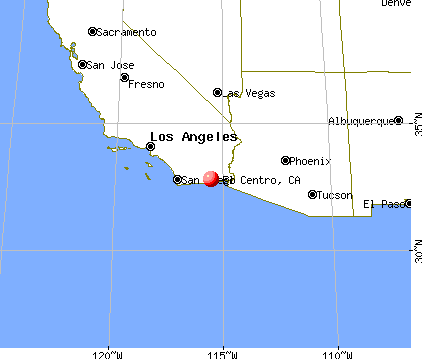
 (55.2 miles
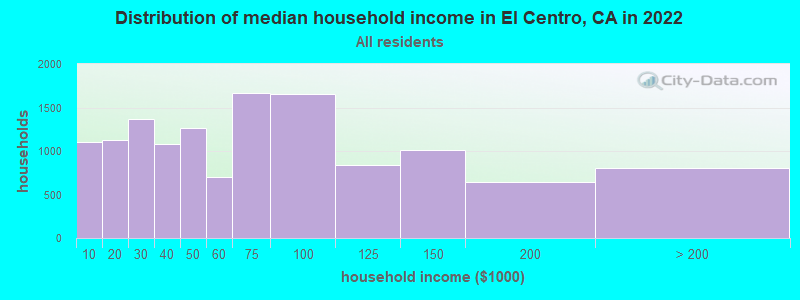
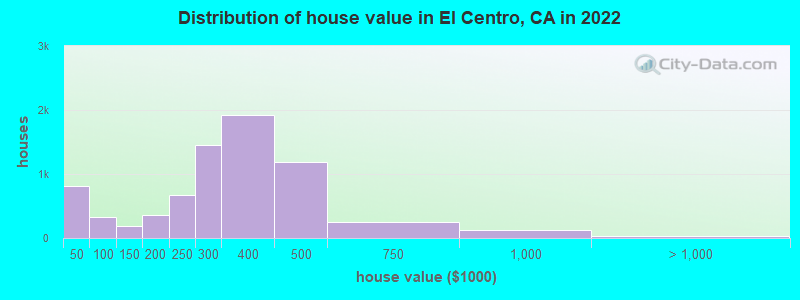

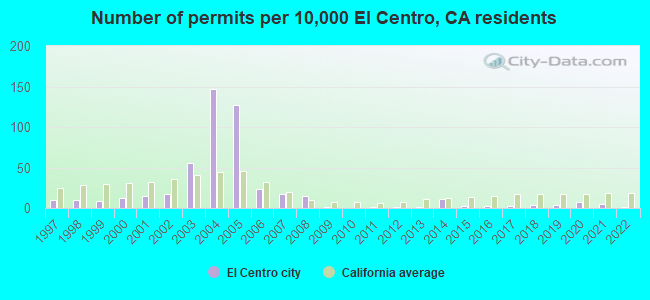
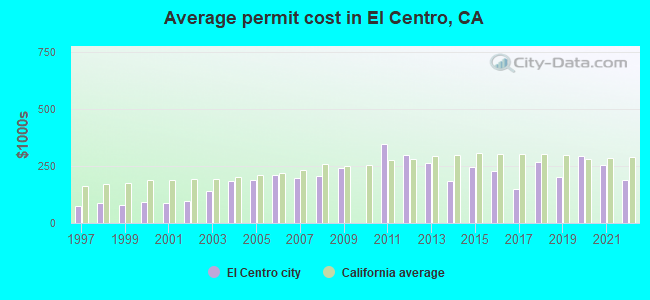
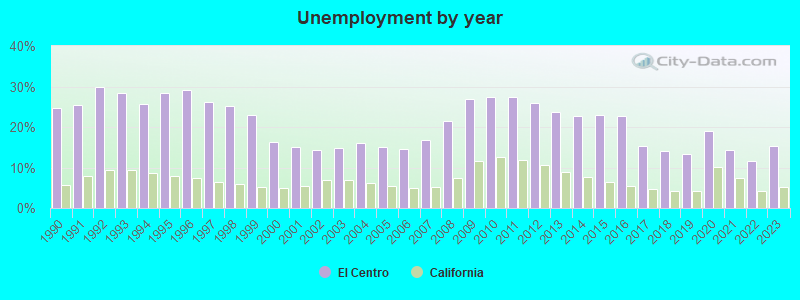
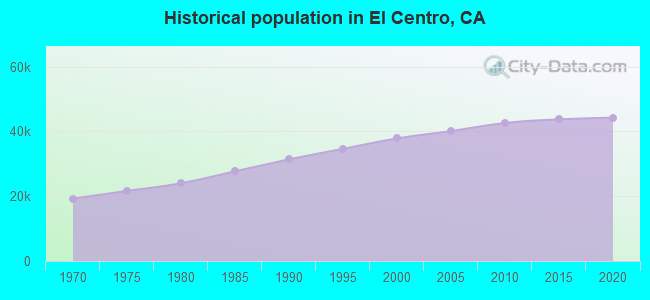
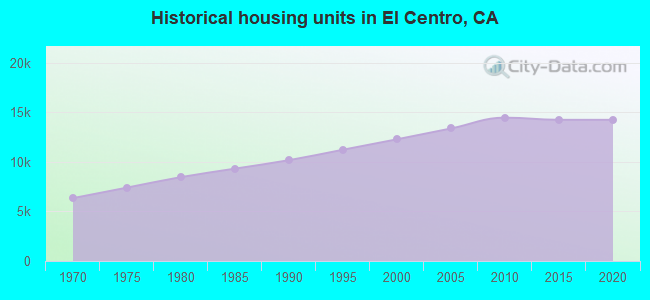
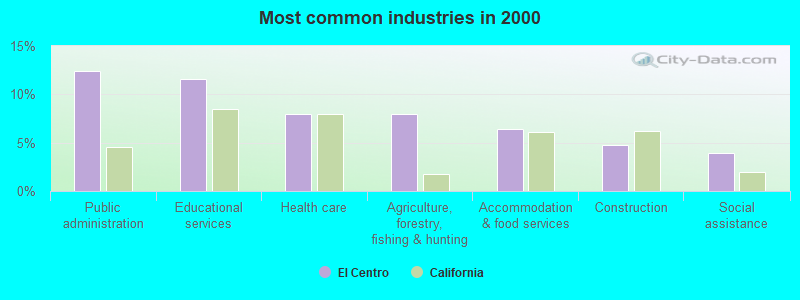
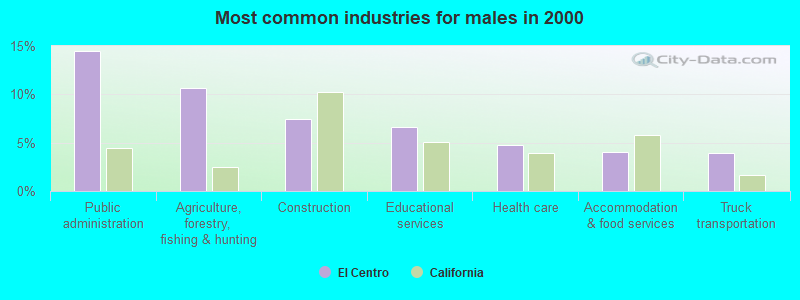

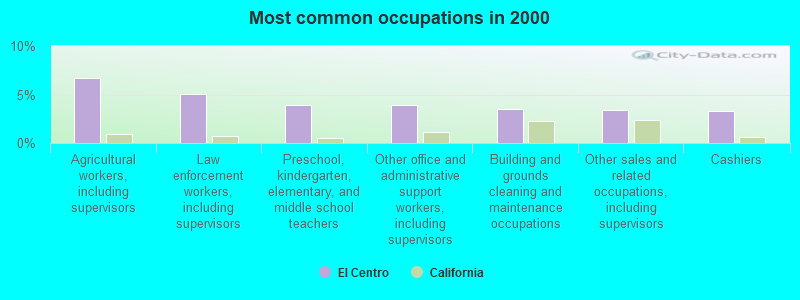
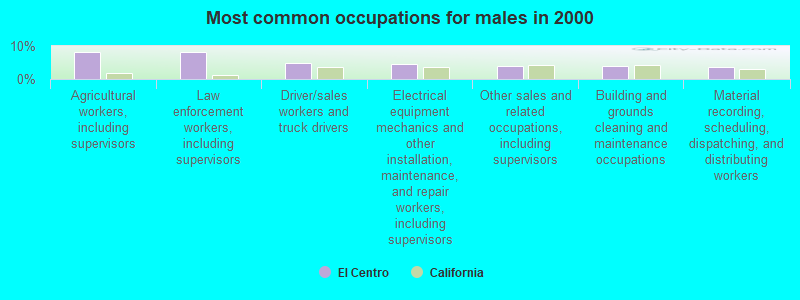
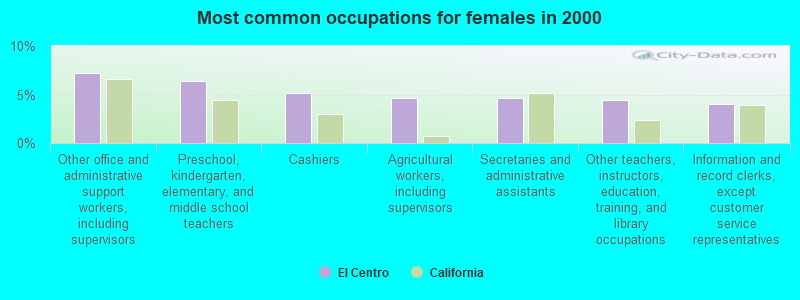


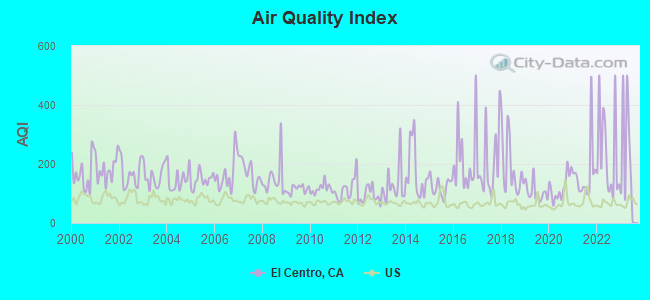
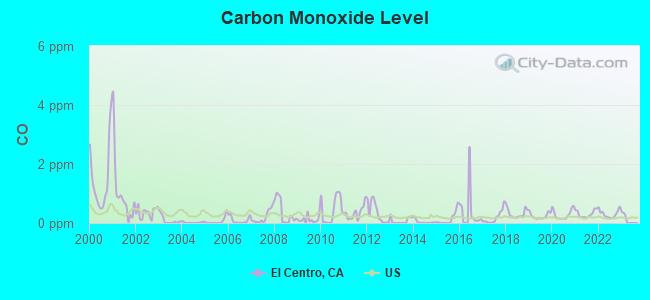
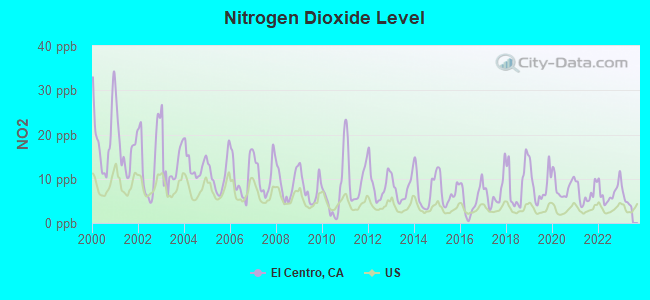
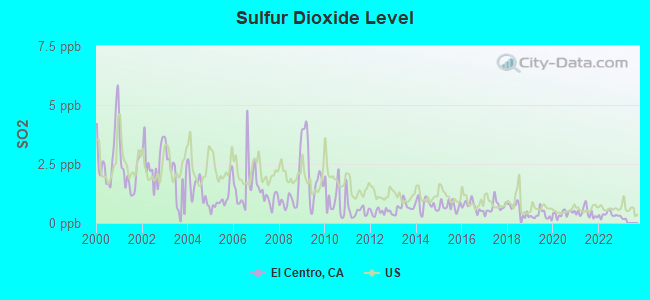

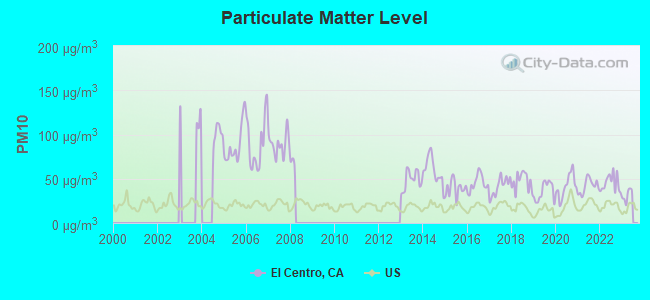
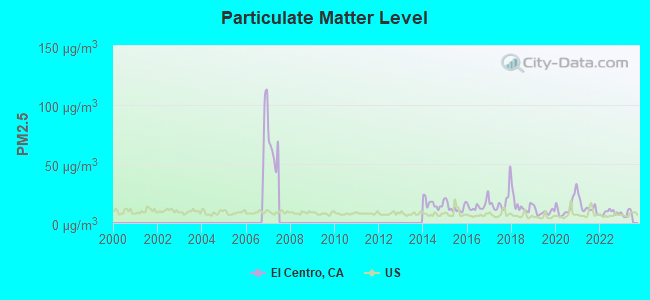
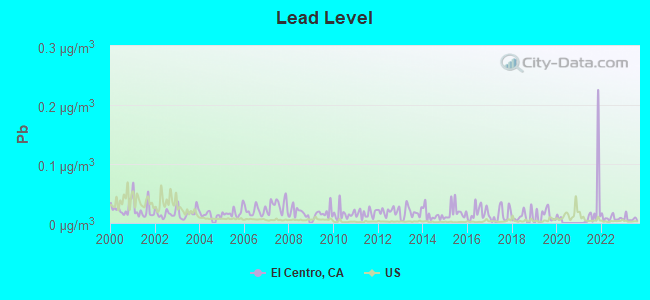

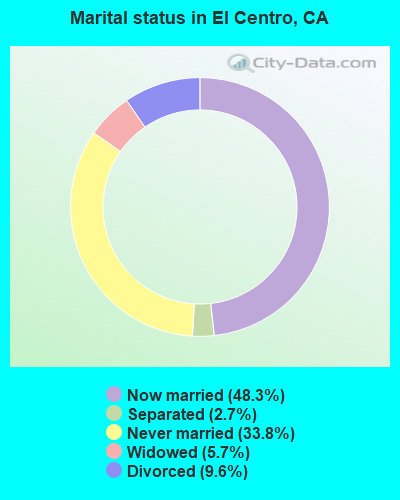
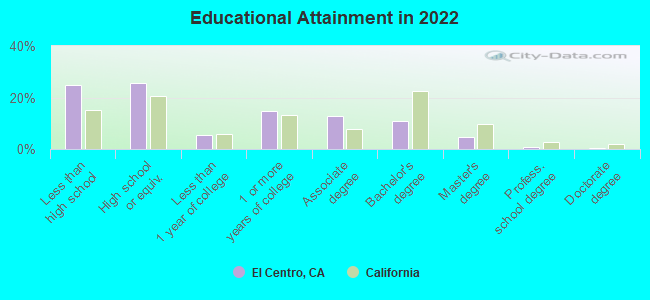
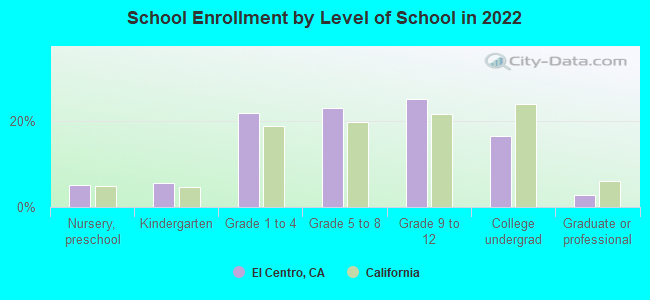
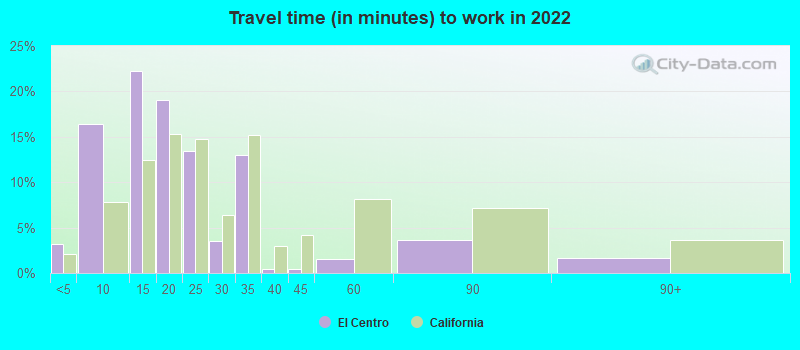
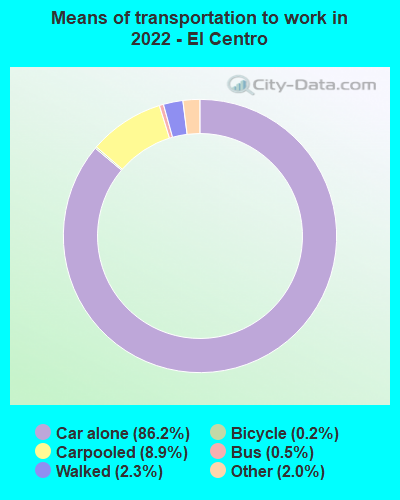
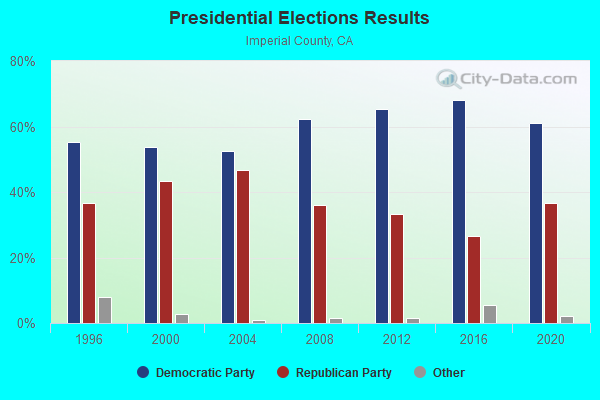
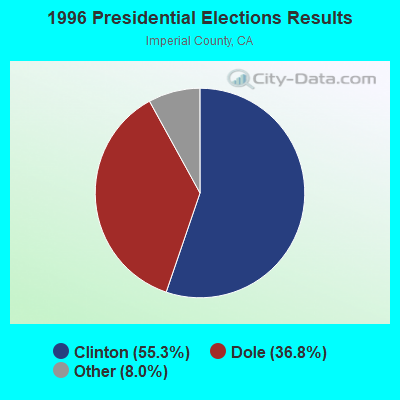
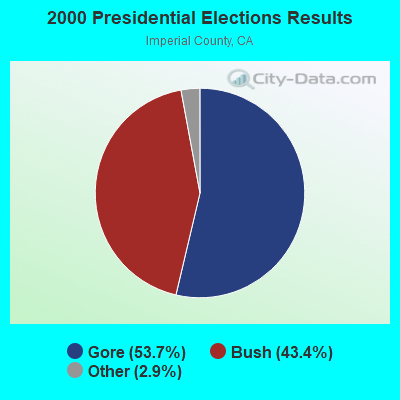
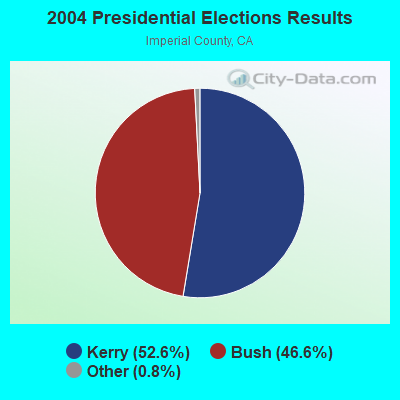
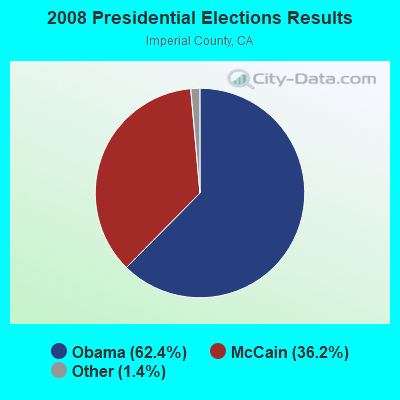
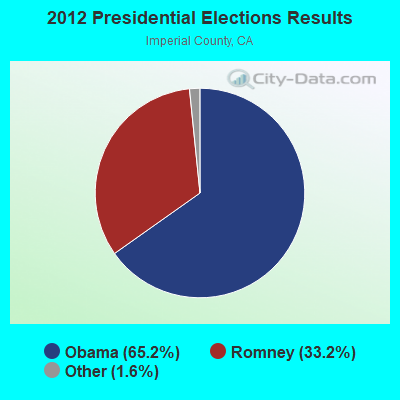
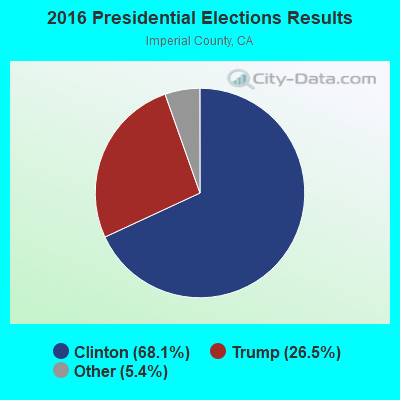
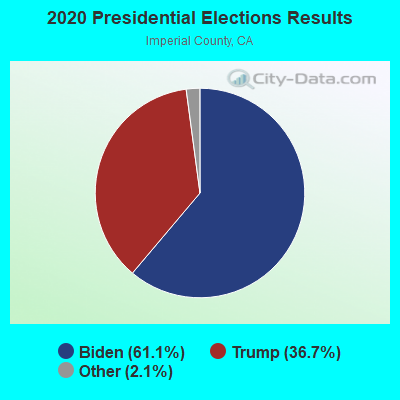
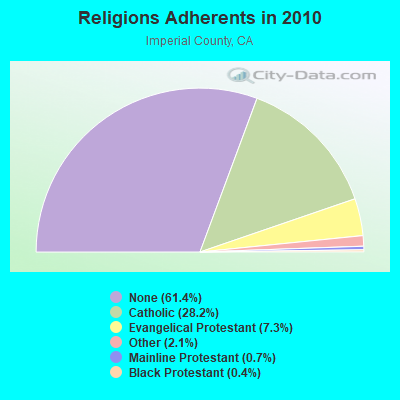
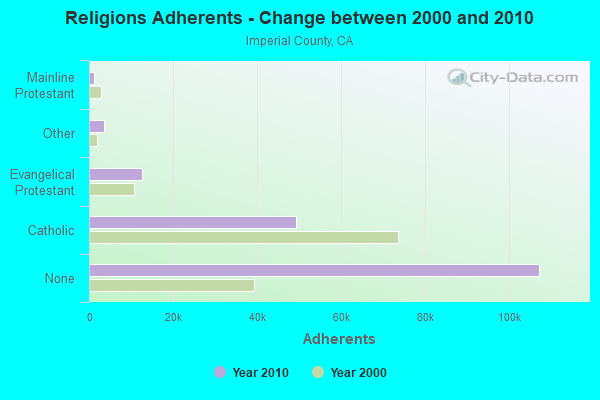
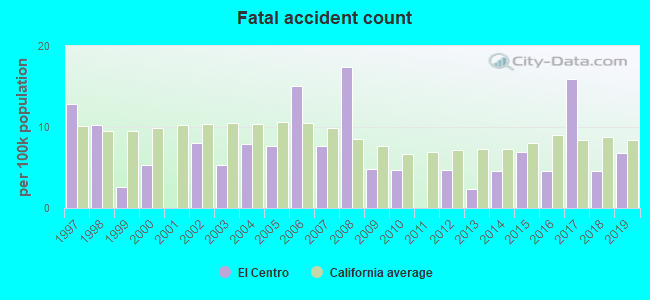
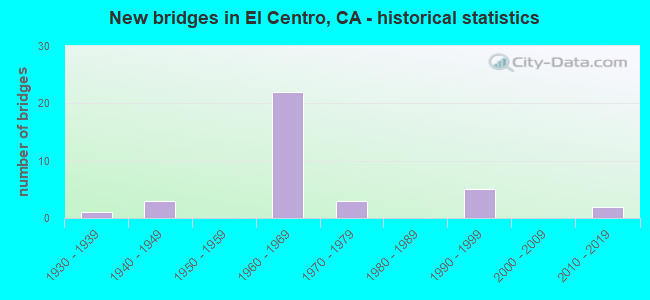
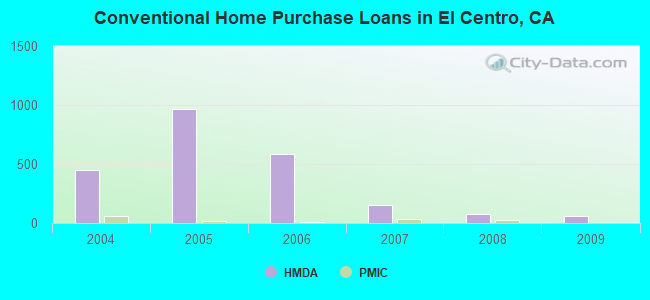
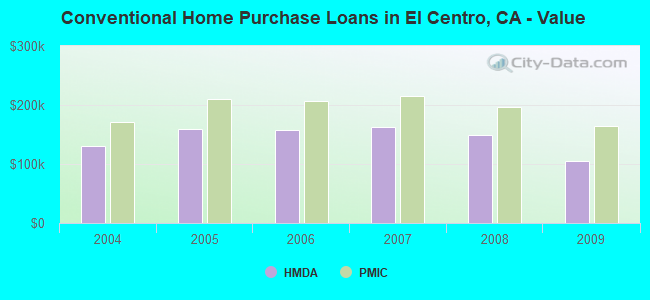
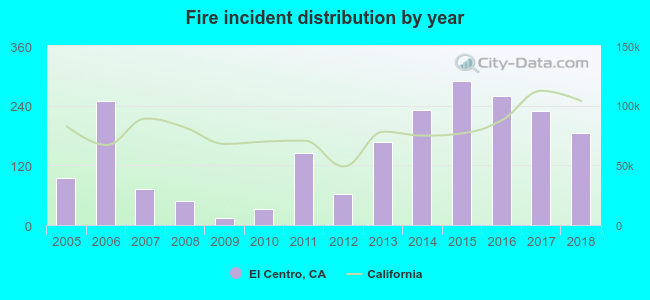 Based on the data from the years 2005 - 2018 the average number of fires per year is 149. The highest number of reported fire incidents - 289 took place in 2015, and the least - 15 in 2009. The data has a growing trend.
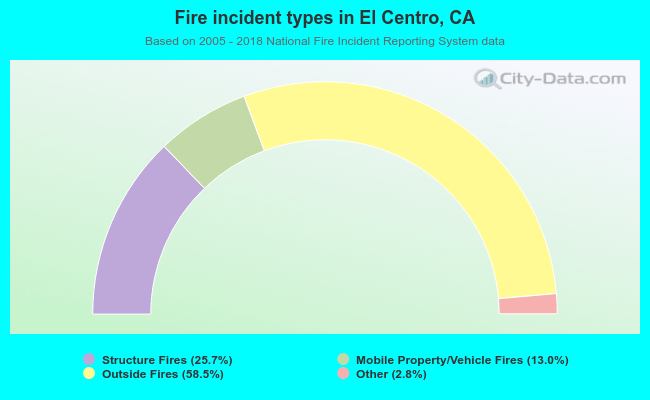 When looking into fire subcategories, the most reports belonged to: Outside Fires (58.5%), and Structure Fires (25.7%).