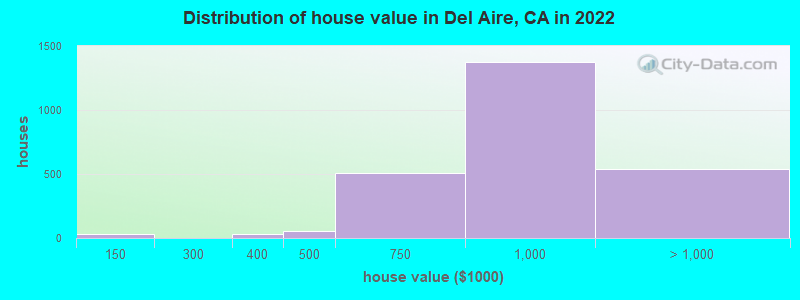
Estimated median house or condo value in 2022: $935,649 (it was $187,500 in 2000)
Del Aire:
$935,649
CA:
$715,900
Mean prices in 2022:all housing units: over $1,000,000; detached houses: over $1,000,000; townhouses or other attached units: $750,854; in 2-unit structures: over $1,000,000; in 3-to-4-unit structures: $791,642; in 5-or-more-unit structures: $738,503; mobile homes: $205,184; occupied boats, rvs, vans, etc.: $276,239
Median gross rent in 2022: $2,856.
March 2022 cost of living index in Del Aire: 141.2 (very high, U.S. average is 100)
Percentage of residents living in poverty in 2022: 7.3%
(6.2% for White Non-Hispanic residents, 9.3% for Hispanic or Latino residents, 17.3% for other race residents, 9.2% for two or more races residents)
Latest news from Del Aire, CA collected exclusively by city-data.com from local newspapers, TV, and radio stations
Ancestries: Egyptian (6.2%), Italian (4.6%), American (2.4%), German (2.2%), European (1.9%), English (1.5%).
Current Local Time: PST time zone
Elevation: 88 feet
Land area: 0.99 square miles.
Population density: 10,111 people per square mile (high).
2,846 residents are foreign born (13.3% Latin America, 10.5% Asia).
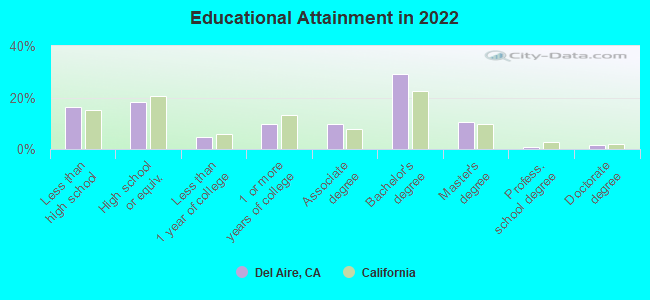
This place:
27.0%
California:
26.5%
Median real estate property taxes paid for housing units with mortgages in 2022: $6,915 (0.7%) Median real estate property taxes paid for housing units with no mortgage in 2022: $4,323 (0.5%)
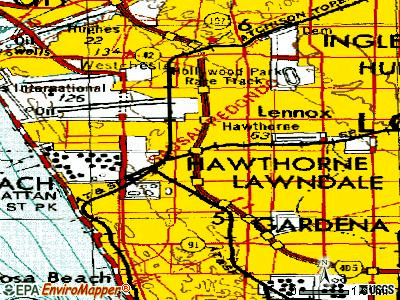
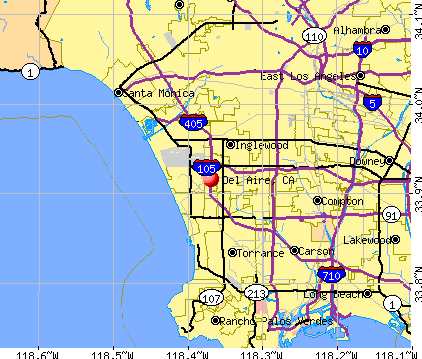
Nearest city with pop. 50,000+: Hawthorne, CA (1.2 miles , pop. 84,112).
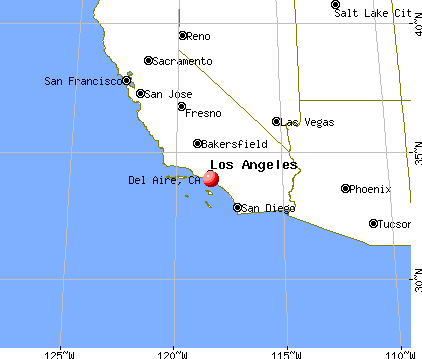
Nearest city with pop. 200,000+: Los Angeles, CA (11.8 miles , pop. 3,694,820).
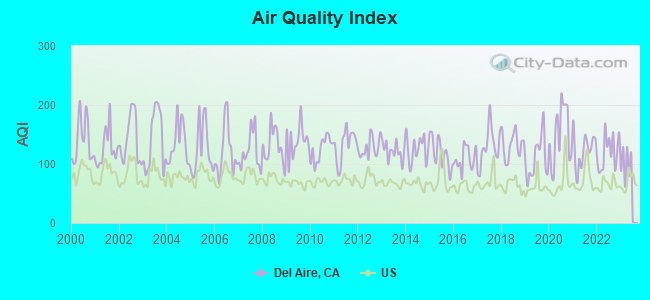
Air Quality Index (AQI) level in 2022 was 120. This is significantly worse than average.
City:
120
U.S.:
73
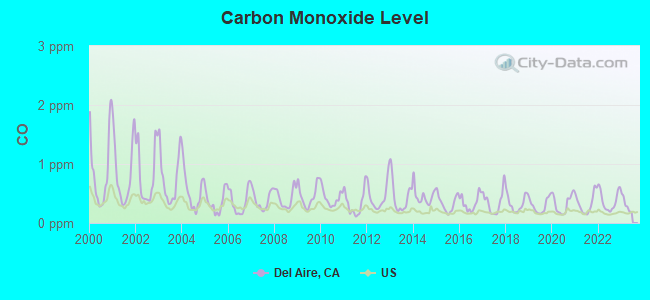
Carbon Monoxide (CO) [ppm] level in 2022 was 0.379. This is significantly worse than average.Closest monitor was 0.5 miles away from the city center.
City:
0.379
U.S.:
0.251
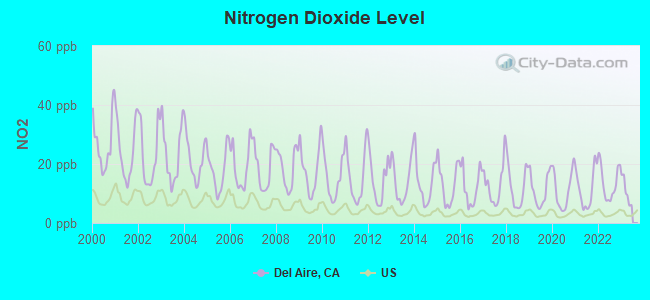
Nitrogen Dioxide (NO2) [ppb] level in 2022 was 13.7. This is significantly worse than average.Closest monitor was 0.5 miles away from the city center.
City:
13.7
U.S.:
5.1
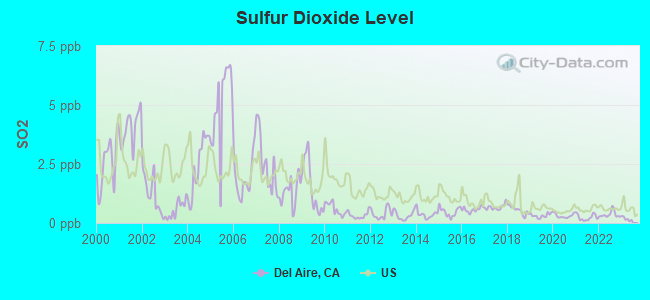
Sulfur Dioxide (SO2) [ppb] level in 2022 was 0.358. This is significantly better than average.Closest monitor was 0.5 miles away from the city center.
City:
0.358
U.S.:
1.515
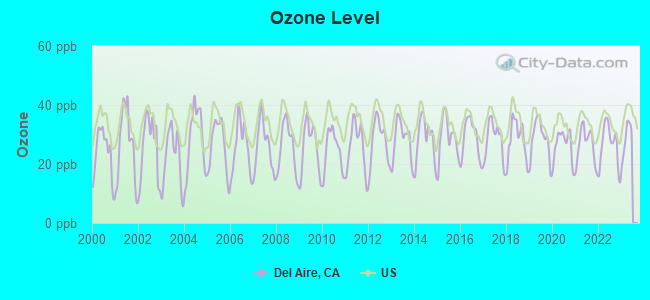
Ozone [ppb] level in 2022 was 26.4. This is better than average.Closest monitor was 0.5 miles away from the city center.
City:
26.4
U.S.:
33.3
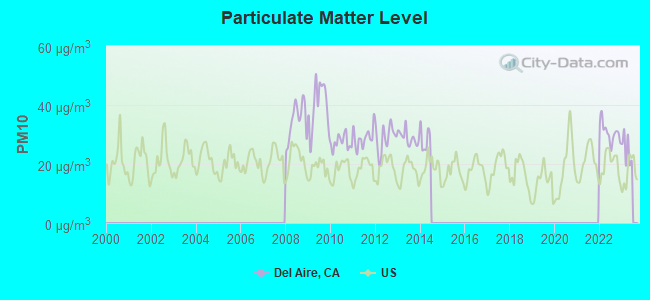
Particulate Matter (PM10) [µg/m3] level in 2022 was 30.6. This is significantly worse than average.Closest monitor was 0.5 miles away from the city center.
City:
30.6
U.S.:
19.2
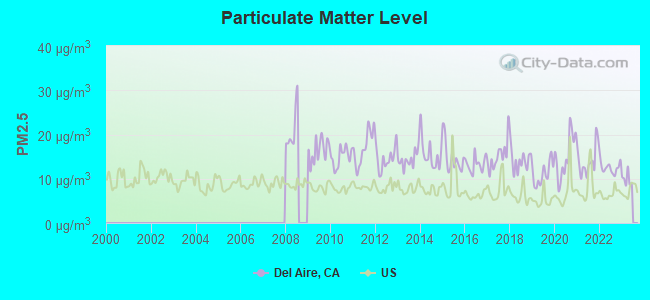
Particulate Matter (PM2.5) [µg/m3] level in 2022 was 12.6. This is significantly worse than average.Closest monitor was 9.1 miles away from the city center.
City:
12.6
U.S.:
8.1
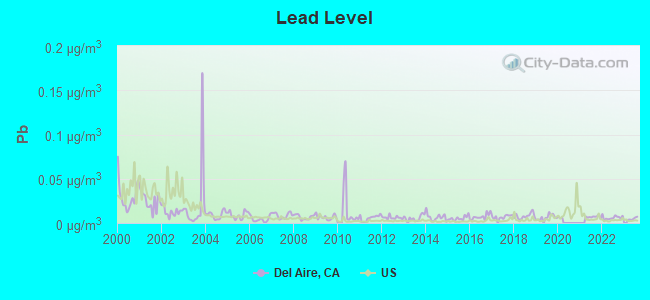
Lead (Pb) [µg/m3] level in 2022 was 0.00604. This is significantly better than average.Closest monitor was 0.5 miles away from the city center.
City:
0.00604
U.S.:
0.00931
Earthquake activity:
Del Aire-area historical earthquake activity is significantly above California state average. It is 6797% greater than the overall U.S. average.
On 7/21/1952 at 11:52:14, a magnitude 7.7 (7.7 UK, Class: Major, Intensity: VIII - XII) earthquake occurred 83.2 miles away from Del Aire center, causing $50,000,000 total damage On 6/28/1992 at 11:57:34, a magnitude 7.6 (6.2 MB, 7.6 MS, 7.3 MW, Depth: 0.7 mi) earthquake occurred 106.9 miles away from Del Aire center, causing 3 deaths (1 shaking deaths, 2 other deaths) and 400 injuries, causing $100,000,000 total damage and $40,000,000 insured losses On 10/16/1999 at 09:46:44, a magnitude 7.4 (6.3 MB, 7.4 MS, 7.2 MW, 7.3 ML) earthquake occurred 118.1 miles away from Del Aire center On 11/4/1927 at 13:51:53, a magnitude 7.5 (7.5 UK) earthquake occurred 166.8 miles away from the city center On 1/17/1994 at 12:30:55, a magnitude 6.8 (6.4 MB, 6.8 MS, 6.7 MW, Depth: 11.4 mi, Class: Strong, Intensity: VII - IX) earthquake occurred 20.4 miles away from the city center, causing 60 deaths (60 shaking deaths) and 7000 injuries On 4/21/1918 at 22:32:30, a magnitude 6.8 (6.8 UK) earthquake occurred 53.9 miles away from Del Aire center Magnitude types: body-wave magnitude (MB), local magnitude (ML), surface-wave magnitude (MS), moment magnitude (MW)
Natural disasters:
The number of natural disasters in Los Angeles County (57) is a lot greater than the US average (15). Major Disasters (Presidential) Declared: 27 Emergencies Declared: 3
Causes of natural disasters: Fires: 37, Floods: 16, Storms: 9, Winter Storms: 6, Landslides: 5, Mudslides: 5, Earthquakes: 3, Freeze: 1, Heavy Rain: 1, Hurricane: 1, Snow: 1, Tornado: 1, Wind: 1, Other: 1 (Note: some incidents may be assigned to more than one category).
Hospitals and medical centers near Del Aire:
IMPERIAL CREST HEALTH CARE (Nursing Home, about 1 miles away; HAWTHORNE, CA)
DAVITA-SUNRISE DIALYSIS CENTER (Dialysis Facility, about 1 miles away; HAWTHORNE, CA)
GIDDA'S HOME HEALTH SERVICES, INC (Home Health Center, about 2 miles away; HAWTHORNE, CA)
ISOCARE MEDICAL EXTENDERS SERVICES INC (Home Health Center, about 2 miles away; HAWTHORNE, CA)
CALIFORNIA HEALTHCARE SERVICES, LLC (Home Health Center, about 2 miles away; HAWTHORNE, CA)
ANCHOR HOME HEALTH (Home Health Center, about 2 miles away; HAWTHORNE, CA)
HAWTHORNE HOSPITAL (Hospital, about 2 miles away; HAWTHORNE, CA)
Amtrak stations near Del Aire:
13 miles: LOS ANGELES (800 N. ALAMEDA ST.) . Services: ticket office, fully wheelchair accessible, enclosed waiting area, public restrooms, public payphones, snack bar, free short-term parking, paid long-term parking, car rental agency, taxi stand, public transit connection.
13 miles: SAN PEDRO (CATALINA TERMINAL, BERTH 95) - Bus Station . Services: partially wheelchair accessible, enclosed waiting area, public restrooms, public payphones, snack bar, paid short-term parking, paid long-term parking, call for taxi service.
15 miles: LONG BEACH (601 N. LONG BEACH BLVD.) - Bus Station . Services: fully wheelchair accessible, public restrooms, public payphones, full-service food facilities, paid short-term parking, paid long-term parking, call for taxi service, public transit connection.
Colleges/universities with over 2000 students nearest to Del Aire:
El Camino Community College District (about 4 miles; Torrance, CA; Full-time enrollment: 13,952)
Los Angeles Southwest College (about 4 miles; Los Angeles, CA; FT enrollment: 3,247)
Loyola Marymount University (about 5 miles; Los Angeles, CA; FT enrollment: 7,720)
West Los Angeles College (about 7 miles; Culver City, CA; FT enrollment: 5,221)
California State University-Dominguez Hills (about 8 miles; Carson, CA; FT enrollment: 9,862)
University of Southern California (about 9 miles; Los Angeles, CA; FT enrollment: 33,161)
Santa Monica College (about 10 miles; Santa Monica, CA; FT enrollment: 20,311)
User-submitted facts and corrections:
Del Aire uses two zip codes. In addition to 90250, a portion of 90304 also is in Del Aire. This was one of the last acts Kenneth Hahn passed while he was in office. The 90304 part of Del Aire is roughly bounded by Aviation, Imperial Hwy, La Cienga, and 120th St. The 90250 portion is roughly bounded by Aviation, 120th, La Cienga, and El Segundo Blvd. Thank for taking the time to represent our community. added by Debbie
Religion statistics for Del Aire, CA (based on Los Angeles County data)
Religion
Adherents
Congregations
Catholic
3,542,994
275
Evangelical Protestant
814,611
3,249
Other
451,594
1,023
Mainline Protestant
229,056
860
Black Protestant
112,338
290
Orthodox
63,517
76
None
4,604,495
-
Source: Clifford Grammich, Kirk Hadaway, Richard Houseal, Dale E.Jones, Alexei Krindatch, Richie Stanley and Richard H.Taylor. 2012. 2010 U.S.Religion Census: Religious Congregations & Membership Study. Association of Statisticians of American Religious Bodies. Jones, Dale E., et al. 2002. Congregations and Membership in the United States 2000. Nashville, TN: Glenmary Research Center. Graphs represent county-level data
APC, 11701 S La Cienega Blvd (Lat: 33.928056 Lon: -118.371361), Type: Bant, Structure height: 51.2 m, Overall height: 57 m, Call Sign: WRCW407, Licensee ID: L01906014, Assigned Frequencies: 11385.0 MHz, 6345.49 MHz, 11385.0 MHz, 6345.49 MHz, 11385.0 MHz, 6345.49 MHz, 11385.0 MHz, 6345.49 MHz, 11385.0 MHz, 6345.49 MHz... (+8 more), Grant Date: 02/12/2019, Expiration Date: 02/12/2029, Certifier: Ted Pao, Registrant: Los Angeles Regional Interoperable Communications System, 2525 Corporate Place Suite #100, Los Angeles, CA 91754, Phone: (323) 881-8028, Email:
FCC Registered Amateur Radio Licenses:
1
Call Sign: W6HZL, Licensee ID: L00333171, Grant Date: 11/06/2013, Expiration Date: 12/28/2023, Certifier: George B Rader, Registrant: George B Rader, 5358 W 123rd St, Del Aire, CA 90250
Home Mortgage Disclosure Act Aggregated Statistics For Year 2009 (Based on 2 partial tracts)
A) FHA, FSA/RHS & VA Home Purchase Loans
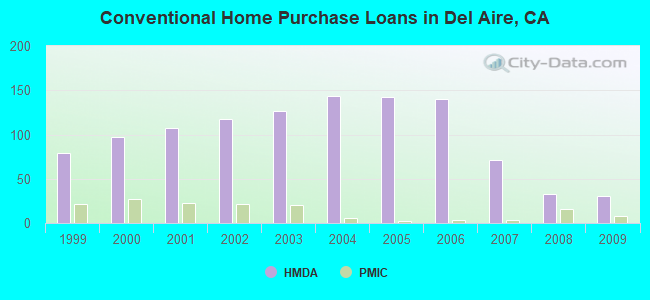
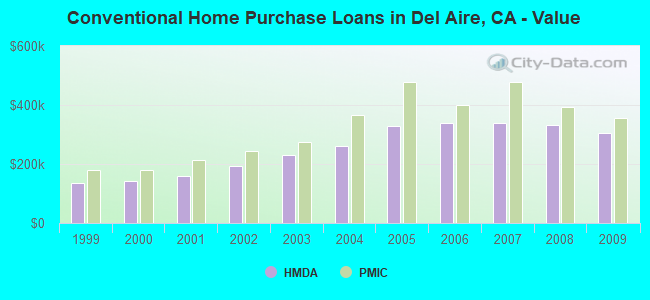
B) Conventional Home Purchase Loans
C) Refinancings
D) Home Improvement Loans
E) Loans on Dwellings For 5+ Families
F) Non-occupant Loans on < 5 Family Dwellings (A B C & D)
Number
Average Value
Number
Average Value
Number
Average Value
Number
Average Value
Number
Average Value
Number
Average Value
LOANS ORIGINATED
33
$398,984
30
$305,146
149
$285,290
8
$210,222
1
$805,500
8
$249,822
APPLICATIONS APPROVED, NOT ACCEPTED
1
$496,430
4
$327,610
22
$308,080
3
$234,533
0
$0
1
$572,190
APPLICATIONS DENIED
3
$332,970
11
$298,188
55
$318,213
4
$200,405
0
$0
5
$221,042
APPLICATIONS WITHDRAWN
3
$429,647
6
$283,475
26
$311,500
3
$191,263
0
$0
2
$150,355
FILES CLOSED FOR INCOMPLETENESS
1
$179,220
1
$498,460
11
$336,250
1
$746,260
0
$0
0
$0
Aggregated Statistics For Year 2008 (Based on 2 partial tracts)
A) FHA, FSA/RHS & VA Home Purchase Loans
B) Conventional Home Purchase Loans
C) Refinancings
D) Home Improvement Loans
E) Loans on Dwellings For 5+ Families
F) Non-occupant Loans on < 5 Family Dwellings (A B C & D)
Number
Average Value
Number
Average Value
Number
Average Value
Number
Average Value
Number
Average Value
Number
Average Value
LOANS ORIGINATED
14
$429,909
33
$333,844
97
$301,783
7
$193,147
3
$550,633
12
$306,934
APPLICATIONS APPROVED, NOT ACCEPTED
1
$288,700
5
$287,696
25
$324,522
3
$342,057
0
$0
1
$347,930
APPLICATIONS DENIED
1
$380,590
11
$387,099
56
$317,909
10
$85,480
1
$246,710
3
$222,957
APPLICATIONS WITHDRAWN
2
$386,730
8
$353,984
24
$347,291
5
$173,960
0
$0
1
$230,700
FILES CLOSED FOR INCOMPLETENESS
1
$152,460
6
$318,857
5
$339,602
0
$0
0
$0
2
$328,660
Aggregated Statistics For Year 2007 (Based on 2 partial tracts)
B) Conventional Home Purchase Loans
C) Refinancings
D) Home Improvement Loans
E) Loans on Dwellings For 5+ Families
F) Non-occupant Loans on < 5 Family Dwellings (A B C & D)
G) Loans On Manufactured Home Dwelling (A B C & D)
Number
Average Value
Number
Average Value
Number
Average Value
Number
Average Value
Number
Average Value
Number
Average Value
LOANS ORIGINATED
71
$339,650
149
$325,042
22
$249,940
4
$821,118
15
$366,005
0
$0
APPLICATIONS APPROVED, NOT ACCEPTED
22
$338,491
43
$366,950
8
$246,442
0
$0
2
$371,050
1
$52,510
APPLICATIONS DENIED
47
$341,664
117
$372,248
17
$144,155
0
$0
9
$298,042
1
$47,440
APPLICATIONS WITHDRAWN
24
$381,132
38
$368,321
10
$313,304
1
$3,146,900
4
$412,290
0
$0
FILES CLOSED FOR INCOMPLETENESS
8
$404,444
21
$402,260
3
$275,303
0
$0
1
$284,670
0
$0
Aggregated Statistics For Year 2006 (Based on 2 partial tracts)
B) Conventional Home Purchase Loans
C) Refinancings
D) Home Improvement Loans
E) Loans on Dwellings For 5+ Families
F) Non-occupant Loans on < 5 Family Dwellings (A B C & D)
G) Loans On Manufactured Home Dwelling (A B C & D)
Number
Average Value
Number
Average Value
Number
Average Value
Number
Average Value
Number
Average Value
Number
Average Value
LOANS ORIGINATED
140
$340,428
220
$344,667
28
$214,019
2
$777,265
22
$307,840
0
$0
APPLICATIONS APPROVED, NOT ACCEPTED
28
$320,656
57
$332,892
5
$315,896
0
$0
4
$397,160
0
$0
APPLICATIONS DENIED
74
$325,686
114
$390,009
22
$184,909
0
$0
6
$428,988
1
$37,150
APPLICATIONS WITHDRAWN
33
$345,219
71
$370,805
4
$196,955
0
$0
3
$186,003
0
$0
FILES CLOSED FOR INCOMPLETENESS
4
$366,795
22
$356,455
3
$175,013
1
$253,040
1
$191,060
0
$0
Aggregated Statistics For Year 2005 (Based on 2 partial tracts)
B) Conventional Home Purchase Loans
C) Refinancings
D) Home Improvement Loans
E) Loans on Dwellings For 5+ Families
F) Non-occupant Loans on < 5 Family Dwellings (A B C & D)
G) Loans On Manufactured Home Dwelling (A B C & D)
Number
Average Value
Number
Average Value
Number
Average Value
Number
Average Value
Number
Average Value
Number
Average Value
LOANS ORIGINATED
142
$328,755
335
$304,939
43
$254,385
6
$558,833
35
$312,207
0
$0
APPLICATIONS APPROVED, NOT ACCEPTED
33
$285,361
51
$320,151
6
$187,645
0
$0
7
$321,280
1
$42,360
APPLICATIONS DENIED
50
$301,406
156
$326,119
30
$215,546
0
$0
13
$315,443
0
$0
APPLICATIONS WITHDRAWN
40
$338,633
115
$333,175
14
$227,284
0
$0
10
$321,119
1
$155,760
FILES CLOSED FOR INCOMPLETENESS
10
$338,120
37
$306,095
0
$0
0
$0
2
$452,605
0
$0
Aggregated Statistics For Year 2004 (Based on 2 partial tracts)
A) FHA, FSA/RHS & VA Home Purchase Loans
B) Conventional Home Purchase Loans
C) Refinancings
D) Home Improvement Loans
E) Loans on Dwellings For 5+ Families
F) Non-occupant Loans on < 5 Family Dwellings (A B C & D)
G) Loans On Manufactured Home Dwelling (A B C & D)
Number
Average Value
Number
Average Value
Number
Average Value
Number
Average Value
Number
Average Value
Number
Average Value
Number
Average Value
LOANS ORIGINATED
1
$280,880
144
$262,432
357
$244,912
42
$186,069
3
$513,973
34
$240,752
1
$164,480
APPLICATIONS APPROVED, NOT ACCEPTED
0
$0
31
$258,541
62
$255,817
8
$212,211
0
$0
8
$261,080
0
$0
APPLICATIONS DENIED
1
$144,680
42
$249,544
120
$258,979
20
$144,765
0
$0
11
$261,312
2
$253,040
APPLICATIONS WITHDRAWN
1
$139,460
25
$266,588
115
$268,099
10
$175,214
0
$0
8
$212,899
0
$0
FILES CLOSED FOR INCOMPLETENESS
0
$0
8
$265,639
25
$270,685
4
$188,202
0
$0
3
$296,077
1
$165,530
Aggregated Statistics For Year 2003 (Based on 2 partial tracts)
A) FHA, FSA/RHS & VA Home Purchase Loans
B) Conventional Home Purchase Loans
C) Refinancings
D) Home Improvement Loans
E) Loans on Dwellings For 5+ Families
F) Non-occupant Loans on < 5 Family Dwellings (A B C & D)
Number
Average Value
Number
Average Value
Number
Average Value
Number
Average Value
Number
Average Value
Number
Average Value
LOANS ORIGINATED
2
$316,420
127
$231,343
641
$194,209
14
$84,408
3
$930,610
34
$187,107
APPLICATIONS APPROVED, NOT ACCEPTED
1
$139,460
23
$233,530
85
$201,688
5
$75,720
0
$0
5
$250,432
APPLICATIONS DENIED
0
$0
28
$223,962
131
$200,197
8
$64,251
0
$0
10
$219,218
APPLICATIONS WITHDRAWN
1
$278,930
29
$223,578
136
$206,751
3
$43,763
0
$0
6
$213,790
FILES CLOSED FOR INCOMPLETENESS
1
$145,980
8
$222,550
35
$204,135
3
$63,523
0
$0
1
$178,390
Aggregated Statistics For Year 2002 (Based on 2 partial tracts)
A) FHA, FSA/RHS & VA Home Purchase Loans
B) Conventional Home Purchase Loans
C) Refinancings
D) Home Improvement Loans
E) Loans on Dwellings For 5+ Families
F) Non-occupant Loans on < 5 Family Dwellings (A B C & D)
Number
Average Value
Number
Average Value
Number
Average Value
Number
Average Value
Number
Average Value
Number
Average Value
LOANS ORIGINATED
7
$230,829
118
$191,823
372
$178,328
10
$47,929
5
$408,784
24
$153,216
APPLICATIONS APPROVED, NOT ACCEPTED
2
$219,950
19
$191,779
66
$181,602
5
$26,108
1
$161,310
3
$162,890
APPLICATIONS DENIED
3
$279,647
31
$198,982
121
$183,363
11
$31,357
1
$1,640,290
6
$169,398
APPLICATIONS WITHDRAWN
2
$271,105
18
$184,933
95
$186,949
1
$45,620
1
$455,370
3
$218,327
FILES CLOSED FOR INCOMPLETENESS
1
$207,240
7
$175,130
25
$165,032
1
$55,390
0
$0
0
$0
Aggregated Statistics For Year 2001 (Based on 2 partial tracts)
A) FHA, FSA/RHS & VA Home Purchase Loans
B) Conventional Home Purchase Loans
C) Refinancings
D) Home Improvement Loans
E) Loans on Dwellings For 5+ Families
F) Non-occupant Loans on < 5 Family Dwellings (A B C & D)
Number
Average Value
Number
Average Value
Number
Average Value
Number
Average Value
Number
Average Value
Number
Average Value
LOANS ORIGINATED
17
$209,942
107
$159,494
297
$158,983
10
$31,150
2
$821,840
20
$136,335
APPLICATIONS APPROVED, NOT ACCEPTED
1
$222,230
12
$145,103
49
$153,781
4
$37,642
0
$0
4
$141,540
APPLICATIONS DENIED
4
$247,698
20
$153,725
93
$156,101
12
$39,845
0
$0
6
$112,125
APPLICATIONS WITHDRAWN
5
$191,430
21
$171,857
78
$166,864
2
$100,265
1
$1,365,990
6
$155,382
FILES CLOSED FOR INCOMPLETENESS
0
$0
2
$152,820
38
$153,927
1
$74,340
1
$172,070
1
$127,150
Aggregated Statistics For Year 2000 (Based on 2 partial tracts)
A) FHA, FSA/RHS & VA Home Purchase Loans
B) Conventional Home Purchase Loans
C) Refinancings
D) Home Improvement Loans
E) Loans on Dwellings For 5+ Families
F) Non-occupant Loans on < 5 Family Dwellings (A B C & D)
Number
Average Value
Number
Average Value
Number
Average Value
Number
Average Value
Number
Average Value
Number
Average Value
LOANS ORIGINATED
20
$194,584
97
$141,453
88
$124,888
12
$35,115
2
$330,410
9
$135,660
APPLICATIONS APPROVED, NOT ACCEPTED
2
$170,985
9
$156,369
24
$145,174
11
$43,333
0
$0
1
$122,520
APPLICATIONS DENIED
1
$261,760
20
$123,090
53
$123,528
10
$22,784
0
$0
3
$140,550
APPLICATIONS WITHDRAWN
4
$211,400
15
$143,865
31
$106,344
3
$45,563
0
$0
1
$260,660
FILES CLOSED FOR INCOMPLETENESS
0
$0
0
$0
15
$149,157
0
$0
0
$0
1
$188,620
Aggregated Statistics For Year 1999 (Based on 2 partial tracts)
A) FHA, FSA/RHS & VA Home Purchase Loans
B) Conventional Home Purchase Loans
C) Refinancings
D) Home Improvement Loans
E) Loans on Dwellings For 5+ Families
F) Non-occupant Loans on < 5 Family Dwellings (A B C & D)


 Recent articles from our blog. Our writers, many of them Ph.D. graduates or candidates, create easy-to-read articles on a wide variety of topics.

 (1.2 miles