Covina, California Submit your own pictures of this city and show them to the world
OSM Map
General Map
Google Map
MSN Map
OSM Map
General Map
Google Map
MSN Map
OSM Map
General Map
Google Map
MSN Map
OSM Map
General Map
Google Map
MSN Map
Please wait while loading the map...
Population in 2022: 49,489 (100% urban, 0% rural). Population change since 2000: +5.7%Males: 25,191 Females: 24,298
March 2022 cost of living index in Covina: 136.4 (high, U.S. average is 100) Percentage of residents living in poverty in 2022: 7.7%for White Non-Hispanic residents , 10.0% for Black residents , 8.2% for Hispanic or Latino residents , 6.7% for American Indian residents , 7.1% for other race residents , 5.0% for two or more races residents )
Profiles of local businesses
Business Search - 14 Million verified businesses
Data:
Median household income ($)
Median household income (% change since 2000)
Household income diversity
Ratio of average income to average house value (%)
Ratio of average income to average rent
Median household income ($) - White
Median household income ($) - Black or African American
Median household income ($) - Asian
Median household income ($) - Hispanic or Latino
Median household income ($) - American Indian and Alaska Native
Median household income ($) - Multirace
Median household income ($) - Other Race
Median household income for houses/condos with a mortgage ($)
Median household income for apartments without a mortgage ($)
Races - White alone (%)
Races - White alone (% change since 2000)
Races - Black alone (%)
Races - Black alone (% change since 2000)
Races - American Indian alone (%)
Races - American Indian alone (% change since 2000)
Races - Asian alone (%)
Races - Asian alone (% change since 2000)
Races - Hispanic (%)
Races - Hispanic (% change since 2000)
Races - Native Hawaiian and Other Pacific Islander alone (%)
Races - Native Hawaiian and Other Pacific Islander alone (% change since 2000)
Races - Two or more races (%)
Races - Two or more races (% change since 2000)
Races - Other race alone (%)
Races - Other race alone (% change since 2000)
Racial diversity
Unemployment (%)
Unemployment (% change since 2000)
Unemployment (%) - White
Unemployment (%) - Black or African American
Unemployment (%) - Asian
Unemployment (%) - Hispanic or Latino
Unemployment (%) - American Indian and Alaska Native
Unemployment (%) - Multirace
Unemployment (%) - Other Race
Population density (people per square mile)
Population - Males (%)
Population - Females (%)
Population - Males (%) - White
Population - Males (%) - Black or African American
Population - Males (%) - Asian
Population - Males (%) - Hispanic or Latino
Population - Males (%) - American Indian and Alaska Native
Population - Males (%) - Multirace
Population - Males (%) - Other Race
Population - Females (%) - White
Population - Females (%) - Black or African American
Population - Females (%) - Asian
Population - Females (%) - Hispanic or Latino
Population - Females (%) - American Indian and Alaska Native
Population - Females (%) - Multirace
Population - Females (%) - Other Race
Coronavirus confirmed cases (May 23, 2024)
Deaths caused by coronavirus (May 23, 2024)
Coronavirus confirmed cases (per 100k population) (May 23, 2024)
Deaths caused by coronavirus (per 100k population) (May 23, 2024)
Daily increase in number of cases (May 23, 2024)
Weekly increase in number of cases (May 23, 2024)
Cases doubled (in days) (May 23, 2024)
Hospitalized patients (Apr 18, 2022)
Negative test results (Apr 18, 2022)
Total test results (Apr 18, 2022)
COVID Vaccine doses distributed (per 100k population) (Sep 19, 2023)
COVID Vaccine doses administered (per 100k population) (Sep 19, 2023)
COVID Vaccine doses distributed (Sep 19, 2023)
COVID Vaccine doses administered (Sep 19, 2023)
Likely homosexual households (%)
Likely homosexual households (% change since 2000)
Likely homosexual households - Lesbian couples (%)
Likely homosexual households - Lesbian couples (% change since 2000)
Likely homosexual households - Gay men (%)
Likely homosexual households - Gay men (% change since 2000)
Cost of living index
Median gross rent ($)
Median contract rent ($)
Median monthly housing costs ($)
Median house or condo value ($)
Median house or condo value ($ change since 2000)
Mean house or condo value by units in structure - 1, detached ($)
Mean house or condo value by units in structure - 1, attached ($)
Mean house or condo value by units in structure - 2 ($)
Mean house or condo value by units in structure by units in structure - 3 or 4 ($)
Mean house or condo value by units in structure - 5 or more ($)
Mean house or condo value by units in structure - Boat, RV, van, etc. ($)
Mean house or condo value by units in structure - Mobile home ($)
Median house or condo value ($) - White
Median house or condo value ($) - Black or African American
Median house or condo value ($) - Asian
Median house or condo value ($) - Hispanic or Latino
Median house or condo value ($) - American Indian and Alaska Native
Median house or condo value ($) - Multirace
Median house or condo value ($) - Other Race
Median resident age
Resident age diversity
Median resident age - Males
Median resident age - Females
Median resident age - White
Median resident age - Black or African American
Median resident age - Asian
Median resident age - Hispanic or Latino
Median resident age - American Indian and Alaska Native
Median resident age - Multirace
Median resident age - Other Race
Median resident age - Males - White
Median resident age - Males - Black or African American
Median resident age - Males - Asian
Median resident age - Males - Hispanic or Latino
Median resident age - Males - American Indian and Alaska Native
Median resident age - Males - Multirace
Median resident age - Males - Other Race
Median resident age - Females - White
Median resident age - Females - Black or African American
Median resident age - Females - Asian
Median resident age - Females - Hispanic or Latino
Median resident age - Females - American Indian and Alaska Native
Median resident age - Females - Multirace
Median resident age - Females - Other Race
Commute - mean travel time to work (minutes)
Travel time to work - Less than 5 minutes (%)
Travel time to work - Less than 5 minutes (% change since 2000)
Travel time to work - 5 to 9 minutes (%)
Travel time to work - 5 to 9 minutes (% change since 2000)
Travel time to work - 10 to 19 minutes (%)
Travel time to work - 10 to 19 minutes (% change since 2000)
Travel time to work - 20 to 29 minutes (%)
Travel time to work - 20 to 29 minutes (% change since 2000)
Travel time to work - 30 to 39 minutes (%)
Travel time to work - 30 to 39 minutes (% change since 2000)
Travel time to work - 40 to 59 minutes (%)
Travel time to work - 40 to 59 minutes (% change since 2000)
Travel time to work - 60 to 89 minutes (%)
Travel time to work - 60 to 89 minutes (% change since 2000)
Travel time to work - 90 or more minutes (%)
Travel time to work - 90 or more minutes (% change since 2000)
Marital status - Never married (%)
Marital status - Now married (%)
Marital status - Separated (%)
Marital status - Widowed (%)
Marital status - Divorced (%)
Median family income ($)
Median family income (% change since 2000)
Median non-family income ($)
Median non-family income (% change since 2000)
Median per capita income ($)
Median per capita income (% change since 2000)
Median family income ($) - White
Median family income ($) - Black or African American
Median family income ($) - Asian
Median family income ($) - Hispanic or Latino
Median family income ($) - American Indian and Alaska Native
Median family income ($) - Multirace
Median family income ($) - Other Race
Median year house/condo built
Median year apartment built
Year house built - Built 2005 or later (%)
Year house built - Built 2000 to 2004 (%)
Year house built - Built 1990 to 1999 (%)
Year house built - Built 1980 to 1989 (%)
Year house built - Built 1970 to 1979 (%)
Year house built - Built 1960 to 1969 (%)
Year house built - Built 1950 to 1959 (%)
Year house built - Built 1940 to 1949 (%)
Year house built - Built 1939 or earlier (%)
Average household size
Household density (households per square mile)
Average household size - White
Average household size - Black or African American
Average household size - Asian
Average household size - Hispanic or Latino
Average household size - American Indian and Alaska Native
Average household size - Multirace
Average household size - Other Race
Occupied housing units (%)
Vacant housing units (%)
Owner occupied housing units (%)
Renter occupied housing units (%)
Vacancy status - For rent (%)
Vacancy status - For sale only (%)
Vacancy status - Rented or sold, not occupied (%)
Vacancy status - For seasonal, recreational, or occasional use (%)
Vacancy status - For migrant workers (%)
Vacancy status - Other vacant (%)
Residents with income below the poverty level (%)
Residents with income below 50% of the poverty level (%)
Children below poverty level (%)
Poor families by family type - Married-couple family (%)
Poor families by family type - Male, no wife present (%)
Poor families by family type - Female, no husband present (%)
Poverty status for native-born residents (%)
Poverty status for foreign-born residents (%)
Poverty among high school graduates not in families (%)
Poverty among people who did not graduate high school not in families (%)
Residents with income below the poverty level (%) - White
Residents with income below the poverty level (%) - Black or African American
Residents with income below the poverty level (%) - Asian
Residents with income below the poverty level (%) - Hispanic or Latino
Residents with income below the poverty level (%) - American Indian and Alaska Native
Residents with income below the poverty level (%) - Multirace
Residents with income below the poverty level (%) - Other Race
Air pollution - Air Quality Index (AQI)
Air pollution - CO
Air pollution - NO2
Air pollution - SO2
Air pollution - Ozone
Air pollution - PM10
Air pollution - PM25
Air pollution - Pb
Crime - Murders per 100,000 population
Crime - Rapes per 100,000 population
Crime - Robberies per 100,000 population
Crime - Assaults per 100,000 population
Crime - Burglaries per 100,000 population
Crime - Thefts per 100,000 population
Crime - Auto thefts per 100,000 population
Crime - Arson per 100,000 population
Crime - City-data.com crime index
Crime - Violent crime index
Crime - Property crime index
Crime - Murders per 100,000 population (5 year average)
Crime - Rapes per 100,000 population (5 year average)
Crime - Robberies per 100,000 population (5 year average)
Crime - Assaults per 100,000 population (5 year average)
Crime - Burglaries per 100,000 population (5 year average)
Crime - Thefts per 100,000 population (5 year average)
Crime - Auto thefts per 100,000 population (5 year average)
Crime - Arson per 100,000 population (5 year average)
Crime - City-data.com crime index (5 year average)
Crime - Violent crime index (5 year average)
Crime - Property crime index (5 year average)
1996 Presidential Elections Results (%) - Democratic Party (Clinton)
1996 Presidential Elections Results (%) - Republican Party (Dole)
1996 Presidential Elections Results (%) - Other
2000 Presidential Elections Results (%) - Democratic Party (Gore)
2000 Presidential Elections Results (%) - Republican Party (Bush)
2000 Presidential Elections Results (%) - Other
2004 Presidential Elections Results (%) - Democratic Party (Kerry)
2004 Presidential Elections Results (%) - Republican Party (Bush)
2004 Presidential Elections Results (%) - Other
2008 Presidential Elections Results (%) - Democratic Party (Obama)
2008 Presidential Elections Results (%) - Republican Party (McCain)
2008 Presidential Elections Results (%) - Other
2012 Presidential Elections Results (%) - Democratic Party (Obama)
2012 Presidential Elections Results (%) - Republican Party (Romney)
2012 Presidential Elections Results (%) - Other
2016 Presidential Elections Results (%) - Democratic Party (Clinton)
2016 Presidential Elections Results (%) - Republican Party (Trump)
2016 Presidential Elections Results (%) - Other
2020 Presidential Elections Results (%) - Democratic Party (Biden)
2020 Presidential Elections Results (%) - Republican Party (Trump)
2020 Presidential Elections Results (%) - Other
Ancestries Reported - Arab (%)
Ancestries Reported - Czech (%)
Ancestries Reported - Danish (%)
Ancestries Reported - Dutch (%)
Ancestries Reported - English (%)
Ancestries Reported - French (%)
Ancestries Reported - French Canadian (%)
Ancestries Reported - German (%)
Ancestries Reported - Greek (%)
Ancestries Reported - Hungarian (%)
Ancestries Reported - Irish (%)
Ancestries Reported - Italian (%)
Ancestries Reported - Lithuanian (%)
Ancestries Reported - Norwegian (%)
Ancestries Reported - Polish (%)
Ancestries Reported - Portuguese (%)
Ancestries Reported - Russian (%)
Ancestries Reported - Scotch-Irish (%)
Ancestries Reported - Scottish (%)
Ancestries Reported - Slovak (%)
Ancestries Reported - Subsaharan African (%)
Ancestries Reported - Swedish (%)
Ancestries Reported - Swiss (%)
Ancestries Reported - Ukrainian (%)
Ancestries Reported - United States (%)
Ancestries Reported - Welsh (%)
Ancestries Reported - West Indian (%)
Ancestries Reported - Other (%)
Educational Attainment - No schooling completed (%)
Educational Attainment - Less than high school (%)
Educational Attainment - High school or equivalent (%)
Educational Attainment - Less than 1 year of college (%)
Educational Attainment - 1 or more years of college (%)
Educational Attainment - Associate degree (%)
Educational Attainment - Bachelor's degree (%)
Educational Attainment - Master's degree (%)
Educational Attainment - Professional school degree (%)
Educational Attainment - Doctorate degree (%)
School Enrollment - Nursery, preschool (%)
School Enrollment - Kindergarten (%)
School Enrollment - Grade 1 to 4 (%)
School Enrollment - Grade 5 to 8 (%)
School Enrollment - Grade 9 to 12 (%)
School Enrollment - College undergrad (%)
School Enrollment - Graduate or professional (%)
School Enrollment - Not enrolled in school (%)
School enrollment - Public schools (%)
School enrollment - Private schools (%)
School enrollment - Not enrolled (%)
Median number of rooms in houses and condos
Median number of rooms in apartments
Housing units lacking complete plumbing facilities (%)
Housing units lacking complete kitchen facilities (%)
Density of houses
Urban houses (%)
Rural houses (%)
Households with people 60 years and over (%)
Households with people 65 years and over (%)
Households with people 75 years and over (%)
Households with one or more nonrelatives (%)
Households with no nonrelatives (%)
Population in households (%)
Family households (%)
Nonfamily households (%)
Population in families (%)
Family households with own children (%)
Median number of bedrooms in owner occupied houses
Mean number of bedrooms in owner occupied houses
Median number of bedrooms in renter occupied houses
Mean number of bedrooms in renter occupied houses
Median number of vehichles in owner occupied houses
Mean number of vehichles in owner occupied houses
Median number of vehichles in renter occupied houses
Mean number of vehichles in renter occupied houses
Mortgage status - with mortgage (%)
Mortgage status - with second mortgage (%)
Mortgage status - with home equity loan (%)
Mortgage status - with both second mortgage and home equity loan (%)
Mortgage status - without a mortgage (%)
Average family size
Average family size - White
Average family size - Black or African American
Average family size - Asian
Average family size - Hispanic or Latino
Average family size - American Indian and Alaska Native
Average family size - Multirace
Average family size - Other Race
Geographical mobility - Same house 1 year ago (%)
Geographical mobility - Moved within same county (%)
Geographical mobility - Moved from different county within same state (%)
Geographical mobility - Moved from different state (%)
Geographical mobility - Moved from abroad (%)
Place of birth - Born in state of residence (%)
Place of birth - Born in other state (%)
Place of birth - Native, outside of US (%)
Place of birth - Foreign born (%)
Housing units in structures - 1, detached (%)
Housing units in structures - 1, attached (%)
Housing units in structures - 2 (%)
Housing units in structures - 3 or 4 (%)
Housing units in structures - 5 to 9 (%)
Housing units in structures - 10 to 19 (%)
Housing units in structures - 20 to 49 (%)
Housing units in structures - 50 or more (%)
Housing units in structures - Mobile home (%)
Housing units in structures - Boat, RV, van, etc. (%)
House/condo owner moved in on average (years ago)
Renter moved in on average (years ago)
Year householder moved into unit - Moved in 1999 to March 2000 (%)
Year householder moved into unit - Moved in 1995 to 1998 (%)
Year householder moved into unit - Moved in 1990 to 1994 (%)
Year householder moved into unit - Moved in 1980 to 1989 (%)
Year householder moved into unit - Moved in 1970 to 1979 (%)
Year householder moved into unit - Moved in 1969 or earlier (%)
Means of transportation to work - Drove car alone (%)
Means of transportation to work - Carpooled (%)
Means of transportation to work - Public transportation (%)
Means of transportation to work - Bus or trolley bus (%)
Means of transportation to work - Streetcar or trolley car (%)
Means of transportation to work - Subway or elevated (%)
Means of transportation to work - Railroad (%)
Means of transportation to work - Ferryboat (%)
Means of transportation to work - Taxicab (%)
Means of transportation to work - Motorcycle (%)
Means of transportation to work - Bicycle (%)
Means of transportation to work - Walked (%)
Means of transportation to work - Other means (%)
Working at home (%)
Industry diversity
Most Common Industries - Agriculture, forestry, fishing and hunting, and mining (%)
Most Common Industries - Agriculture, forestry, fishing and hunting (%)
Most Common Industries - Mining, quarrying, and oil and gas extraction (%)
Most Common Industries - Construction (%)
Most Common Industries - Manufacturing (%)
Most Common Industries - Wholesale trade (%)
Most Common Industries - Retail trade (%)
Most Common Industries - Transportation and warehousing, and utilities (%)
Most Common Industries - Transportation and warehousing (%)
Most Common Industries - Utilities (%)
Most Common Industries - Information (%)
Most Common Industries - Finance and insurance, and real estate and rental and leasing (%)
Most Common Industries - Finance and insurance (%)
Most Common Industries - Real estate and rental and leasing (%)
Most Common Industries - Professional, scientific, and management, and administrative and waste management services (%)
Most Common Industries - Professional, scientific, and technical services (%)
Most Common Industries - Management of companies and enterprises (%)
Most Common Industries - Administrative and support and waste management services (%)
Most Common Industries - Educational services, and health care and social assistance (%)
Most Common Industries - Educational services (%)
Most Common Industries - Health care and social assistance (%)
Most Common Industries - Arts, entertainment, and recreation, and accommodation and food services (%)
Most Common Industries - Arts, entertainment, and recreation (%)
Most Common Industries - Accommodation and food services (%)
Most Common Industries - Other services, except public administration (%)
Most Common Industries - Public administration (%)
Occupation diversity
Most Common Occupations - Management, business, science, and arts occupations (%)
Most Common Occupations - Management, business, and financial occupations (%)
Most Common Occupations - Management occupations (%)
Most Common Occupations - Business and financial operations occupations (%)
Most Common Occupations - Computer, engineering, and science occupations (%)
Most Common Occupations - Computer and mathematical occupations (%)
Most Common Occupations - Architecture and engineering occupations (%)
Most Common Occupations - Life, physical, and social science occupations (%)
Most Common Occupations - Education, legal, community service, arts, and media occupations (%)
Most Common Occupations - Community and social service occupations (%)
Most Common Occupations - Legal occupations (%)
Most Common Occupations - Education, training, and library occupations (%)
Most Common Occupations - Arts, design, entertainment, sports, and media occupations (%)
Most Common Occupations - Healthcare practitioners and technical occupations (%)
Most Common Occupations - Health diagnosing and treating practitioners and other technical occupations (%)
Most Common Occupations - Health technologists and technicians (%)
Most Common Occupations - Service occupations (%)
Most Common Occupations - Healthcare support occupations (%)
Most Common Occupations - Protective service occupations (%)
Most Common Occupations - Fire fighting and prevention, and other protective service workers including supervisors (%)
Most Common Occupations - Law enforcement workers including supervisors (%)
Most Common Occupations - Food preparation and serving related occupations (%)
Most Common Occupations - Building and grounds cleaning and maintenance occupations (%)
Most Common Occupations - Personal care and service occupations (%)
Most Common Occupations - Sales and office occupations (%)
Most Common Occupations - Sales and related occupations (%)
Most Common Occupations - Office and administrative support occupations (%)
Most Common Occupations - Natural resources, construction, and maintenance occupations (%)
Most Common Occupations - Farming, fishing, and forestry occupations (%)
Most Common Occupations - Construction and extraction occupations (%)
Most Common Occupations - Installation, maintenance, and repair occupations (%)
Most Common Occupations - Production, transportation, and material moving occupations (%)
Most Common Occupations - Production occupations (%)
Most Common Occupations - Transportation occupations (%)
Most Common Occupations - Material moving occupations (%)
People in Group quarters - Institutionalized population (%)
People in Group quarters - Correctional institutions (%)
People in Group quarters - Federal prisons and detention centers (%)
People in Group quarters - Halfway houses (%)
People in Group quarters - Local jails and other confinement facilities (including police lockups) (%)
People in Group quarters - Military disciplinary barracks (%)
People in Group quarters - State prisons (%)
People in Group quarters - Other types of correctional institutions (%)
People in Group quarters - Nursing homes (%)
People in Group quarters - Hospitals/wards, hospices, and schools for the handicapped (%)
People in Group quarters - Hospitals/wards and hospices for chronically ill (%)
People in Group quarters - Hospices or homes for chronically ill (%)
People in Group quarters - Military hospitals or wards for chronically ill (%)
People in Group quarters - Other hospitals or wards for chronically ill (%)
People in Group quarters - Hospitals or wards for drug/alcohol abuse (%)
People in Group quarters - Mental (Psychiatric) hospitals or wards (%)
People in Group quarters - Schools, hospitals, or wards for the mentally retarded (%)
People in Group quarters - Schools, hospitals, or wards for the physically handicapped (%)
People in Group quarters - Institutions for the deaf (%)
People in Group quarters - Institutions for the blind (%)
People in Group quarters - Orthopedic wards and institutions for the physically handicapped (%)
People in Group quarters - Wards in general hospitals for patients who have no usual home elsewhere (%)
People in Group quarters - Wards in military hospitals for patients who have no usual home elsewhere (%)
People in Group quarters - Juvenile institutions (%)
People in Group quarters - Long-term care (%)
People in Group quarters - Homes for abused, dependent, and neglected children (%)
People in Group quarters - Residential treatment centers for emotionally disturbed children (%)
People in Group quarters - Training schools for juvenile delinquents (%)
People in Group quarters - Short-term care, detention or diagnostic centers for delinquent children (%)
People in Group quarters - Type of juvenile institution unknown (%)
People in Group quarters - Noninstitutionalized population (%)
People in Group quarters - College dormitories (includes college quarters off campus) (%)
People in Group quarters - Military quarters (%)
People in Group quarters - On base (%)
People in Group quarters - Barracks, unaccompanied personnel housing (UPH), (Enlisted/Officer), ;and similar group living quarters for military personnel (%)
People in Group quarters - Transient quarters for temporary residents (%)
People in Group quarters - Military ships (%)
People in Group quarters - Group homes (%)
People in Group quarters - Homes or halfway houses for drug/alcohol abuse (%)
People in Group quarters - Homes for the mentally ill (%)
People in Group quarters - Homes for the mentally retarded (%)
People in Group quarters - Homes for the physically handicapped (%)
People in Group quarters - Other group homes (%)
People in Group quarters - Religious group quarters (%)
People in Group quarters - Dormitories (%)
People in Group quarters - Agriculture workers' dormitories on farms (%)
People in Group quarters - Job Corps and vocational training facilities (%)
People in Group quarters - Other workers' dormitories (%)
People in Group quarters - Crews of maritime vessels (%)
People in Group quarters - Other nonhousehold living situations (%)
People in Group quarters - Other noninstitutional group quarters (%)
Residents speaking English at home (%)
Residents speaking English at home - Born in the United States (%)
Residents speaking English at home - Native, born elsewhere (%)
Residents speaking English at home - Foreign born (%)
Residents speaking Spanish at home (%)
Residents speaking Spanish at home - Born in the United States (%)
Residents speaking Spanish at home - Native, born elsewhere (%)
Residents speaking Spanish at home - Foreign born (%)
Residents speaking other language at home (%)
Residents speaking other language at home - Born in the United States (%)
Residents speaking other language at home - Native, born elsewhere (%)
Residents speaking other language at home - Foreign born (%)
Class of Workers - Employee of private company (%)
Class of Workers - Self-employed in own incorporated business (%)
Class of Workers - Private not-for-profit wage and salary workers (%)
Class of Workers - Local government workers (%)
Class of Workers - State government workers (%)
Class of Workers - Federal government workers (%)
Class of Workers - Self-employed workers in own not incorporated business and Unpaid family workers (%)
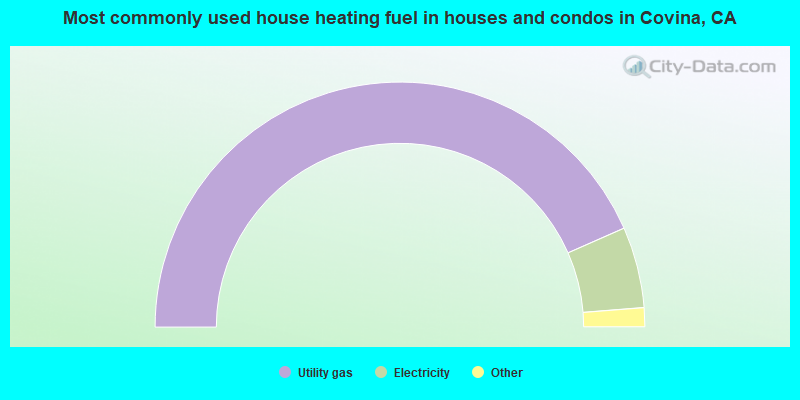
House heating fuel used in houses and condos - Utility gas (%)
House heating fuel used in houses and condos - Bottled, tank, or LP gas (%)
House heating fuel used in houses and condos - Electricity (%)
House heating fuel used in houses and condos - Fuel oil, kerosene, etc. (%)
House heating fuel used in houses and condos - Coal or coke (%)
House heating fuel used in houses and condos - Wood (%)
House heating fuel used in houses and condos - Solar energy (%)
House heating fuel used in houses and condos - Other fuel (%)
House heating fuel used in houses and condos - No fuel used (%)
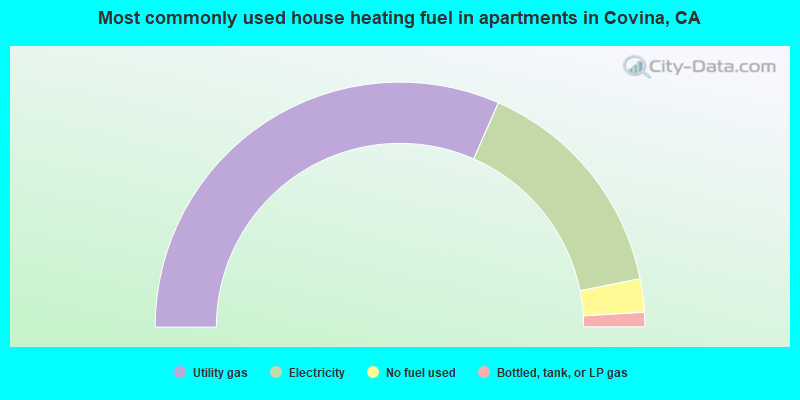
House heating fuel used in apartments - Utility gas (%)
House heating fuel used in apartments - Bottled, tank, or LP gas (%)
House heating fuel used in apartments - Electricity (%)
House heating fuel used in apartments - Fuel oil, kerosene, etc. (%)
House heating fuel used in apartments - Coal or coke (%)
House heating fuel used in apartments - Wood (%)
House heating fuel used in apartments - Solar energy (%)
House heating fuel used in apartments - Other fuel (%)
House heating fuel used in apartments - No fuel used (%)
Armed forces status - In Armed Forces (%)
Armed forces status - Civilian (%)
Armed forces status - Civilian - Veteran (%)
Armed forces status - Civilian - Nonveteran (%)
Fatal accidents locations in years 2005-2021
Fatal accidents locations in 2005
Fatal accidents locations in 2006
Fatal accidents locations in 2007
Fatal accidents locations in 2008
Fatal accidents locations in 2009
Fatal accidents locations in 2010
Fatal accidents locations in 2011
Fatal accidents locations in 2012
Fatal accidents locations in 2013
Fatal accidents locations in 2014
Fatal accidents locations in 2015
Fatal accidents locations in 2016
Fatal accidents locations in 2017
Fatal accidents locations in 2018
Fatal accidents locations in 2019
Fatal accidents locations in 2020
Fatal accidents locations in 2021
Alcohol use - People drinking some alcohol every month (%)
Alcohol use - People not drinking at all (%)
Alcohol use - Average days/month drinking alcohol
Alcohol use - Average drinks/week
Alcohol use - Average days/year people drink much
Audiometry - Average condition of hearing (%)
Audiometry - People that can hear a whisper from across a quiet room (%)
Audiometry - People that can hear normal voice from across a quiet room (%)
Audiometry - Ears ringing, roaring, buzzing (%)
Audiometry - Had a job exposure to loud noise (%)
Audiometry - Had off-work exposure to loud noise (%)
Blood Pressure & Cholesterol - Has high blood pressure (%)
Blood Pressure & Cholesterol - Checking blood pressure at home (%)
Blood Pressure & Cholesterol - Frequently checking blood cholesterol (%)
Blood Pressure & Cholesterol - Has high cholesterol level (%)
Consumer Behavior - Money monthly spent on food at supermarket/grocery store
Consumer Behavior - Money monthly spent on food at other stores
Consumer Behavior - Money monthly spent on eating out
Consumer Behavior - Money monthly spent on carryout/delivered foods
Consumer Behavior - Income spent on food at supermarket/grocery store (%)
Consumer Behavior - Income spent on food at other stores (%)
Consumer Behavior - Income spent on eating out (%)
Consumer Behavior - Income spent on carryout/delivered foods (%)
Current Health Status - General health condition (%)
Current Health Status - Blood donors (%)
Current Health Status - Has blood ever tested for HIV virus (%)
Current Health Status - Left-handed people (%)
Dermatology - People using sunscreen (%)
Diabetes - Diabetics (%)
Diabetes - Had a blood test for high blood sugar (%)
Diabetes - People taking insulin (%)
Diet Behavior & Nutrition - Diet health (%)
Diet Behavior & Nutrition - Milk product consumption (# of products/month)
Diet Behavior & Nutrition - Meals not home prepared (#/week)
Diet Behavior & Nutrition - Meals from fast food or pizza place (#/week)
Diet Behavior & Nutrition - Ready-to-eat foods (#/month)
Diet Behavior & Nutrition - Frozen meals/pizza (#/month)
Drug Use - People that ever used marijuana or hashish (%)
Drug Use - Ever used hard drugs (%)
Drug Use - Ever used any form of cocaine (%)
Drug Use - Ever used heroin (%)
Drug Use - Ever used methamphetamine (%)
Health Insurance - People covered by health insurance (%)
Kidney Conditions-Urology - Avg. # of times urinating at night
Medical Conditions - People with asthma (%)
Medical Conditions - People with anemia (%)
Medical Conditions - People with psoriasis (%)
Medical Conditions - People with overweight (%)
Medical Conditions - Elderly people having difficulties in thinking or remembering (%)
Medical Conditions - People who ever received blood transfusion (%)
Medical Conditions - People having trouble seeing even with glass/contacts (%)
Medical Conditions - People with arthritis (%)
Medical Conditions - People with gout (%)
Medical Conditions - People with congestive heart failure (%)
Medical Conditions - People with coronary heart disease (%)
Medical Conditions - People with angina pectoris (%)
Medical Conditions - People who ever had heart attack (%)
Medical Conditions - People who ever had stroke (%)
Medical Conditions - People with emphysema (%)
Medical Conditions - People with thyroid problem (%)
Medical Conditions - People with chronic bronchitis (%)
Medical Conditions - People with any liver condition (%)
Medical Conditions - People who ever had cancer or malignancy (%)
Mental Health - People who have little interest in doing things (%)
Mental Health - People feeling down, depressed, or hopeless (%)
Mental Health - People who have trouble sleeping or sleeping too much (%)
Mental Health - People feeling tired or having little energy (%)
Mental Health - People with poor appetite or overeating (%)
Mental Health - People feeling bad about themself (%)
Mental Health - People who have trouble concentrating on things (%)
Mental Health - People moving or speaking slowly or too fast (%)
Mental Health - People having thoughts they would be better off dead (%)
Oral Health - Average years since last visit a dentist
Oral Health - People embarrassed because of mouth (%)
Oral Health - People with gum disease (%)
Oral Health - General health of teeth and gums (%)
Oral Health - Average days a week using dental floss/device
Oral Health - Average days a week using mouthwash for dental problem
Oral Health - Average number of teeth
Pesticide Use - Households using pesticides to control insects (%)
Pesticide Use - Households using pesticides to kill weeds (%)
Physical Activity - People doing vigorous-intensity work activities (%)
Physical Activity - People doing moderate-intensity work activities (%)
Physical Activity - People walking or bicycling (%)
Physical Activity - People doing vigorous-intensity recreational activities (%)
Physical Activity - People doing moderate-intensity recreational activities (%)
Physical Activity - Average hours a day doing sedentary activities
Physical Activity - Average hours a day watching TV or videos
Physical Activity - Average hours a day using computer
Physical Functioning - People having limitations keeping them from working (%)
Physical Functioning - People limited in amount of work they can do (%)
Physical Functioning - People that need special equipment to walk (%)
Physical Functioning - People experiencing confusion/memory problems (%)
Physical Functioning - People requiring special healthcare equipment (%)
Prescription Medications - Average number of prescription medicines taking
Preventive Aspirin Use - Adults 40+ taking low-dose aspirin (%)
Reproductive Health - Vaginal deliveries (%)
Reproductive Health - Cesarean deliveries (%)
Reproductive Health - Deliveries resulted in a live birth (%)
Reproductive Health - Pregnancies resulted in a delivery (%)
Reproductive Health - Women breastfeeding newborns (%)
Reproductive Health - Women that had a hysterectomy (%)
Reproductive Health - Women that had both ovaries removed (%)
Reproductive Health - Women that have ever taken birth control pills (%)
Reproductive Health - Women taking birth control pills (%)
Reproductive Health - Women that have ever used Depo-Provera or injectables (%)
Reproductive Health - Women that have ever used female hormones (%)
Sexual Behavior - People 18+ that ever had sex (vaginal, anal, or oral) (%)
Sexual Behavior - Males 18+ that ever had vaginal sex with a woman (%)
Sexual Behavior - Males 18+ that ever performed oral sex on a woman (%)
Sexual Behavior - Males 18+ that ever had anal sex with a woman (%)
Sexual Behavior - Males 18+ that ever had any sex with a man (%)
Sexual Behavior - Females 18+ that ever had vaginal sex with a man (%)
Sexual Behavior - Females 18+ that ever performed oral sex on a man (%)
Sexual Behavior - Females 18+ that ever had anal sex with a man (%)
Sexual Behavior - Females 18+ that ever had any kind of sex with a woman (%)
Sexual Behavior - Average age people first had sex
Sexual Behavior - Average number of female sex partners in lifetime (males 18+)
Sexual Behavior - Average number of female vaginal sex partners in lifetime (males 18+)
Sexual Behavior - Average age people first performed oral sex on a woman (18+)
Sexual Behavior - Average number of woman performed oral sex on in lifetime (18+)
Sexual Behavior - Average number of male sex partners in lifetime (males 18+)
Sexual Behavior - Average number of male anal sex partners in lifetime (males 18+)
Sexual Behavior - Average age people first performed oral sex on a man (18+)
Sexual Behavior - Average number of male oral sex partners in lifetime (18+)
Sexual Behavior - People using protection when performing oral sex (%)
Sexual Behavior - Average number of times people have vaginal or anal sex a year
Sexual Behavior - People having sex without condom (%)
Sexual Behavior - Average number of male sex partners in lifetime (females 18+)
Sexual Behavior - Average number of male vaginal sex partners in lifetime (females 18+)
Sexual Behavior - Average number of female sex partners in lifetime (females 18+)
Sexual Behavior - Circumcised males 18+ (%)
Sleep Disorders - Average hours sleeping at night
Sleep Disorders - People that has trouble sleeping (%)
Smoking-Cigarette Use - People smoking cigarettes (%)
Taste & Smell - People 40+ having problems with smell (%)
Taste & Smell - People 40+ having problems with taste (%)
Taste & Smell - People 40+ that ever had wisdom teeth removed (%)
Taste & Smell - People 40+ that ever had tonsils teeth removed (%)
Taste & Smell - People 40+ that ever had a loss of consciousness because of a head injury (%)
Taste & Smell - People 40+ that ever had a broken nose or other serious injury to face or skull (%)
Taste & Smell - People 40+ that ever had two or more sinus infections (%)
Weight - Average height (inches)
Weight - Average weight (pounds)
Weight - Average BMI
Weight - People that are obese (%)
Weight - People that ever were obese (%)
Weight - People trying to lose weight (%)
30,860 62.2% Hispanic 8,714 17.6% White alone 6,660 13.4% Asian alone 1,574 3.2% Black alone 1,375 2.8% Two or more races 548 1.1% Other race alone 97 0.2% Native Hawaiian and Other 22 0.04% American Indian alone
Officers per 1,000 residents here:
1.14California average:
2.30
Latest news from Covina, CA collected exclusively by city-data.com from local newspapers, TV, and radio stations
Ancestries: English (2.0%), German (1.4%), American (1.1%), Italian (1.1%).
Current Local Time:
Land area: 6.97 square miles.
Population density: 7,104 people per square mile (high).
12,125 residents are foreign born (13.8% Latin America , 9.6% Asia ).
This city:
24.4%California:
26.5%
Median real estate property taxes paid for housing units with mortgages in 2022: $5,297 (0.7%)Median real estate property taxes paid for housing units with no mortgage in 2022: $3,293 (0.5%)
Nearest city with pop. 50,000+: East San Gabriel Valley, CA
Nearest city with pop. 1,000,000+: Los Angeles, CA
Nearest cities:
Latitude: 34.09 N, Longitude: 117.88 W
Daytime population change due to commuting: -2,485 (-5.0%)Workers who live and work in this city: 6,051 (22.8%)
Property values in Covina, CA
Single-family new house construction building permits:
2021: 5 buildings , average cost: $281,7002020: 6 buildings , average cost: $281,7002019: 4 buildings , average cost: $281,7002018: 7 buildings , average cost: $281,7002017: 6 buildings , average cost: $281,7002016: 3 buildings , average cost: $281,7002015: 3 buildings , average cost: $281,7002014: 2 buildings , average cost: $320,0002013: 52 buildings , average cost: $193,2002012: 1 building , cost: $150,0002006: 33 buildings , average cost: $224,2002005: 51 buildings , average cost: $187,7002004: 40 buildings , average cost: $144,0002002: 7 buildings , average cost: $328,0002001: 38 buildings , average cost: $191,0002000: 42 buildings , average cost: $201,0001999: 4 buildings , average cost: $306,4001997: 2 buildings , average cost: $149,400Unemployment in December 2023:
Population change in the 1990s: +3,547 (+8.2%).
Most common occupations in Covina, CA (%)
Both Males Females
Other office and administrative support workers, including supervisors (5.2%)
Other management occupations, except farmers and farm managers (4.3%)
Material recording, scheduling, dispatching, and distributing workers (3.8%)
Other production occupations, including supervisors (3.5%)
Secretaries and administrative assistants (3.5%)
Other sales and related occupations, including supervisors (3.4%)
Electrical equipment mechanics and other installation, maintenance, and repair workers, including supervisors (3.2%)
Electrical equipment mechanics and other installation, maintenance, and repair workers, including supervisors (5.8%)
Driver/sales workers and truck drivers (5.7%)
Other production occupations, including supervisors (5.0%)
Other management occupations, except farmers and farm managers (4.7%)
Material recording, scheduling, dispatching, and distributing workers (4.3%)
Building and grounds cleaning and maintenance occupations (4.1%)
Other sales and related occupations, including supervisors (3.9%)
Other office and administrative support workers, including supervisors (8.8%)
Secretaries and administrative assistants (7.0%)
Preschool, kindergarten, elementary, and middle school teachers (5.1%)
Information and record clerks, except customer service representatives (5.1%)
Other management occupations, except farmers and farm managers (3.9%)
Customer service representatives (3.4%)
Material recording, scheduling, dispatching, and distributing workers (3.3%)
Earthquake activity:
Covina-area historical earthquake activity is significantly above California state average. It is 7207% greater than the overall U.S. average. On 7/21/1952 at 11:52:14, a magnitude 7.7 (7.7 UK, Class: Major, Intensity: VIII - XII) earthquake occurred 89.6 miles away from Covina center, causing $50,000,000 total damage On 6/28/1992 at 11:57:34, a magnitude 7.6 (6.2 MB, 7.6 MS, 7.3 MW, Depth: 0.7 mi) earthquake occurred 77.4 miles away from the city center, causing 3 deaths ( 1 shaking deaths, 2 other deaths) and 400 injuries, causing $100,000,000 total damage and $40,000,000 insured lossesOn 10/16/1999 at 09:46:44, a magnitude 7.4 (6.3 MB, 7.4 MS, 7.2 MW, 7.3 ML) earthquake occurred 87.6 miles away from the city center On 11/4/1927 at 13:51:53, a magnitude 7.5 (7.5 UK) earthquake occurred 188.5 miles away from Covina center On 4/21/1918 at 22:32:30, a magnitude 6.8 (6.8 UK, Class: Strong, Intensity: VII - IX) earthquake occurred 31.8 miles away from Covina center On 6/28/1992 at 15:05:30, a magnitude 6.9 (6.3 MB, 6.7 MS, 6.5 MW, 6.9 ME, Depth: 3.1 mi) earthquake occurred 62.3 miles away from the city center Magnitude types: body-wave magnitude (MB), energy magnitude (ME), local magnitude (ML), surface-wave magnitude (MS), moment magnitude (MW) Natural disasters: The number of natural disasters in Los Angeles County (57) is a lot greater than the US average (15).Major Disasters (Presidential) Declared: 27Emergencies Declared: 3Fires: 37, Floods: 16, Storms: 9, Winter Storms: 6, Landslides: 5, Mudslides: 5, Earthquakes: 3, Freeze: 1, Heavy Rain: 1, Hurricane: 1, Snow: 1, Tornado: 1, Wind: 1, Other: 1 (Note: some incidents may be assigned to more than one category). Main business address for: K-FED BANCORP SAVINGS INSTITUTION, FEDERALLY CHARTERED ).
Hospitals in Covina: CITRUS VALLEY MEDICAL CENTER-IC CAMPUS (Proprietary, provides emergency services, 210 W SAN BERNARDINO ROAD) COVINA HEALTH CARE CENTER (233 E ROWLAND STREET SUITE B) INTERLINK HOSPICE (943 N GRAND AVENUE) STAFF BUILDERS SERVICES (424/426 S GRAND AVENUE) VISITING NURSE ASSOCIATION E SAN GAB (420 SOUTH GRAND) VITAS HEALTHCARE CORP OF CALIFORNIA (598 SOUTH GRAND AVENUE) Nursing Homes in Covina: COVINA REHABILITATION CENTER (261 W. BADILLO STREET) ROYAL CREST HEALTH CARE (519 W. BADILLO ST.) THE ROWLAND (330 W. ROWLAND AVE.) Dialysis Facilities in Covina: CITRUS DIALYSIS CENTER (315 N. THIRD AVENUE, SUITE 104) MOHAN DIALYSIS CENTER OF COVINA (158 W. COLLEGE STREET) Home Health Centers in Covina: ALTA VISTA HEALTH SERVICES (642 SOUTH SECOND AVENUE, SUITE A) AMERICAN EMPIRE HOME HEALTH (538 E SAN BERNARDINO ROAD) COVENANT HOME HEALTH OF CALIFORNIA (750 TERRADO PLAZA DRIVE, #15) ERA HOME HEALTH SERVICES CORPORATION (270 W BADILLO ST) INNOVATIVE SENIOR CARE HOME HEALTH (368 EAST ROWLAND AVENUE) LEGACY HEALTH CARE PROVIDERS INC (1272 E CENTER COURT DR SUITE 203) OPTIMAL HOME CARE, INC (643 S SECOND AVENUE, SUITE A) PRESTIGIOUS HOME HEALTH, INC (1074 PARK VIEW DR, SUITE 103) QUALITY HHC (858 OAK PARK ROAD, SUITE 100) SURE CARE HEALTH CARE SERVICES (1109 W SAN BERNARDINO RD SUITE 200) Amtrak stations near Covina: 8 miles: POMONA (156 W. COMMERCIAL ST.) Services: partially wheelchair accessible, public payphones, free short-term parking, free long-term parking, call for taxi service, public transit connection.
10 miles: CLAREMONT (200 W. 1ST ST.) - Bus Station Services: fully wheelchair accessible, public payphones, full-service food facilities, free short-term parking, free long-term parking, call for car rental service, call for taxi service, public transit connection.
14 miles: ONTARIO (228 S. PLUM ST.) Services: fully wheelchair accessible, public payphones, vending machines, free short-term parking, call for taxi service.
Colleges/universities with over 2000 students nearest to Covina:
Azusa Pacific University (about 3 miles; Azusa, CA ; Full-time enrollment: 9,427)
Citrus College (about 4 miles; Glendora, CA ; FT enrollment: 8,456)
Mt San Antonio College (about 4 miles; Walnut, CA ; FT enrollment: 19,891)
California State Polytechnic University-Pomona (about 5 miles; Pomona, CA ; FT enrollment: 18,141)
DeVry University-California (about 5 miles; Pomona, CA ; FT enrollment: 10,875)
University of La Verne (about 7 miles; La Verne, CA ; FT enrollment: 6,983)
Hacienda La Puente Adult Education (about 8 miles; La Puente, CA ; FT enrollment: 2,750)
Public high schools in Covina: CHARTER OAK HIGH Students: 1,402, Location: 1430 E. COVINA BLVD., Grades: 9-12)NORTHVIEW HIGH Students: 1,096, Location: 1016 W. CYPRESS AVE., Grades: 9-12)COVINA HIGH Students: 1,087, Location: 463 S. HOLLENBECK AVE., Grades: 9-12)FAIRVALLEY HIGH (CONTINUATION) Students: 56, Location: 231 E. STEPHANIE DR., Grades: 9-12)GLADSTONE HIGH Location: 1340 N. ENID, Grades: 9-12)
Private high school in Covina: QUEST ACADEMY Students: 37, Location: 821 N KIDDER AVE, Grades: 4-12)
Biggest public elementary/middle schools in Covina: LAS PALMAS MIDDLE Students: 1,123, Location: 641 N. LARK ELLEN AVE., Grades: 6-8)SIERRA VISTA MIDDLE Students: 1,105, Location: 777 E. PUENTE ST., Grades: 6-8)ROYAL OAK MIDDLE Students: 905, Location: 303 S. GLENDORA AVE., Grades: 7-8)CEDARGROVE ELEMENTARY Students: 676, Location: 1209 N. GLENDORA AVE., Grades: KG-6)BADILLO ELEMENTARY Students: 423, Location: 1771 E. OLD BADILLO AVE., Grades: KG-6)CYPRESS ELEMENTARY Students: 376, Location: 351 W. CYPRESS AVE., Grades: KG-5)GLEN OAK ELEMENTARY Students: 359, Location: 1000 N. SUNFLOWER AVE, Grades: KG-6)BARRANCA ELEMENTARY Students: 359, Location: 727 S. BARRANCA AVE., Grades: KG-5)LARK ELLEN ELEMENTARY Students: 273, Location: 4555 N. LARK ELLEN AVE., Grades: KG-5)BEN LOMOND ELEMENTARY Students: 263, Location: 621 E. COVINA BLVD., Grades: KG-5)Private elementary/middle schools in Covina: SONRISE CHRISTIAN SCHOOL Students: 511, Location: 1220 E RUDDOCK ST, Grades: PK-8)
ST LOUISE DE MARILLAC SCHOOL Students: 309, Location: 1728 E COVINA BLVD, Grades: KG-8)
SACRED HEART ELEMENTARY Students: 289, Location: 360 W WORKMAN ST, Grades: KG-8)
KINDERGARTEN RANCH SCHOOL Students: 7, Location: 20505 E COVINA HILLS RD, Grades: PK-2)
See full list of schools located in Covina Library in Covina: COVINA PUBLIC LIBRARY Operating income: $1,342,950; Location: 234 N. SECOND AVE.; 96,213 books ; 4,606 audio materials ; 3,887 video materials ; 13 local licensed databases ; 1 state licensed databases ; 166 print serial subscriptions )
Notable locations in Covina: (A) , Covina City Hall (B) , Masonic Home for Children (C) , Los Angeles County Fire Department Station 154 (D) , Los Angeles County Fire Department Station 153 (E) , Los Angeles County Fire Department Station 152 (F) . Display/hide their locations on the map
Shopping Centers: (1) , Covina Town Square Shopping Center (2) , Covina Square Shopping Center (3) , Berkeley Square Shopping Center (4) . Display/hide their locations on the map
Main business address in Covina: (A) . Display/hide its location on the map
Churches in Covina include: (A) , Unity Church of the Foothills (B) , Covina Assembly of God Church (C) , First Baptist Church (D) , First Church of Christ Scientist (E) , First Presbyterian Church of Covina (F) , Holy Trinity Episcopal Church (G) , Sacred Heart Catholic Church (H) , Saint John Lutheran Church (I) . Display/hide their locations on the map
Parks in Covina include: (1) , Parque Xalapa (2) , Wingate Park (3) , Barranca Park (4) , City Park (5) , Covina Park (6) , Cypress Park (7) , Edna Park (8) , Kelby Park (9) . Display/hide their locations on the map
Tourist attractions:
Courts:
Birthplace of: Troy Aikman - College football player, Michael Young (baseball) - Baseball player, Brian Russell - Football player, Chris Woodward - 2005 Major League Baseball player (New York Mets, born : Jun 27, 1976), Corey Nakatani - Jockey, Donald W. Evans, Jr. - Army Medal of Honor recipient, Gaius Shaver - College football player, Gary Roenicke - Baseball player, Jason David - 2005 NFL player (Indianapolis Colts, born : Jun 12, 1982), John Molina, Jr. - Boxer.
Los Angeles County has a predicted average indoor radon screening level between 2 and 4 pCi/L (pico curies per liter) - Moderate Potential Drinking water stations with addresses in Covina and their reported violations in the past:
JUBILEE SCOUT RANCH (Population served: 25, Groundwater):
Past monitoring violations:
One routine major monitoring violation
Average household size: This city:
3.0 peopleCalifornia:
2.9 people
Percentage of family households: This city:
74.5%Whole state:
68.7%
Percentage of households with unmarried partners: This city:
6.8%Whole state:
7.2%
Likely homosexual households (counted as self-reported same-sex unmarried-partner households)
Lesbian couples: 0.4% of all households Gay men: 0.2% of all households
People in group quarters in Covina in 2010:
341 people in nursing facilities/skilled-nursing facilities
55 people in group homes intended for adults
26 people in group homes for juveniles (non-correctional)
7 people in other noninstitutional facilities
6 people in workers' group living quarters and job corps centers
People in group quarters in Covina in 2000:
247 people in nursing homes
117 people in other noninstitutional group quarters
77 people in other group homes
73 people in homes or halfway houses for drug/alcohol abuse
48 people in homes for the mentally retarded
30 people in homes for abused, dependent, and neglected children
8 people in religious group quarters
2 people in local jails and other confinement facilities (including police lockups)
Banks with most branches in Covina (2011 data):
Wells Fargo Bank, National Association: Covina Main Branch, Covina Branch, Azusa & Cypress Branch. Info updated 2011/04/05: Bank assets: $1,161,490.0 mil, Deposits: $905,653.0 mil, headquarters in Sioux Falls, SD, positive income , 6395 total offices , Holding Company: Wells Fargo & Company
California Bank & Trust: Covina Branch at 576 South Grand Avenue, branch established on 2001/07/23. Info updated 2009/07/20: Bank assets: $10,894.1 mil, Deposits: $9,193.9 mil, headquarters in San Diego, CA, positive income , Commercial Lending Specialization, 109 total offices , Holding Company: Zions Bancorporation
Bank of the West: Covina Branch at 770 South Citrus Avenue, branch established on 1956/12/14. Info updated 2009/11/16: Bank assets: $62,408.3 mil, Deposits: $43,995.2 mil, headquarters in San Francisco, CA, positive income , 647 total offices , Holding Company: Bnp Paribas
Kaiser Federal Bank: at 1359 N. Grand Avenue, branch established on 1953/11/11. Info updated 2011/07/21: Bank assets: $931.9 mil, Deposits: $697.1 mil, local headquarters , positive income , Commercial Lending Specialization, 9 total offices
JPMorgan Chase Bank, National Association: Covina Arrow Branch at 1453 N Azusa Ave, branch established on 2008/09/29. Info updated 2011/11/10: Bank assets: $1,811,678.0 mil, Deposits: $1,190,738.0 mil, headquarters in Columbus, OH, positive income , International Specialization, 5577 total offices , Holding Company: Jpmorgan Chase & Co.
Community Bank: West Badillo Street Branch at 1041 West Badillo Street, 2nd Floor, branch established on 1996/11/12. Info updated 2010/02/16: Bank assets: $2,601.3 mil, Deposits: $1,941.4 mil, headquarters in Pasadena, CA, positive income , Commercial Lending Specialization, 17 total offices
Citizens Business Bank: Covina Branch at 973 East Badillo Street, branch established on 1983/09/30. Info updated 2011/03/30: Bank assets: $6,475.4 mil, Deposits: $4,625.6 mil, headquarters in Ontario, CA, positive income , Commercial Lending Specialization, 46 total offices , Holding Company: Cvb Financial Corp.
OneWest Bank, FSB: Covina Branch at 144 North Second Ave, branch established on 1992/01/01. Info updated 2011/07/21: Bank assets: $26,181.3 mil, Deposits: $15,408.4 mil, headquarters in Pasadena, CA, positive income , 79 total offices
AltaPacific Bank: Covina Branch at 100 North Azusa Avenue, branch established on 2007/04/09. Info updated 2012/02/28: Bank assets: $115.2 mil, Deposits: $76.6 mil, headquarters in Santa Rosa, CA, positive income , Commercial Lending Specialization, 3 total offices , Holding Company: Altapacific Bancorp
2 other banks with 2 local branches
For population 15 years and over in Covina:
Never married: 38.6%Now married: 45.1%Separated: 2.1%Widowed: 4.5%Divorced: 9.7% For population 25 years and over in Covina:
High school or higher: 87.1%Bachelor's degree or higher: 26.2%Graduate or professional degree: 8.0%Unemployed: 3.3%Mean travel time to work (commute): 26.6 minutes
Education Gini index (Inequality in education) Here:
12.4California average:
15.5
Religion statistics for Covina, CA (based on Los Angeles County data)
Religion Adherents Congregations Catholic 3,542,994 275 Evangelical Protestant 814,611 3,249 Other 451,594 1,023 Mainline Protestant 229,056 860 Black Protestant 112,338 290 Orthodox 63,517 76 None 4,604,495 -
Source: Clifford Grammich, Kirk Hadaway, Richard Houseal, Dale E.Jones, Alexei Krindatch, Richie Stanley and Richard H.Taylor. 2012. 2010 U.S.Religion Census: Religious Congregations & Membership Study. Association of Statisticians of American Religious Bodies. Jones, Dale E., et al. 2002. Congregations and Membership in the United States 2000. Nashville, TN: Glenmary Research Center. Graphs represent county-level data
Food Environment Statistics: Number of grocery stores : 2,084This county :
2.12 / 10,000 pop.California :
2.14 / 10,000 pop.
Number of supercenters and club stores : 32This county :
0.03 / 10,000 pop.State :
0.04 / 10,000 pop.
Number of convenience stores (no gas) : 567Here :
0.58 / 10,000 pop.State :
0.62 / 10,000 pop.
Number of convenience stores (with gas) : 1,206Los Angeles County :
1.23 / 10,000 pop.State :
1.49 / 10,000 pop.
Number of full-service restaurants : 7,008Los Angeles County :
7.15 / 10,000 pop.California :
7.42 / 10,000 pop.
Adult diabetes rate : This county :
7.5%State :
7.3%
Adult obesity rate : Los Angeles County :
20.4%California :
21.3%
Low-income preschool obesity rate : This county :
18.6%State :
17.9%
Health and Nutrition: Healthy diet rate : This city:
49.8%California:
49.4%
Average overall health of teeth and gums : Average BMI : Covina:
28.2California:
28.1
People feeling badly about themselves : People not drinking alcohol at all : This city:
11.7%California:
11.2%
Average hours sleeping at night : Overweight people : This city:
32.6%State:
31.5%
General health condition : Covina:
56.5%California:
56.4%
Average condition of hearing : This city:
81.2%State:
80.9%
More about Health and Nutrition of Covina, CA Residents
Local government employment and payroll (March 2022)
Function
Full-time employees
Monthly full-time payroll
Average yearly full-time wage
Part-time employees
Monthly part-time payroll
Police Protection - Officers
56 $795,837 $170,537 1 $428 Police - Other
27 $202,721 $90,098 9 $26,613 Other Government Administration
19 $103,946 $65,650 2 $3,238 Parks and Recreation
13 $87,452 $80,725 17 $13,856 Water Supply
12 $77,720 $77,720 0 $0 Financial Administration
11 $79,718 $86,965 4 $5,363 Other and Unallocable
9 $67,775 $90,367 3 $6,367 Housing and Community Development (Local)
8 $109,710 $164,565 0 $0 Streets and Highways
7 $63,683 $109,171 4 $6,686 Sewerage
6 $43,007 $86,014 0 $0 Local Libraries
3 $20,873 $83,492 9 $16,190 Health
2 $18,196 $109,176 0 $0
Totals for Government
173 $1,670,636 $115,882 49 $78,741
Covina government finances - Expenditure in 2017 (per resident):
Construction - Housing and Community Development: $2,921,000 ($59.02)
Water Utilities: $1,678,000 ($33.91)Regular Highways: $1,335,000 ($26.98)Sewerage: $148,000 ($2.99)Current Operations - Police Protection: $15,825,000 ($319.77)
Local Fire Protection: $8,958,000 ($181.01)Water Utilities: $7,239,000 ($146.27)Parks and Recreation: $3,153,000 ($63.71)Regular Highways: $3,038,000 ($61.39)Financial Administration: $1,868,000 ($37.75)Central Staff Services: $1,092,000 ($22.07)Housing and Community Development: $1,030,000 ($20.81)Protective Inspection and Regulation - Other: $964,000 ($19.48)Transit Utilities: $957,000 ($19.34)Solid Waste Management: $845,000 ($17.07)Libraries: $720,000 ($14.55)Sewerage: $661,000 ($13.36)Parking Facilities: $131,000 ($2.65)Health - Other: $120,000 ($2.42)General - Interest on Debt: $1,889,000 ($38.17)
Other Capital Outlay - General - Other: $2,314,000 ($46.76)
Water Utilities: $311,000 ($6.28)Sewerage: $251,000 ($5.07)Water Utilities - Interest on Debt: $873,000 ($17.64)
Covina government finances - Revenue in 2017 (per resident):
Charges - Other: $3,905,000 ($78.91)
Sewerage: $2,761,000 ($55.79)Solid Waste Management: $1,313,000 ($26.53)Parks and Recreation: $752,000 ($15.20)Regular Highways: $128,000 ($2.59)Housing and Community Development: $96,000 ($1.94)Parking Facilities: $72,000 ($1.45)Federal Intergovernmental - Housing and Community Development: $114,000 ($2.30)
Other: $9,000 ($0.18)Local Intergovernmental - Other: $148,000 ($2.99)
Miscellaneous - Interest Earnings: $8,039,000 ($162.44)
Fines and Forfeits: $924,000 ($18.67)Donations From Private Sources: $363,000 ($7.33)General Revenue - Other: $146,000 ($2.95)Rents: $52,000 ($1.05)Special Assessments: $43,000 ($0.87)Revenue - Water Utilities: $10,701,000 ($216.23)
Transit Utilities: $209,000 ($4.22)State Intergovernmental - Highways: $932,000 ($18.83)
Other: $870,000 ($17.58)General Local Government Support: $59,000 ($1.19)Tax - General Sales and Gross Receipts: $11,534,000 ($233.06)
Property: $11,489,000 ($232.15)Public Utilities Sales: $6,139,000 ($124.05)Other License: $949,000 ($19.18)Other Selective Sales: $654,000 ($13.22)Occupation and Business License - Other: $336,000 ($6.79)Documentary and Stock Transfer: $200,000 ($4.04)Other: $63,000 ($1.27)
Covina government finances - Debt in 2017 (per resident):
Long Term Debt - Beginning Outstanding - Unspecified Public Purpose: $56,332,000 ($1138.27)
Outstanding Unspecified Public Purpose: $54,066,000 ($1092.49)Beginning Outstanding - Public Debt for Private Purpose: $10,693,000 ($216.07)Outstanding Nonguaranteed - Industrial Revenue: $10,390,000 ($209.95)Retired Unspecified Public Purpose: $2,266,000 ($45.79)Retired Nonguaranteed - Public Debt for Private Purpose: $303,000 ($6.12)
Covina government finances - Cash and Securities in 2017 (per resident):
Bond Funds - Cash and Securities: $3,735,000 ($75.47)
Other Funds - Cash and Securities: $73,674,000 ($1488.69)
Sinking Funds - Cash and Securities: $10,390,000 ($209.95)
2.98% of this county's 2021 resident taxpayers lived in other counties in 2020 ($81,235 average adjusted gross income )
Here:
2.98%California average:
5.19%
0.01% of residents moved from foreign countries ($155 average AGI )Los Angeles County:
0.01%California average:
0.03%
Top counties from which taxpayers relocated into this county between 2020 and 2021:
4.68% of this county's 2020 resident taxpayers moved to other counties in 2021 ($97,324 average adjusted gross income )
Here:
4.68%California average:
6.14%
0.01% of residents moved to foreign countries ($196 average AGI )Los Angeles County:
0.01%California average:
0.02%
Top counties to which taxpayers relocated from this county between 2020 and 2021:
Businesses in Covina, CA
Name Count Name Count
7-Eleven 7 Lowe's 1 99 Cents Only Stores 2 MasterBrand Cabinets 1 Albertsons 1 McDonald's 3 Arby's 1 New Balance 1 AutoZone 2 Nike 4 Baskin-Robbins 2 Outback 1 Brunswick Bowling & Billiards 1 Outback Steakhouse 1 Burger King 1 Panda Express 1 CVS 1 Payless 1 Carl\s Jr. 1 Penske 1 Chuck E. Cheese's 1 PetSmart 1 Circle K 1 Pizza Hut 2 Cold Stone Creamery 1 Popeyes 1 Curves 1 RadioShack 2 DHL 1 Rite Aid 1 Domino's Pizza 1 Safeway 1 El Pollo Loco 2 Sears 3 FedEx 8 Staples 1 GNC 2 Starbucks 3 GameStop 2 Subway 4 H&R Block 2 Taco Bell 2 Home Depot 1 Toys"R"Us 1 HomeTown Buffet 1 U-Haul 4 IHOP 1 UPS 11 IKEA 1 Volkswagen 1 Jack In The Box 3 Vons 1 Jones New York 1 Walgreens 2 KFC 2 Walmart 1 Kmart 1 Wendy's 1 Lane Furniture 1 YMCA 1 Little Caesars Pizza 2
Strongest AM radio stations in Covina:
KLAC (570 AM; 50 kW; LOS ANGELES, CA; Owner: AMFM RADIO LICENSES, L.L.C.)
KTNQ (1020 AM; 50 kW; LOS ANGELES, CA; Owner: KTNQ-AM LICENSE CORP.)
KDIS (1110 AM; 50 kW; PASADENA, CA; Owner: ABC,INC.)
KXTA (1150 AM; 50 kW; LOS ANGELES, CA; Owner: CITICASTERS LICENSES, L.P.)
KFI (640 AM; 50 kW; LOS ANGELES, CA; Owner: CAPSTAR TX LIMITED PARTNERSHIP)
KALI (900 AM; 6 kW; WEST COVINA, CA; Owner: MULTICULTURAL RADIO BROADCASTING, INC.)
KPLS (830 AM; 50 kW; ORANGE, CA; Owner: CRN LICENSES, LLC)
KFWB (980 AM; 50 kW; LOS ANGELES, CA; Owner: INFINITY BROADCASTING OPERATIONS, INC.)
KMPC (1540 AM; 50 kW; LOS ANGELES, CA; Owner: ROSE CITY RADIO CORPORATION)
KSPN (710 AM; 50 kW; LOS ANGELES, CA; Owner: KABC-AM RADIO, INC.)
KBLA (1580 AM; 50 kW; SANTA MONICA, CA)
KXMX (1190 AM; 25 kW; ANAHEIM, CA; Owner: NEW INSPIRATION BROADCASTING COMPANY)
KRLA (870 AM; 20 kW; GLENDALE, CA; Owner: NEW INSPIRATION BROADCASTING COMPANY)
Strongest FM radio stations in Covina:
KCBS-FM (93.1 FM; LOS ANGELES, CA; Owner: INFINITY BROADCASTING OPERATIONS, INC.)
KSCA (101.9 FM; GLENDALE, CA; Owner: HBC LICENSE CORPORATION)
KOST (103.5 FM; LOS ANGELES, CA; Owner: CAPSTAR TX LIMITED PARTNERSHIP)
KLOS (95.5 FM; LOS ANGELES, CA; Owner: KLOS-FM RADIO, INC.)
K212FA (90.3 FM; TEMPLE CITY, CA; Owner: EDUCATIONAL MEDIA FOUNDATION)
KRCV (98.3 FM; WEST COVINA, CA; Owner: HBC LICENSE CORPORATION)
KIIS-FM (102.7 FM; LOS ANGELES, CA; Owner: CITICASTERS LICENSES, L.P.)
KLVE (107.5 FM; LOS ANGELES, CA; Owner: KLVE-FM LICENSE CORP.)
KPCC (89.3 FM; PASADENA, CA; Owner: PASADENA AREA COMMUNITY COLLEGE DISTRICT)
KHHT (92.3 FM; LOS ANGELES, CA; Owner: AMFM RADIO LICENSES, L.L.C.)
KBIG-FM (104.3 FM; LOS ANGELES, CA; Owner: AMFM RADIO LICENSES, L.L.C.)
KTWV (94.7 FM; LOS ANGELES, CA; Owner: INFINITY BROADCASTING OPERATIONS, INC.)
KSAK (90.1 FM; WALNUT, CA; Owner: MT. SAN ANTONIO COMM. COLLEGE DIST.)
KMZT-FM (105.1 FM; LOS ANGELES, CA; Owner: MOUNT WILSON FM BROADCASTERS, INC.)
KPFK (90.7 FM; LOS ANGELES, CA; Owner: PACIFICA FOUNDATION, INC)
K216EM (91.1 FM; ARCADIA, CA; Owner: LIFE ON THE WAY COMMUNICATIONS, INC.)
K264AF (100.7 FM; GUASTI, CA; Owner: EDUCATIONAL MEDIA FOUNDATION)
KZLA-FM (93.9 FM; LOS ANGELES, CA; Owner: EMMIS RADIO LICENSE CORPORATION)
KPWR (105.9 FM; LOS ANGELES, CA; Owner: EMMIS RADIO LICENSE CORPORATION)
KLSX (97.1 FM; LOS ANGELES, CA; Owner: INFINITY BROADCASTING OPERATIONS, INC.)
TV broadcast stations around Covina:
KCBS-TV (Channel 2; LOS ANGELES, CA; Owner: CBS BROADCASTING INC.)
KTRO-LP (Channel 50; LANCASTER, CA; Owner: ROBERT D. ADELMAN)
KTLA-TV (Channel 5; LOS ANGELES, CA; Owner: KTLA INC.)
KABC-TV (Channel 7; LOS ANGELES, CA; Owner: ABC HOLDING COMPANY, INC.)
KNBC (Channel 4; LOS ANGELES, CA; Owner: NBC SUBSIDIARY (KNBC-TV), INC.)
KCAL-TV (Channel 9; LOS ANGELES, CA; Owner: VIACOM TELEVISION STATIONS GROUP OF LOS ANGELES LLC)
KHIZ (Channel 64; BARSTOW, CA; Owner: SUNBELT TELEVISION, INC.)
KMEX-TV (Channel 34; LOS ANGELES, CA; Owner: KMEX LICENSE PARTNERSHIP, G.P.)
KAZA-TV (Channel 54; AVALON, CA; Owner: PAPPAS SOUTHERN CALIFORNIA LICENSE LLC)
KSCI (Channel 18; LONG BEACH, CA; Owner: KSLS, INC.)
KDOC-TV (Channel 56; ANAHEIM, CA; Owner: GOLDEN ORANGE BROADCASTING CO., INC.)
KOCE-TV (Channel 50; HUNTINGTON BEACH, CA; Owner: BD. OF TRUSTEES, COAST COMMUNITY COLLEGE DIST.)
KCET (Channel 28; LOS ANGELES, CA; Owner: COMMUNITY TELEVISION OF SOUTHERN CALIFORNIA)
KXLA (Channel 44; RANCHO PALOS VERDES, CA; Owner: RANCHO PALOS VERDES BROADCASTERS, INC.)
KFTR (Channel 46; ONTARIO, CA; Owner: TELEFUTURA LOS ANGELES LLC)
KTTV (Channel 11; LOS ANGELES, CA; Owner: FOX TELEVISION STATIONS, INC.)
KWHY-TV (Channel 22; LOS ANGELES, CA; Owner: TELEMUNDO OF LOS ANGELES LICENSE CORPORATION)
KVEA (Channel 52; CORONA, CA; Owner: ESTRELLA LICENSE CORPORATION)
KRCA (Channel 62; RIVERSIDE, CA; Owner: KRCA LICENSE CORP.)
KCOP-TV (Channel 13; LOS ANGELES, CA; Owner: FOX TELEVISION STATIONS, INC.)
KPXN (Channel 30; SAN BERNARDINO, CA; Owner: PAXSON LOS ANGELES LICENSE, INC.)
KTBN-TV (Channel 40; SANTA ANA, CA; Owner: TRINITY BROADCASTING NETWORK, INC.)
KLCS (Channel 58; LOS ANGELES, CA; Owner: LOS ANGELES UNIFIED SCHOOL DISTRICT)
KSFV-LP (Channel 26; SAN FERNANDO VALLEY, CA; Owner: VENTURE TECHNOLOGIES GROUP, LLC)
KHTV-LP (Channel 48; INLAND EMPIRE, CA; Owner: VENTURE TECHNOLOGIES GROUP, LLC)
Medal of Honor Recipients
Medal of Honor Recipient born in Covina: Donald W., Jr. Evans.
National Bridge Inventory (NBI) Statistics 17 Number of bridges125ft / 38.1m Total length308,080 Total average daily traffic7,085 Total average daily truck traffic365,287 Total future (year 2039) average daily traffic
New bridges - historical statistics
1 1930-1939 1 1940-1949 6 1950-1959 8 1960-1969 1 1980-1989
See full National Bridge Inventory statistics for Covina, CA
Home Mortgage Disclosure Act Aggregated Statistics For Year 2009(Based on 6 full and 8 partial tracts) A) FHA, FSA/RHS & VA B) Conventional C) Refinancings D) Home Improvement Loans E) Loans on Dwellings For 5+ Families F) Non-occupant Loans on G) Loans On Manufactured Number Average Value Number Average Value Number Average Value Number Average Value Number Average Value Number Average Value Number Average Value
LOANS ORIGINATED 168 $308,566 156 $249,996 638 $258,580 44 $162,970 4 $886,250 51 $213,925 3 $164,270 APPLICATIONS APPROVED, NOT ACCEPTED 12 $326,598 22 $286,540 93 $284,839 13 $38,497 0 $0 7 $212,323 3 $50,543 APPLICATIONS DENIED 41 $306,920 33 $241,176 256 $290,500 22 $95,497 0 $0 26 $211,271 4 $45,365 APPLICATIONS WITHDRAWN 29 $314,484 38 $240,730 206 $280,106 9 $170,637 0 $0 17 $233,972 0 $0 FILES CLOSED FOR INCOMPLETENESS 8 $314,380 9 $269,943 48 $286,094 2 $272,025 0 $0 9 $252,484 0 $0
Aggregated Statistics For Year 2008(Based on 6 full and 8 partial tracts) A) FHA, FSA/RHS & VA B) Conventional C) Refinancings D) Home Improvement Loans E) Loans on Dwellings For 5+ Families F) Non-occupant Loans on G) Loans On Manufactured Number Average Value Number Average Value Number Average Value Number Average Value Number Average Value Number Average Value Number Average Value
LOANS ORIGINATED 94 $349,136 184 $288,584 446 $279,514 64 $139,989 10 $573,752 46 $267,892 6 $50,962 APPLICATIONS APPROVED, NOT ACCEPTED 8 $345,689 47 $267,476 125 $289,875 17 $109,734 0 $0 14 $263,782 14 $75,920 APPLICATIONS DENIED 11 $363,154 76 $299,739 371 $321,736 73 $84,432 3 $341,667 37 $268,291 14 $82,365 APPLICATIONS WITHDRAWN 12 $377,906 58 $259,255 159 $290,795 29 $137,508 1 $300,000 12 $226,961 2 $81,590 FILES CLOSED FOR INCOMPLETENESS 4 $346,385 14 $326,308 48 $343,665 7 $208,729 0 $0 5 $285,940 0 $0
Aggregated Statistics For Year 2007(Based on 6 full and 8 partial tracts) A) FHA, FSA/RHS & VA B) Conventional C) Refinancings D) Home Improvement Loans E) Loans on Dwellings For 5+ Families F) Non-occupant Loans on G) Loans On Manufactured Number Average Value Number Average Value Number Average Value Number Average Value Number Average Value Number Average Value Number Average Value
LOANS ORIGINATED 2 $350,010 404 $305,041 1,023 $310,250 146 $203,870 23 $1,839,566 91 $314,666 9 $57,138 APPLICATIONS APPROVED, NOT ACCEPTED 0 $0 127 $294,953 266 $323,607 38 $208,396 0 $0 17 $312,261 16 $61,389 APPLICATIONS DENIED 1 $371,800 194 $316,996 756 $327,763 137 $197,700 1 $150,000 54 $345,726 16 $79,976 APPLICATIONS WITHDRAWN 0 $0 109 $301,376 307 $325,167 52 $201,244 2 $347,500 25 $310,244 3 $56,510 FILES CLOSED FOR INCOMPLETENESS 0 $0 35 $350,476 102 $352,249 8 $236,356 1 $1,500,000 7 $338,291 0 $0
Aggregated Statistics For Year 2006(Based on 6 full and 8 partial tracts) A) FHA, FSA/RHS & VA B) Conventional C) Refinancings D) Home Improvement Loans E) Loans on Dwellings For 5+ Families F) Non-occupant Loans on G) Loans On Manufactured Number Average Value Number Average Value Number Average Value Number Average Value Number Average Value Number Average Value Number Average Value
LOANS ORIGINATED 0 $0 729 $291,155 1,520 $307,234 237 $192,190 17 $1,388,669 123 $334,591 10 $63,318 APPLICATIONS APPROVED, NOT ACCEPTED 0 $0 136 $264,518 327 $331,598 45 $182,661 0 $0 24 $303,564 11 $53,192 APPLICATIONS DENIED 0 $0 289 $291,750 724 $324,144 187 $167,837 2 $450,000 51 $285,305 16 $64,202 APPLICATIONS WITHDRAWN 0 $0 135 $291,663 551 $325,225 68 $201,276 0 $0 35 $274,136 1 $58,650 FILES CLOSED FOR INCOMPLETENESS 1 $153,290 27 $275,585 98 $329,969 16 $271,528 0 $0 5 $259,444 0 $0
Aggregated Statistics For Year 2005(Based on 6 full and 8 partial tracts) A) FHA, FSA/RHS & VA B) Conventional C) Refinancings D) Home Improvement Loans E) Loans on Dwellings For 5+ Families F) Non-occupant Loans on G) Loans On Manufactured Number Average Value Number Average Value Number Average Value Number Average Value Number Average Value Number Average Value Number Average Value
LOANS ORIGINATED 2 $233,965 887 $275,510 1,820 $283,869 298 $172,920 20 $1,976,372 185 $272,545 12 $81,167 APPLICATIONS APPROVED, NOT ACCEPTED 0 $0 201 $243,589 324 $266,383 51 $157,593 1 $7,820,830 33 $296,552 21 $69,049 APPLICATIONS DENIED 1 $433,110 297 $282,422 740 $297,244 156 $145,656 2 $483,000 67 $289,416 34 $140,900 APPLICATIONS WITHDRAWN 0 $0 221 $267,718 568 $278,020 102 $186,641 0 $0 42 $292,800 6 $58,283 FILES CLOSED FOR INCOMPLETENESS 0 $0 42 $298,069 196 $289,231 11 $203,095 0 $0 10 $335,214 0 $0
Aggregated Statistics For Year 2004(Based on 6 full and 8 partial tracts) A) FHA, FSA/RHS & VA B) Conventional C) Refinancings D) Home Improvement Loans E) Loans on Dwellings For 5+ Families F) Non-occupant Loans on G) Loans On Manufactured Number Average Value Number Average Value Number Average Value Number Average Value Number Average Value Number Average Value Number Average Value
LOANS ORIGINATED 4 $283,168 879 $230,721 2,062 $236,374 291 $153,004 25 $1,094,721 166 $225,989 12 $54,172 APPLICATIONS APPROVED, NOT ACCEPTED 1 $171,900 169 $243,525 389 $229,656 38 $136,323 1 $407,000 28 $226,589 5 $54,124 APPLICATIONS DENIED 1 $52,220 198 $247,884 691 $239,140 145 $113,672 2 $725,530 37 $246,294 9 $45,460 APPLICATIONS WITHDRAWN 2 $258,835 128 $247,854 611 $229,110 74 $164,671 2 $4,012,455 25 $257,380 1 $56,400 FILES CLOSED FOR INCOMPLETENESS 1 $179,930 39 $227,045 240 $244,446 27 $129,147 0 $0 10 $201,841 0 $0
Aggregated Statistics For Year 2003(Based on 6 full and 8 partial tracts) A) FHA, FSA/RHS & VA B) Conventional C) Refinancings D) Home Improvement Loans E) Loans on Dwellings For 5+ Families F) Non-occupant Loans on Number Average Value Number Average Value Number Average Value Number Average Value Number Average Value Number Average Value
LOANS ORIGINATED 64 $226,619 760 $190,016 3,477 $186,955 104 $65,032 20 $1,643,210 192 $173,910 APPLICATIONS APPROVED, NOT ACCEPTED 4 $222,830 142 $186,281 499 $183,941 31 $54,956 0 $0 47 $189,541 APPLICATIONS DENIED 1 $264,620 168 $165,949 782 $194,390 77 $41,286 1 $1,400,100 56 $173,511 APPLICATIONS WITHDRAWN 8 $221,891 99 $202,822 900 $195,195 34 $51,959 1 $345,000 26 $155,292 FILES CLOSED FOR INCOMPLETENESS 3 $183,753 44 $229,417 183 $203,385 9 $46,107 2 $767,600 9 $141,161
Aggregated Statistics For Year 2002(Based on 5 full and 7 partial tracts) A) FHA, FSA/RHS & VA B) Conventional C) Refinancings D) Home Improvement Loans E) Loans on Dwellings For 5+ Families F) Non-occupant Loans on Number Average Value Number Average Value Number Average Value Number Average Value Number Average Value Number Average Value
LOANS ORIGINATED 103 $202,415 555 $168,079 1,849 $169,549 59 $37,598 28 $718,702 121 $158,327 APPLICATIONS APPROVED, NOT ACCEPTED 11 $187,772 82 $181,536 292 $160,936 25 $29,041 0 $0 21 $177,835 APPLICATIONS DENIED 8 $175,838 139 $147,404 476 $166,020 67 $30,568 1 $900,000 24 $165,168 APPLICATIONS WITHDRAWN 28 $187,921 93 $146,385 495 $178,725 33 $57,796 1 $563,000 21 $166,420 FILES CLOSED FOR INCOMPLETENESS 7 $188,763 35 $157,145 179 $177,935 1 $31,180 0 $0 12 $156,993
Aggregated Statistics For Year 2001(Based on 5 full and 7 partial tracts) A) FHA, FSA/RHS & VA B) Conventional C) Refinancings D) Home Improvement Loans E) Loans on Dwellings For 5+ Families F) Non-occupant Loans on Number Average Value Number Average Value Number Average Value Number Average Value Number Average Value Number Average Value
LOANS ORIGINATED 175 $186,496 472 $152,341 1,329 $151,846 59 $33,513 10 $696,186 104 $142,223 APPLICATIONS APPROVED, NOT ACCEPTED 14 $170,279 52 $151,600 207 $146,685 24 $32,011 0 $0 12 $150,825 APPLICATIONS DENIED 21 $180,980 109 $126,968 505 $139,230 74 $29,547 1 $674,970 21 $121,162 APPLICATIONS WITHDRAWN 24 $199,421 65 $144,512 428 $154,441 40 $41,146 0 $0 22 $123,897 FILES CLOSED FOR INCOMPLETENESS 3 $182,963 16 $159,578 123 $154,405 4 $30,148 1 $525,000 4 $195,450
Aggregated Statistics For Year 2000(Based on 5 full and 7 partial tracts) A) FHA, FSA/RHS & VA B) Conventional C) Refinancings D) Home Improvement Loans E) Loans on Dwellings For 5+ Families F) Non-occupant Loans on Number Average Value Number Average Value Number Average Value Number Average Value Number Average Value Number Average Value
LOANS ORIGINATED 189 $165,247 368 $132,729 338 $116,982 80 $35,572 13 $617,270 43 $126,492 APPLICATIONS APPROVED, NOT ACCEPTED 15 $162,312 48 $111,621 69 $107,895 49 $31,563 0 $0 7 $92,463 APPLICATIONS DENIED 27 $165,599 122 $107,841 242 $113,207 76 $25,340 2 $421,805 10 $121,045 APPLICATIONS WITHDRAWN 19 $160,389 68 $115,196 132 $114,003 18 $32,011 0 $0 9 $126,686 FILES CLOSED FOR INCOMPLETENESS 4 $167,980 12 $164,287 63 $162,726 2 $53,625 2 $2,543,630 2 $180,175
Aggregated Statistics For Year 1999(Based on 5 full and 8 partial tracts) A) FHA, FSA/RHS & VA B) Conventional C) Refinancings D) Home Improvement Loans E) Loans on Dwellings For 5+ Families F) Non-occupant Loans on Number Average Value Number Average Value Number Average Value Number Average Value Number Average Value Number Average Value
LOANS ORIGINATED 226 $155,058 389 $136,167 776 $132,272 134 $26,463 21 $1,651,410 80 $115,860 APPLICATIONS APPROVED, NOT ACCEPTED 11 $148,344 54 $131,011 146 $134,033 53 $27,989 1 $53,230 14 $109,567 APPLICATIONS DENIED 37 $152,601 118 $109,125 350 $111,250 118 $26,668 4 $182,818 20 $122,822 APPLICATIONS WITHDRAWN 25 $149,046 61 $138,723 234 $123,743 17 $37,181 2 $10,127,015 16 $136,543 FILES CLOSED FOR INCOMPLETENESS 5 $162,148 21 $145,582 111 $135,115 3 $86,420 8 $1,179,132 5 $115,142
Detailed mortgage data for all 14 tracts in Covina, CA
Private Mortgage Insurance Companies Aggregated Statistics For Year 2009(Based on 6 full and 8 partial tracts) A) Conventional B) Refinancings Number Average Value Number Average Value
LOANS ORIGINATED 22 $316,601 2 $325,850 APPLICATIONS APPROVED, NOT ACCEPTED 12 $311,577 9 $302,803 APPLICATIONS DENIED 3 $329,110 2 $308,590 APPLICATIONS WITHDRAWN 0 $0 1 $377,850 FILES CLOSED FOR INCOMPLETENESS 0 $0 0 $0
Aggregated Statistics For Year 2008(Based on 6 full and 8 partial tracts) A) Conventional B) Refinancings C) Non-occupant Loans on Number Average Value Number Average Value Number Average Value
LOANS ORIGINATED 68 $353,103 23 $384,061 4 $318,708 APPLICATIONS APPROVED, NOT ACCEPTED 36 $365,891 23 $403,549 6 $227,000 APPLICATIONS DENIED 8 $359,722 7 $369,283 3 $412,180 APPLICATIONS WITHDRAWN 6 $412,137 6 $359,028 1 $236,480 FILES CLOSED FOR INCOMPLETENESS 4 $364,138 2 $280,435 0 $0
Aggregated Statistics For Year 2007(Based on 6 full and 8 partial tracts) A) Conventional B) Refinancings C) Non-occupant Loans on Number Average Value Number Average Value Number Average Value
LOANS ORIGINATED 36 $392,220 23 $394,587 2 $373,480 APPLICATIONS APPROVED, NOT ACCEPTED 4 $405,735 6 $433,680 0 $0 APPLICATIONS DENIED 3 $464,517 2 $485,010 1 $245,470 APPLICATIONS WITHDRAWN 3 $500,650 3 $487,350 1 $252,710 FILES CLOSED FOR INCOMPLETENESS 0 $0 0 $0 0 $0
Aggregated Statistics For Year 2006(Based on 5 full and 8 partial tracts) A) Conventional B) Refinancings C) Non-occupant Loans on Number Average Value Number Average Value Number Average Value
LOANS ORIGINATED 10 $431,675 13 $421,855 1 $301,480 APPLICATIONS APPROVED, NOT ACCEPTED 4 $419,682 9 $398,183 0 $0 APPLICATIONS DENIED 0 $0 2 $381,340 0 $0 APPLICATIONS WITHDRAWN 0 $0 1 $396,370 0 $0 FILES CLOSED FOR INCOMPLETENESS 0 $0 0 $0 0 $0
Aggregated Statistics For Year 2005(Based on 6 full and 8 partial tracts) A) Conventional B) Refinancings C) Non-occupant Loans on D) Loans On Manufactured Number Average Value Number Average Value Number Average Value Number Average Value
LOANS ORIGINATED 17 $323,554 17 $353,972 1 $198,530 1 $227,370 APPLICATIONS APPROVED, NOT ACCEPTED 4 $411,288 6 $360,498 0 $0 0 $0 APPLICATIONS DENIED 0 $0 2 $416,660 0 $0 0 $0 APPLICATIONS WITHDRAWN 3 $413,803 3 $385,250 1 $359,000 0 $0 FILES CLOSED FOR INCOMPLETENESS 0 $0 0 $0 0 $0 0 $0
Aggregated Statistics For Year 2004(Based on 6 full and 8 partial tracts) A) Conventional B) Refinancings C) Non-occupant Loans on Number Average Value Number Average Value Number Average Value
LOANS ORIGINATED 35 $300,373 22 $286,910 4 $222,600 APPLICATIONS APPROVED, NOT ACCEPTED 11 $278,355 20 $257,578 1 $147,800 APPLICATIONS DENIED 1 $375,770 1 $187,680 0 $0 APPLICATIONS WITHDRAWN 2 $288,600 4 $278,228 0 $0 FILES CLOSED FOR INCOMPLETENESS 1 $133,020 1 $155,540 0 $0
Aggregated Statistics For Year 2003(Based on 6 full and 8 partial tracts) A) Conventional B) Refinancings C) Non-occupant Loans on Number Average Value Number Average Value Number Average Value
LOANS ORIGINATED 109 $252,696 90 $228,911 7 $227,256 APPLICATIONS APPROVED, NOT ACCEPTED 26 $227,449 53 $239,161 3 $168,750 APPLICATIONS DENIED 1 $359,120 2 $294,550 1 $142,010 APPLICATIONS WITHDRAWN 2 $189,760 3 $276,733 0 $0 FILES CLOSED FOR INCOMPLETENESS 0 $0 0 $0 0 $0
Aggregated Statistics For Year 2002(Based on 5 full and 7 partial tracts) A) Conventional B) Refinancings C) Non-occupant Loans on Number Average Value Number Average Value Number Average Value
LOANS ORIGINATED 110 $213,672 104 $207,560 1 $236,380 APPLICATIONS APPROVED, NOT ACCEPTED 43 $207,280 45 $194,718 1 $237,760 APPLICATIONS DENIED 4 $206,240 2 $174,910 1 $244,120 APPLICATIONS WITHDRAWN 5 $228,888 8 $219,575 1 $306,000 FILES CLOSED FOR INCOMPLETENESS 2 $230,500 1 $164,210 0 $0
Aggregated Statistics For Year 2001(Based on 5 full and 7 partial tracts) A) Conventional B) Refinancings C) Non-occupant Loans on Number Average Value Number Average Value Number Average Value
LOANS ORIGINATED 138 $196,408 104 $188,122 4 $172,878 APPLICATIONS APPROVED, NOT ACCEPTED 21 $192,058 24 $187,968 2 $105,990 APPLICATIONS DENIED 12 $192,560 4 $191,045 3 $148,147 APPLICATIONS WITHDRAWN 13 $202,020 6 $190,105 3 $186,330 FILES CLOSED FOR INCOMPLETENESS 0 $0 0 $0 0 $0
Aggregated Statistics For Year 2000(Based on 5 full and 7 partial tracts) A) Conventional B) Refinancings C) Non-occupant Loans on Number Average Value Number Average Value Number Average Value
LOANS ORIGINATED 94 $166,687 33 $164,025 4 $120,272 APPLICATIONS APPROVED, NOT ACCEPTED 14 $150,671 12 $157,018 3 $129,343 APPLICATIONS DENIED 11 $183,721 6 $173,178 0 $0 APPLICATIONS WITHDRAWN 2 $138,785 3 $177,503 0 $0 FILES CLOSED FOR INCOMPLETENESS 1 $185,000 0 $0 0 $0
Aggregated Statistics For Year 1999(Based on 5 full and 8 partial tracts) A) Conventional B) Refinancings C) Non-occupant Loans on Number Average Value Number Average Value Number Average Value
LOANS ORIGINATED 122 $166,456 116 $163,566 3 $125,903 APPLICATIONS APPROVED, NOT ACCEPTED 10 $180,018 29 $153,694 6 $132,828 APPLICATIONS DENIED 7 $173,353 6 $155,067 0 $0 APPLICATIONS WITHDRAWN 7 $167,811 7 $161,496 0 $0 FILES CLOSED FOR INCOMPLETENESS 0 $0 2 $205,565 0 $0
Fire-safe hotels and motels in Covina, California:
Radisson Suites Hotel Covina, 1211 E Garvey St, Covina, California 91724 Phone: (626) 915-3441, Fax: (626) 543-1043
Park Inn By Radisson Covina, 1211 E Garvey Ave, Covina, California 91724 Phone: (626) 915-3441, Fax: (626) 543-1043
All 2 fire-safe hotels and motels in Covina, California
Most common first names in Covina, CA among deceased individuals Name Count Lived (average)
John 350 71.8 years Mary 331 78.6 years Robert 287 70.1 years William 269 73.2 years James 232 71.1 years George 173 74.3 years Charles 170 73.3 years Helen 162 80.3 years Dorothy 151 76.1 years Joseph 148 74.4 years
Most common last names in Covina, CA among deceased individuals Last name Count Lived (average)
Smith 142 76.2 years Johnson 79 72.1 years Brown 70 76.6 years Miller 64 75.1 years Wilson 52 75.7 years Jones 51 75.9 years Anderson 45 78.1 years Garcia 43 72.7 years Davis 43 74.6 years Williams 43 75.3 years
Covina compared to California state average:
Unemployed percentage significantly below state average. Length of stay since moving in above state average.
Top Patent Applicants
James W. Coiner (10)
Lilly I. Kong (9)
Peisheng Hu (6)
Rez Mustafa (6)
Thomas I. Valdez (5)
Stephen Schneider (5)
Mustafa Rez (4)
Kristine B. Fuimaono (4)
Yu Zheng (4)
Kristine Fuimaono (3)
Total of 171 patent applications in 2008-2024.
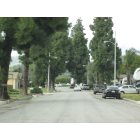
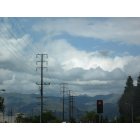

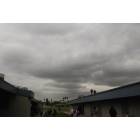
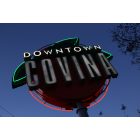
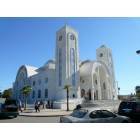
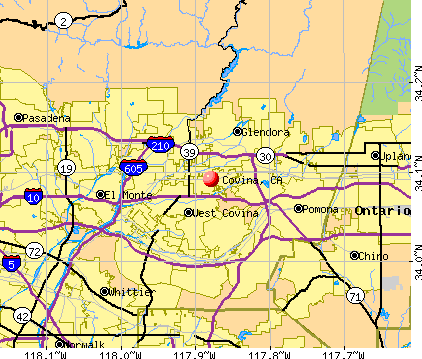


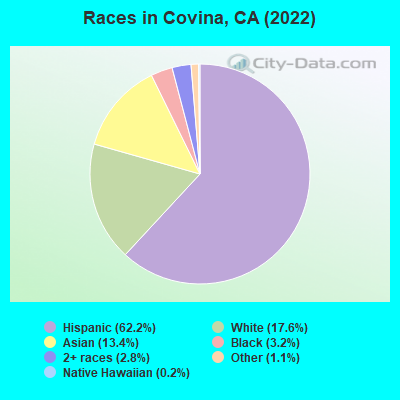
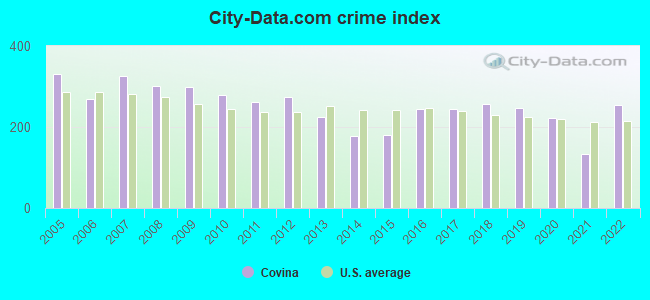
 Recent articles from our blog. Our writers, many of them Ph.D. graduates or candidates, create easy-to-read articles on a wide variety of topics.

 (1.7 miles
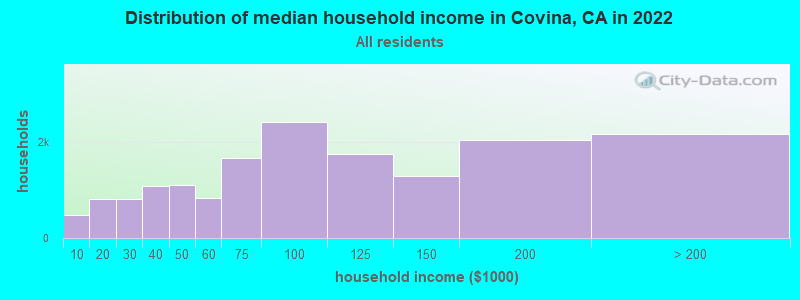
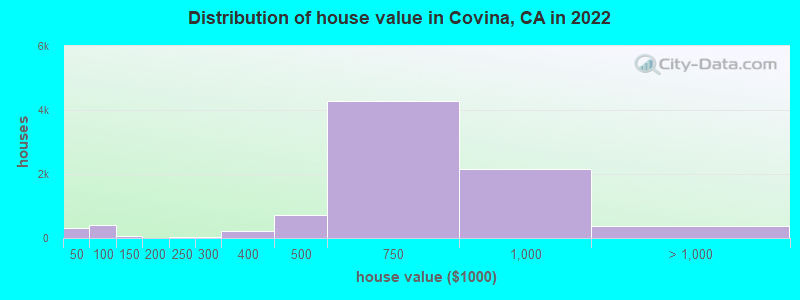
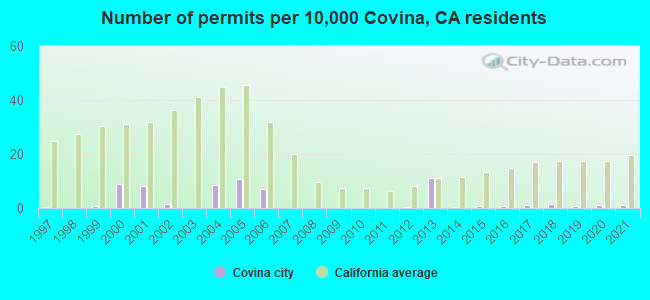
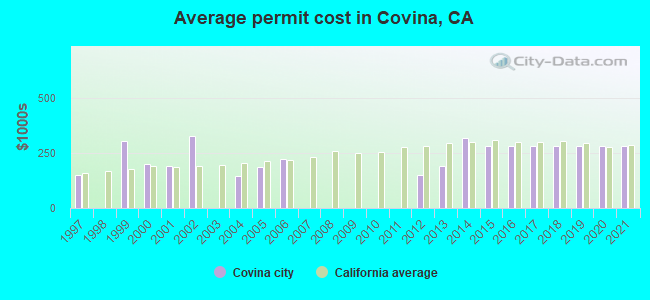
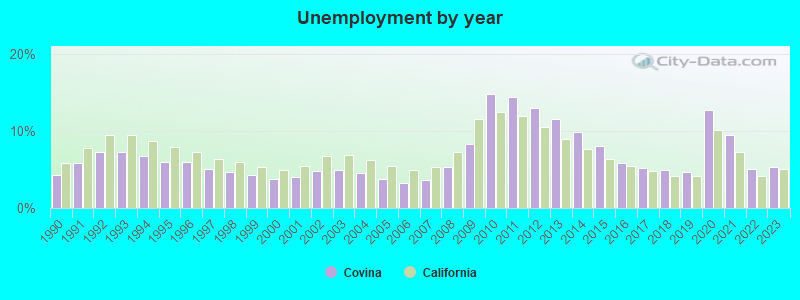
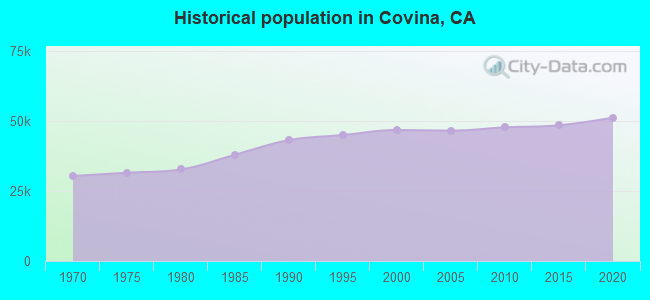
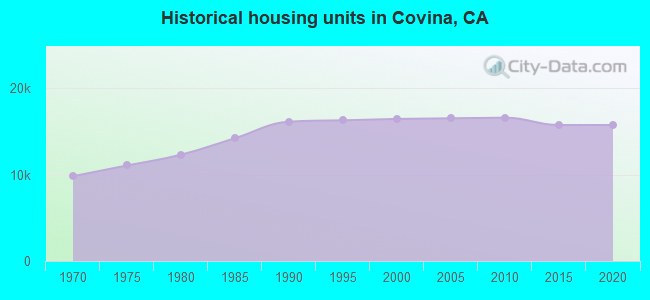
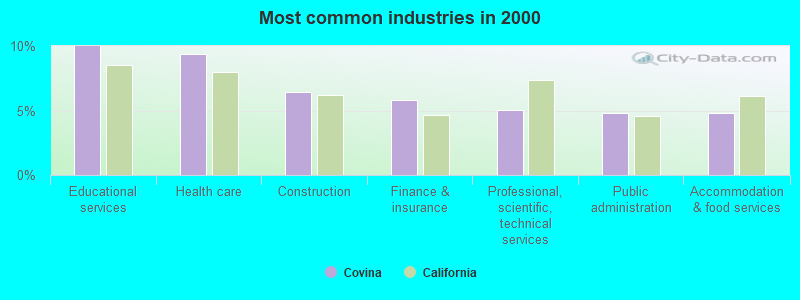
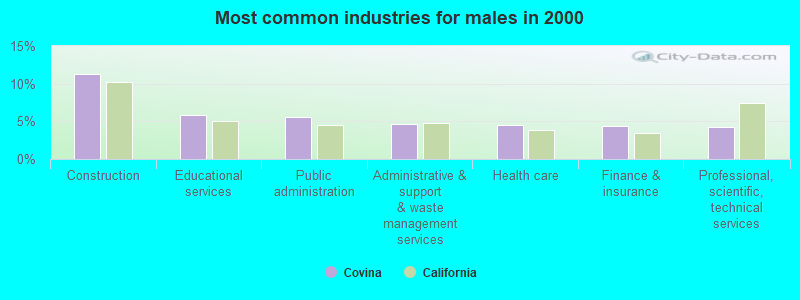
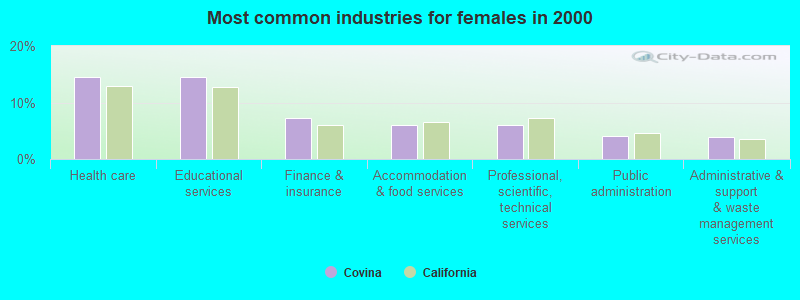
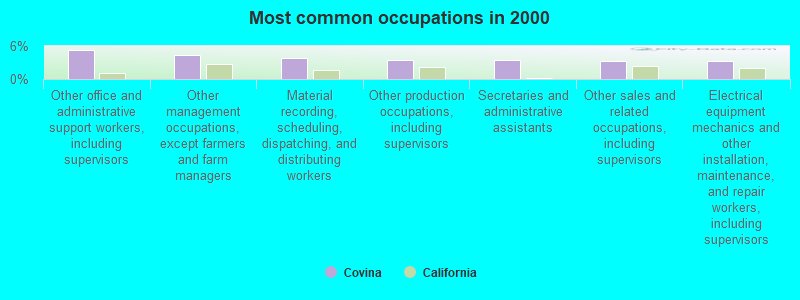
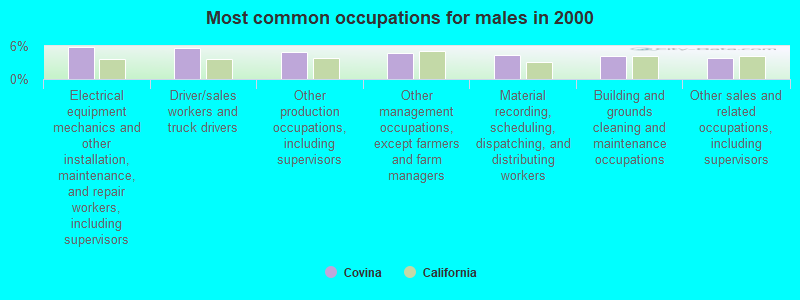
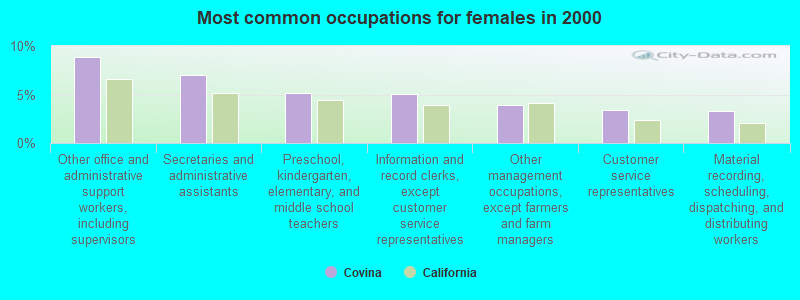
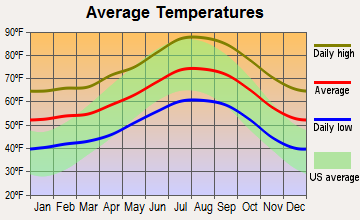
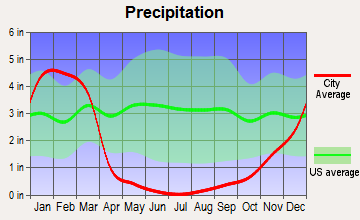
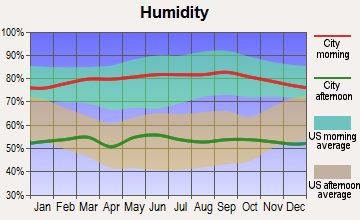
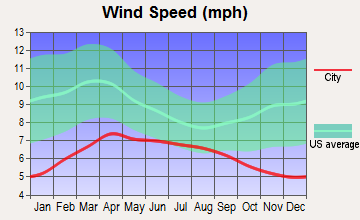
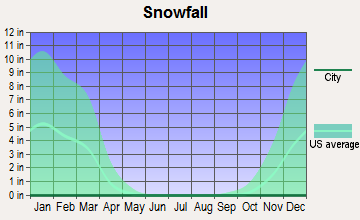
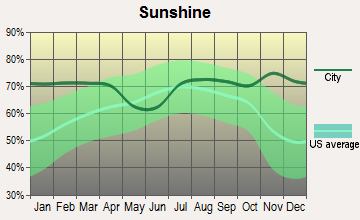
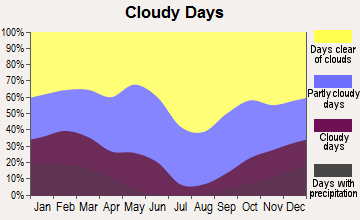
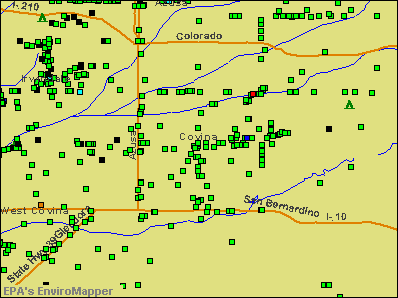

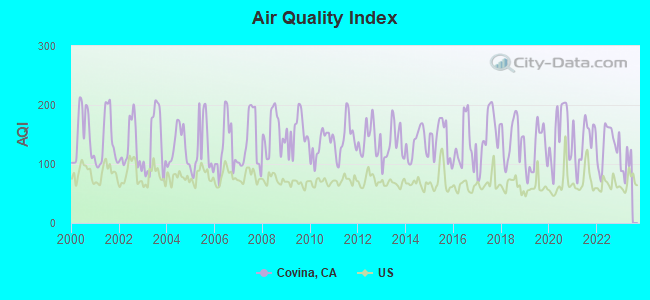
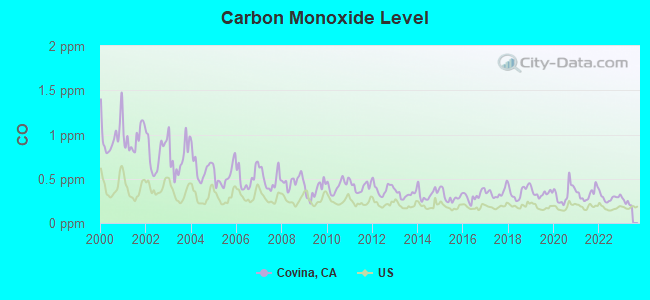
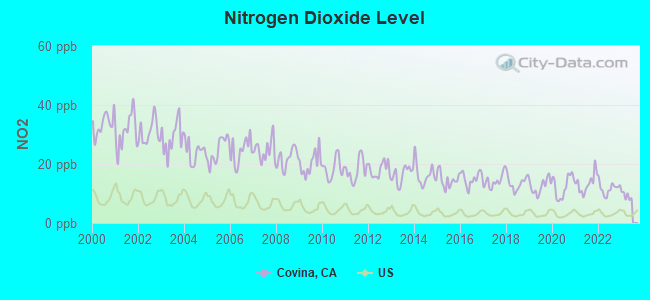
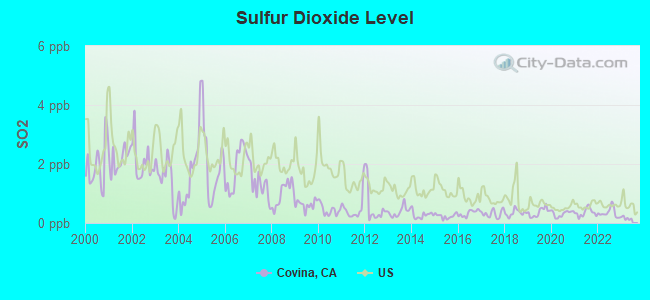
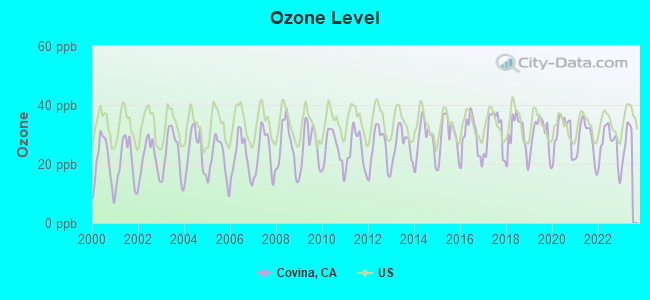
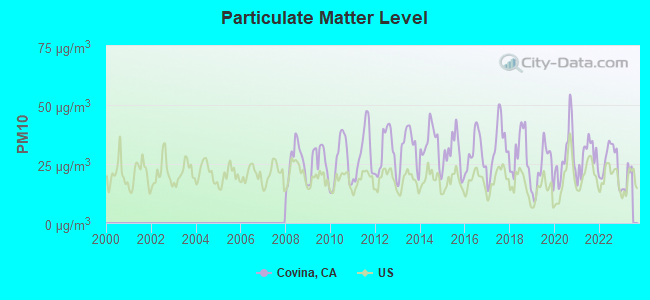
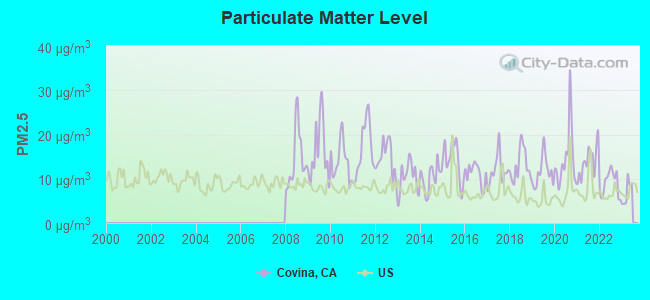
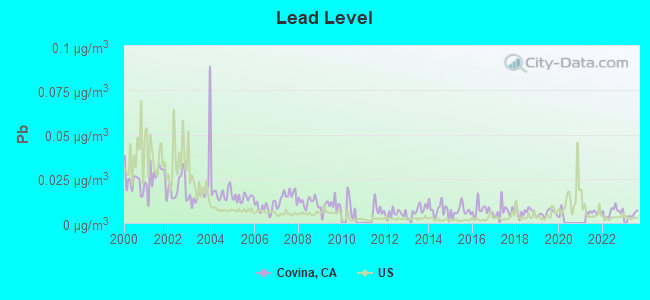
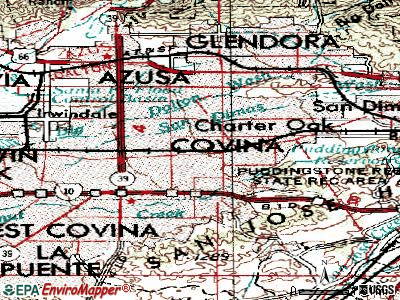
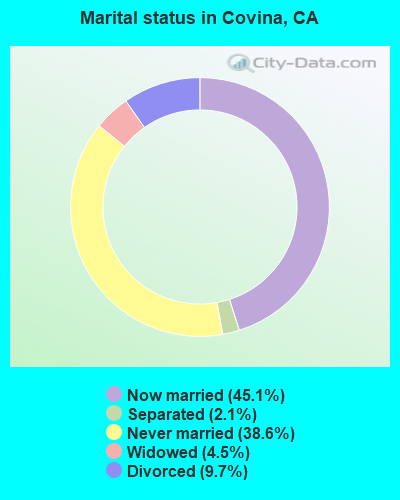
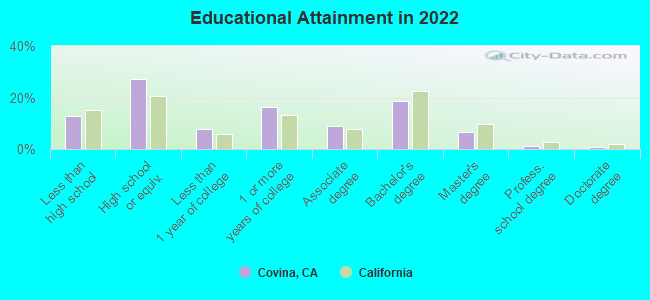
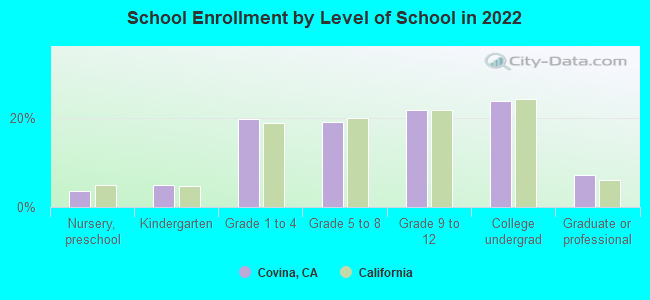
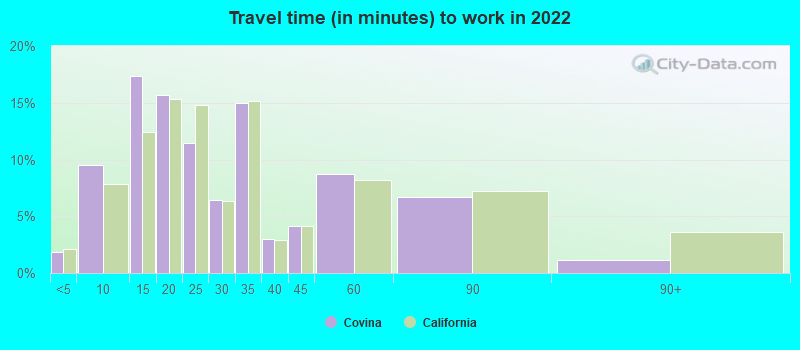
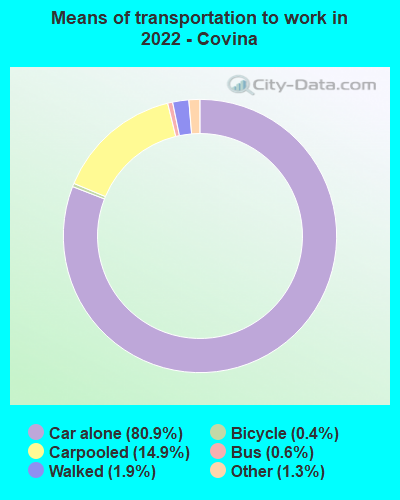


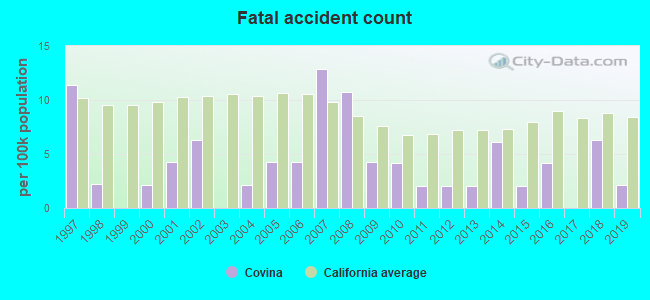
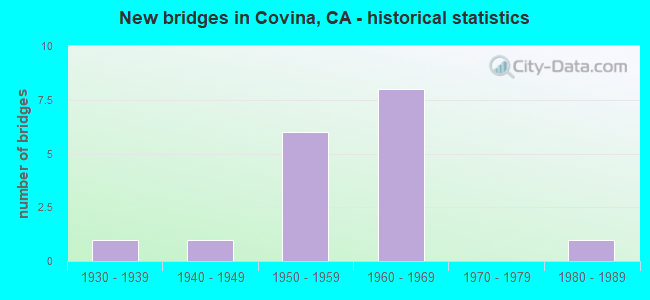
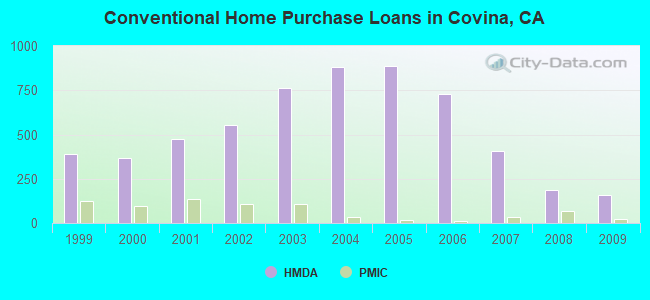
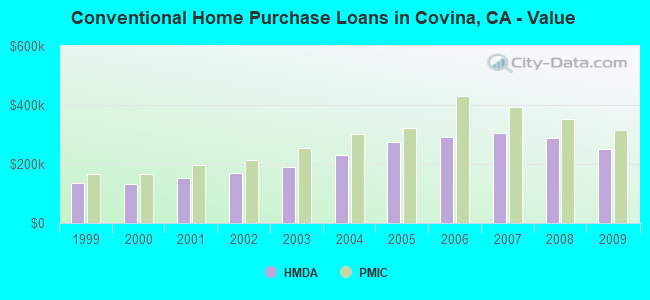
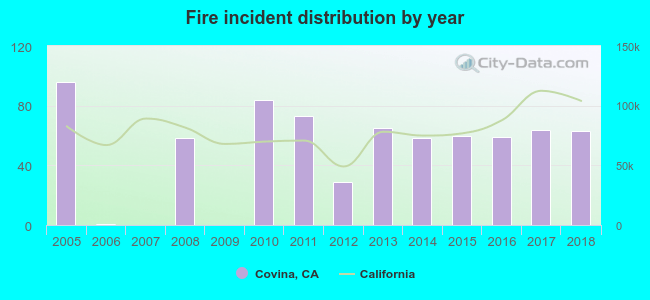 Based on the data from the years 2005 - 2018 the average number of fire incidents per year is 51. The highest number of reported fires - 96 took place in 2005, and the least - 0 in 2007. The data has a dropping trend.
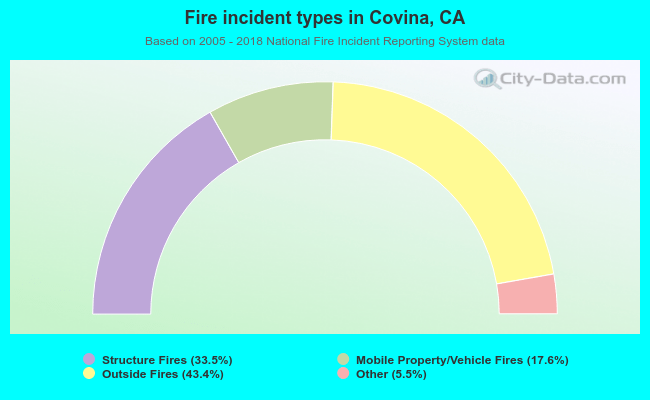 When looking into fire subcategories, the most reports belonged to: Outside Fires (43.4%), and Structure Fires (33.5%).