Columbia, Missouri

Columbia: The Magic Tree of Columbia
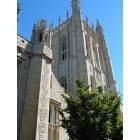
Columbia: University of Missouri

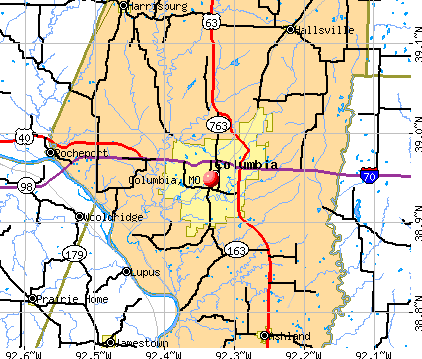
Columbia: Columbia, Missouri
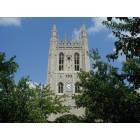
Columbia: University of Missouri Memorial Union
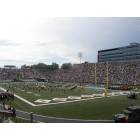
Columbia: Memorial Stadium, Home of the MU Tigers, Columbia, MO

Columbia: just off the KT trail
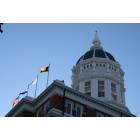
Columbia: Jesse Hall, University of Missouri
Columbia: Broadway Shops Holidays
Columbia: Johnston Dormitory

Columbia

Columbia: broadway
- see
44
more - add
your
Submit your own pictures of this city and show them to the world
- OSM Map
- General Map
- Google Map
- MSN Map
Population change since 2000: +52.1%
| Males: 60,304 | |
| Females: 68,251 |
| Median resident age: | 28.6 years |
| Missouri median age: | 39.1 years |
Zip codes: 65202, 65203, 65215.
Columbia Zip Code Map| Columbia: | $58,067 |
| MO: | $64,811 |
Estimated per capita income in 2022: $35,091 (it was $19,507 in 2000)
Columbia city income, earnings, and wages data
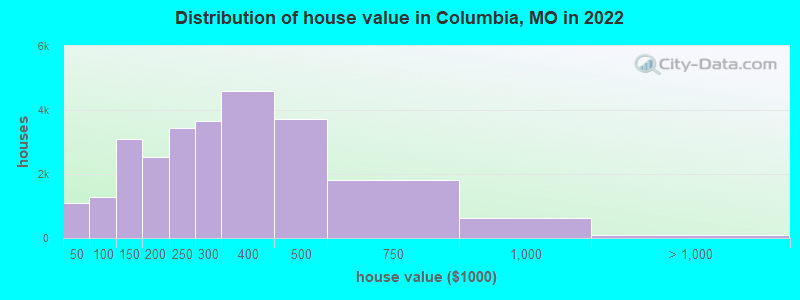
Estimated median house or condo value in 2022: $271,800 (it was $110,700 in 2000)
| Columbia: | $271,800 |
| MO: | $221,200 |
Mean prices in 2022: all housing units: $307,686; detached houses: $318,488; townhouses or other attached units: $328,323; in 2-unit structures: $89,792; in 3-to-4-unit structures: $257,003; in 5-or-more-unit structures: $233,902; mobile homes: $73,645
Median gross rent in 2022: $968.
(18.3% for White Non-Hispanic residents, 44.4% for Black residents, 22.4% for Hispanic or Latino residents, 33.9% for American Indian residents, 28.0% for Native Hawaiian and other Pacific Islander residents, 14.2% for other race residents, 23.4% for two or more races residents)
Detailed information about poverty and poor residents in Columbia, MO


- 93,77172.9%White alone
- 14,36511.2%Black alone
- 8,5516.7%Asian alone
- 5,6084.4%Two or more races
- 5,7154.4%Hispanic
- 2390.2%Native Hawaiian and Other
Pacific Islander alone - 2170.2%Other race alone
- 790.06%American Indian alone
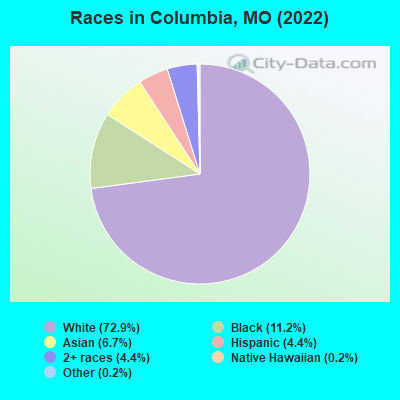
Races in Columbia detailed stats: ancestries, foreign born residents, place of birth
According to our research of Missouri and other state lists, there were 322 registered sex offenders living in Columbia, Missouri as of May 23, 2024.
The ratio of all residents to sex offenders in Columbia is 366 to 1.
The ratio of registered sex offenders to all residents in this city is near the state average.
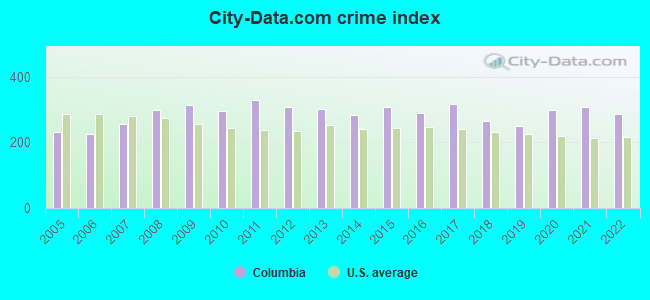
The City-Data.com crime index weighs serious crimes and violent crimes more heavily. Higher means more crime, U.S. average is 246.1. It adjusts for the number of visitors and daily workers commuting into cities.
- means the value is smaller than the state average.- means the value is about the same as the state average.
- means the value is bigger than the state average.
- means the value is much bigger than the state average.
Crime rate in Columbia detailed stats: murders, rapes, robberies, assaults, burglaries, thefts, arson
Full-time law enforcement employees in 2021, including police officers: 208 (162 officers - 145 male; 17 female).
| Officers per 1,000 residents here: | 1.28 |
| Missouri average: | 2.54 |
 Recent articles from our blog. Our writers, many of them Ph.D. graduates or candidates, create easy-to-read articles on a wide variety of topics.

 | Sketchy People Taking Over Columbia, Missouri? (2 replies) |
| Springfield or Columbia (16 replies) |
| Columbia, MO things to do (4 replies) |
| Columbia IL Question (7 replies) |
| Columbia Mo. new construction home prices (2 replies) |
| Columbia luxury student housing (0 replies) |
Latest news from Columbia, MO collected exclusively by city-data.com from local newspapers, TV, and radio stations
Ancestries: German (19.3%), American (9.3%), English (8.2%), Irish (6.1%), European (3.5%), Italian (2.4%).
Current Local Time: CST time zone
Incorporated in 1826
Elevation: 758 feet
Land area: 53.1 square miles.
Population density: 2,422 people per square mile (low).
10,295 residents are foreign born (5.1% Asia, 1.2% Latin America, 1.0% Africa, 0.9% Europe).
| This city: | 8.0% |
| Missouri: | 4.2% |
Median real estate property taxes paid for housing units with mortgages in 2022: $2,147 (0.8%)
Median real estate property taxes paid for housing units with no mortgage in 2022: $2,456 (1.0%)
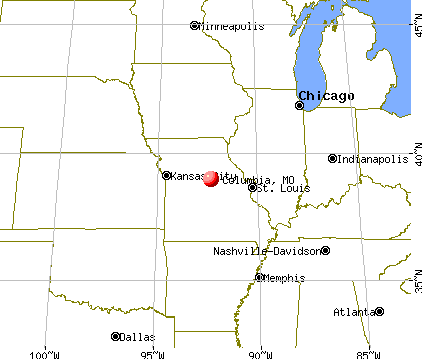
Nearest city with pop. 200,000+: St. Louis, MO  (114.9 miles , pop. 348,189).
Nearest city with pop. 1,000,000+: Chicago, IL (316.4 miles , pop. 2,896,016).
Nearest cities:
)Latitude: 38.95 N, Longitude: 92.33 W
Daytime population change due to commuting: +26,315 (+20.5%)
Workers who live and work in this city: 55,330 (86.2%)
Area code: 573

Columbia, Missouri accommodation & food services, waste management - Economy and Business Data
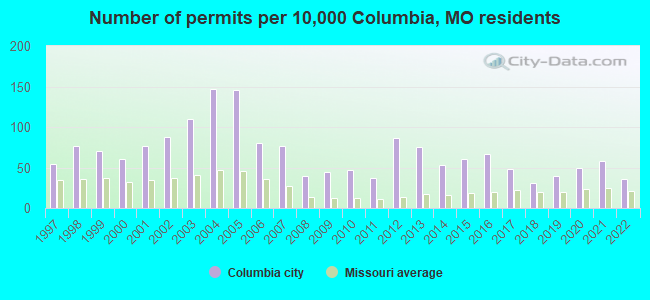
Single-family new house construction building permits:
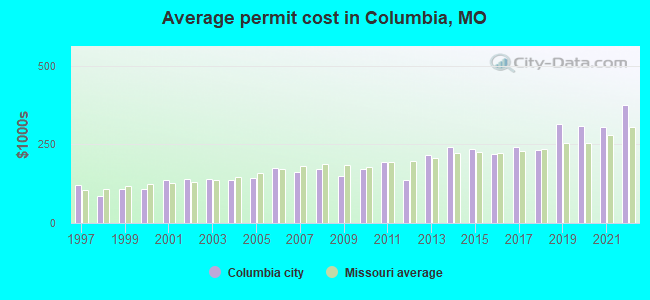
- 2022: 303 buildings, average cost: $375,200
- 2021: 487 buildings, average cost: $306,400
- 2020: 412 buildings, average cost: $309,000
- 2019: 338 buildings, average cost: $314,700
- 2018: 261 buildings, average cost: $232,400
- 2017: 403 buildings, average cost: $242,700
- 2016: 568 buildings, average cost: $217,900
- 2015: 516 buildings, average cost: $233,900
- 2014: 444 buildings, average cost: $240,800
- 2013: 631 buildings, average cost: $217,000
- 2012: 733 buildings, average cost: $137,100
- 2011: 316 buildings, average cost: $194,000
- 2010: 401 buildings, average cost: $171,300
- 2009: 380 buildings, average cost: $148,700
- 2008: 335 buildings, average cost: $171,800
- 2007: 653 buildings, average cost: $163,200
- 2006: 679 buildings, average cost: $174,500
- 2005: 1231 buildings, average cost: $143,900
- 2004: 1245 buildings, average cost: $135,800
- 2003: 926 buildings, average cost: $139,600
- 2002: 746 buildings, average cost: $138,700
- 2001: 640 buildings, average cost: $136,500
- 2000: 516 buildings, average cost: $108,600
- 1999: 593 buildings, average cost: $108,700
- 1998: 645 buildings, average cost: $85,600
- 1997: 460 buildings, average cost: $119,500
| Here: | 2.2% |
| Missouri: | 2.8% |
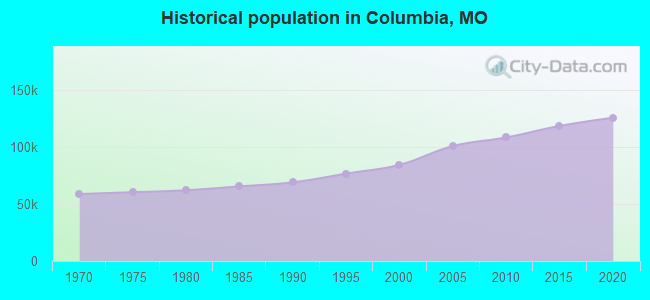
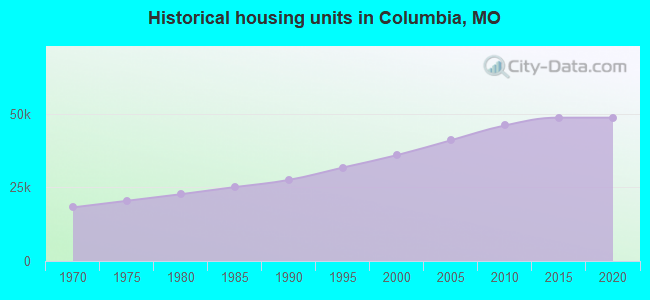
Population change in the 1990s: +14,498 (+20.7%).
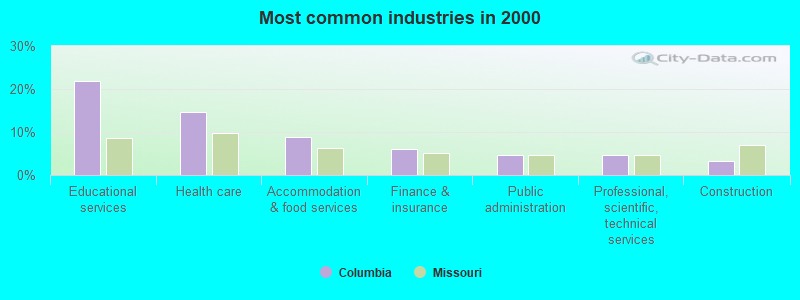
- Educational services (21.9%)
- Health care (14.6%)
- Accommodation & food services (8.8%)
- Finance & insurance (5.9%)
- Public administration (4.6%)
- Professional, scientific, technical services (4.5%)
- Construction (3.3%)
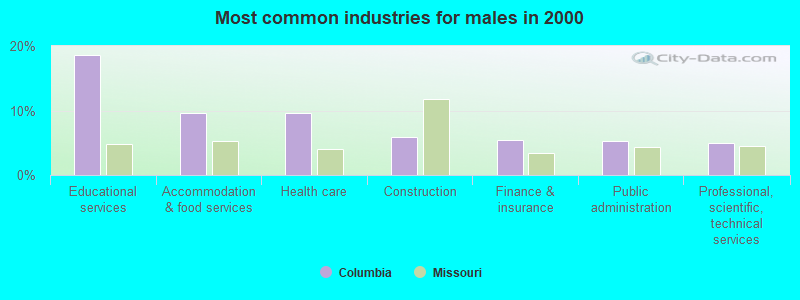
- Educational services (18.6%)
- Accommodation & food services (9.6%)
- Health care (9.6%)
- Construction (6.0%)
- Finance & insurance (5.4%)
- Public administration (5.2%)
- Professional, scientific, technical services (5.0%)
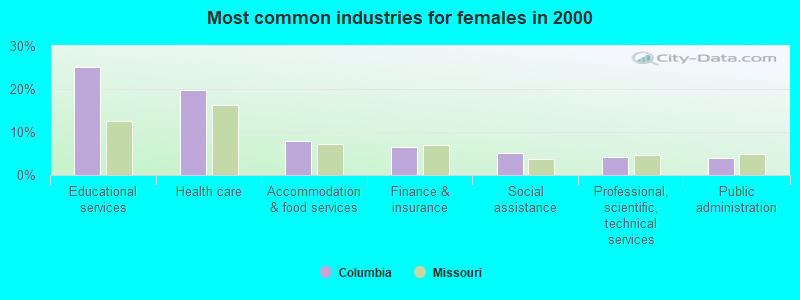
- Educational services (25.2%)
- Health care (19.7%)
- Accommodation & food services (7.9%)
- Finance & insurance (6.5%)
- Social assistance (5.1%)
- Professional, scientific, technical services (4.1%)
- Public administration (3.9%)
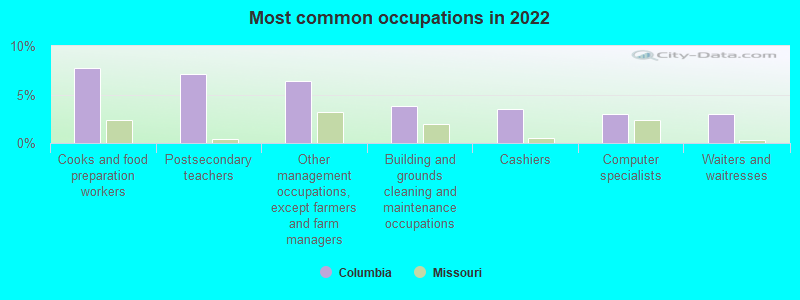
- Cooks and food preparation workers (7.7%)
- Postsecondary teachers (7.2%)
- Other management occupations, except farmers and farm managers (6.4%)
- Building and grounds cleaning and maintenance occupations (3.8%)
- Cashiers (3.5%)
- Computer specialists (3.0%)
- Waiters and waitresses (3.0%)
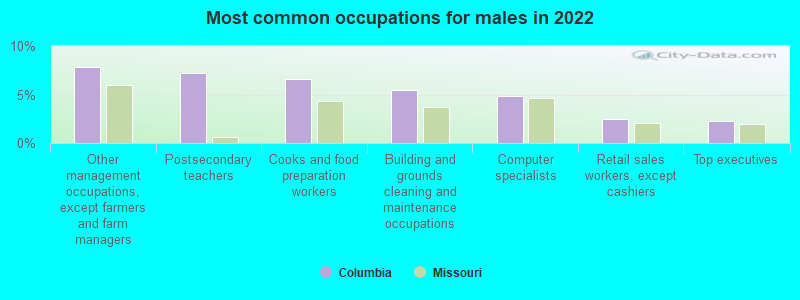
- Other management occupations, except farmers and farm managers (7.9%)
- Postsecondary teachers (7.2%)
- Cooks and food preparation workers (6.6%)
- Building and grounds cleaning and maintenance occupations (5.4%)
- Computer specialists (4.9%)
- Retail sales workers, except cashiers (2.5%)
- Top executives (2.2%)
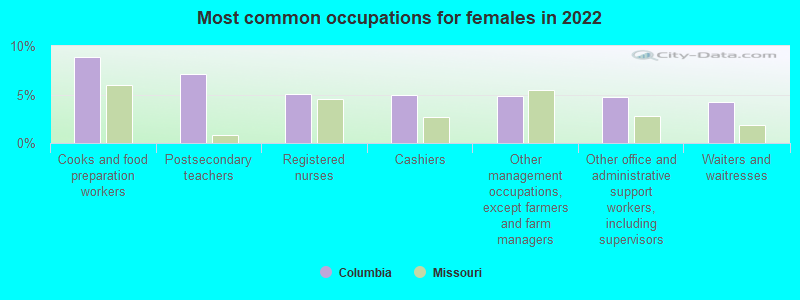
- Cooks and food preparation workers (8.9%)
- Postsecondary teachers (7.1%)
- Registered nurses (5.1%)
- Cashiers (5.0%)
- Other management occupations, except farmers and farm managers (4.9%)
- Other office and administrative support workers, including supervisors (4.7%)
- Waiters and waitresses (4.2%)
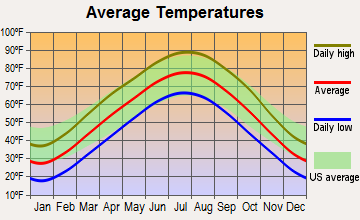
Average climate in Columbia, Missouri
Based on data reported by over 4,000 weather stations


|
|


Tornado activity:
Columbia-area historical tornado activity is slightly below Missouri state average. It is 24% greater than the overall U.S. average.
On 11/27/1990, a category F3 (max. wind speeds 158-206 mph) tornado 0.2 miles away from the Columbia city center injured 3 people and caused between $5,000,000 and $50,000,000 in damages.
On 11/10/1998, a category F3 tornado 0.2 miles away from the city center injured 16 people and caused $6 million in damages.
Earthquake activity:
Columbia-area historical earthquake activity is significantly above Missouri state average. It is 391% greater than the overall U.S. average.On 9/3/2016 at 12:02:44, a magnitude 5.8 (5.8 MW, Depth: 3.5 mi, Class: Moderate, Intensity: VI - VII) earthquake occurred 306.1 miles away from the city center
On 4/18/2008 at 09:36:59, a magnitude 5.4 (5.1 MB, 4.8 MS, 5.4 MW, 5.2 MW) earthquake occurred 242.5 miles away from Columbia center
On 9/26/1990 at 13:18:51, a magnitude 5.0 (4.7 MB, 4.8 LG, 5.0 LG, Depth: 7.7 mi) earthquake occurred 196.0 miles away from the city center
On 4/18/2008 at 09:36:59, a magnitude 5.2 (5.2 MW, Depth: 8.9 mi) earthquake occurred 242.5 miles away from the city center
On 11/6/2011 at 03:53:10, a magnitude 5.7 (5.7 MW, Depth: 3.2 mi) earthquake occurred 339.6 miles away from Columbia center
On 5/4/1991 at 01:18:54, a magnitude 5.0 (4.4 MB, 4.6 LG, 5.0 LG, Depth: 3.1 mi) earthquake occurred 214.6 miles away from Columbia center
Magnitude types: regional Lg-wave magnitude (LG), body-wave magnitude (MB), surface-wave magnitude (MS), moment magnitude (MW)
Natural disasters:
The number of natural disasters in Boone County (25) is a lot greater than the US average (15).Major Disasters (Presidential) Declared: 15
Emergencies Declared: 7
Causes of natural disasters: Floods: 14, Storms: 12, Tornadoes: 9, Winter Storms: 7, Winds: 2, Drought: 1, Heavy Rain: 1, Hurricane: 1, Ice Storm: 1, Snowstorm: 1, Other: 1 (Note: some incidents may be assigned to more than one category).
Hospitals in Columbia:
- BOONE HOSPITAL CENTER (Voluntary non-profit - Other, provides emergency services, 1600 E BROADWAY)
- CHARTER BEHAVIORAL HS OF COLUMBIA (200 PORTLAND ST)
- COLUMBIA REGIONAL HOSPITAL (provides emergency services, 404 KEENE ST)
- COMMUNITY HOSPICES OF AMERICA - NORTH CENTRAL (800 HWY 63 NORTH, SUITE 100)
- HEALTHCOR, INC (3215 LE MONE INDUSTRIAL BLVD STE 100)
- HEART OF MISSOURI MENTAL HEALTH (provides emergency services, THREE HOSPITAL DRIVE)
- MISSOURI RIVER HOSPICE (1410 HERIFORD ROAD)
- PREFERRED HOSPICE OF MISSOURI (CENTRAL) LLC (1900 NORTH PROVIDENCE ROAD SUITE 311)
- REGIONAL HOSPICE OF CENTRAL MISSOURI (404 KEENE STREET)
- RUSK REHABILITATION CENTER LLC (315 BUSINESS LOOP 70 W)
Airports and heliports located in Columbia:
- Columbia Regional Airport (COU) (Runways: 2, Commercial Ops: 1,114, Air Taxi Ops: 2,586, Itinerant Ops: 11,935, Local Ops: 5,358, Military Ops: 1,957)
- Cedar Creek Airport (MO74) (Runways: 1)
- Sugar Branch Airport (MU32) (Runways: 1)
- White Cloud Flying Field Airport (MU23) (Runways: 1)
- Boone Hospital Center Heliport (91MO)
- Columbia Regional Hospital Heliport (MO88)
- Refueling Pad Heliport (MU96)
- University Hospitals & Clinics Heliport (MU37)
Colleges/Universities in Columbia:
- University of Missouri-Columbia (Full-time enrollment: 29,599; Location: 105 Jesse Hall; Public; Website: missouri.edu/; Offers Doctor's degree)
- Columbia College (Full-time enrollment: 13,975; Location: 1001 Rogers Street; Private, not-for-profit; Website: www.ccis.edu; Offers Master's degree)
- Stephens College (Full-time enrollment: 877; Location: 1200 E Broadway; Private, not-for-profit; Website: www.stephens.edu; Offers Master's degree)
- Bryan University (Full-time enrollment: 243; Location: 3215 LeMone Industrial Boulevard; Private, for-profit; Website: www.bryanu.edu)
- Columbia Area Career Center (Full-time enrollment: 98; Location: 4203 S Providence Rd; Public; Website: www.career-center.org)
- Cosmetology Concepts Institute (Full-time enrollment: 49; Location: 1611 Burlington Street Suite A; Private, for-profit; Website: www.cosmetology-concepts.com)
- University of Missouri-System Office (Location: 321 University Hall; Public; Website: www.umsystem.edu/; Offers Doctor's degree)
Other colleges/universities with over 2000 students near Columbia:
- Lincoln University (about 29 miles; Jefferson City, MO; Full-time enrollment: 2,348)
- Moberly Area Community College (about 34 miles; Moberly, MO; FT enrollment: 3,977)
- State Fair Community College (about 54 miles; Sedalia, MO; FT enrollment: 3,581)
- Missouri University of Science and Technology (about 76 miles; Rolla, MO; FT enrollment: 6,486)
- University of Central Missouri (about 77 miles; Warrensburg, MO; FT enrollment: 9,952)
- East Central College (about 82 miles; Union, MO; FT enrollment: 2,810)
- Truman State University (about 87 miles; Kirksville, MO; FT enrollment: 5,553)
Public high schools in Columbia:
- ROCK BRIDGE SR. HIGH (Students: 1,707, Location: 4303 S PROVIDENCE RD, Grades: PK-12)
- FREDERICK DOUGLASS HIGH (Students: 243, Location: 310 N PROVIDENCE RD, Grades: PK-12)
- JUVENILE JUSTICE CTR. (Students: 15, Location: 5665 ROGER I WILSON MEM DR, Grades: 1-12)
- CORNERSTONE (Location: 1250 E BROWN SCHOOL RD, Grades: 6-12)
- DELMAR A COBBLE SCHOOL (Location: 108 W CRAIG ST, Grades: KG-12)
- COLUMBIA AREA CAREER CTR. (Location: 4203 S PROVIDENCE RD, Grades: 10-12)
- DAVID H. HICKMAN HIGH (Location: 1104 N PROVIDENCE RD, Grades: PK-12)
- MURIEL W. BATTLE HIGH SCHOOL (Location: 7575 ST. CHARLES ROAD, Grades: PK-12)
Private high schools in Columbia:
- COLUMBIA INDEPENDENT SCHOOL (Students: 365, Location: 1801 N STADIUM BLVD, Grades: PK-12)
- CHRISTIAN FELLOWSHIP SCHOOL (Students: 302, Location: 4600 CHRISTIAN FELLOWSHIP RD, Grades: PK-12)
- HERITAGE ACADEMY (Students: 104, Location: 606 RIDGEWAY AVE, Grades: UG-12)
- COLLEGE PARK CHRISTIAN ACADEMY (Students: 78, Location: 1114 COLLEGE PARK DR, Grades: PK-9)
Biggest public elementary/middle schools in Columbia:
- WEST MIDDLE SCHOOL (Students: 953, Location: 401 CLINKSCALES RD, Grades: 6-8)
- SMITHTON MIDDLE (Students: 930, Location: 3600 W WORLEY, Grades: 6-8)
- JEFFERSON MIDDLE SCHOOL (Students: 911, Location: 713 ROGERS ST, Grades: 6-8)
- JOHN B. LANGE MIDDLE (Students: 757, Location: 2201 E SMILEY LN, Grades: 6-8)
- MILL CREEK ELEM. (Students: 751, Location: 2200 NIFONG BLVD, Grades: PK-5)
- OAKLAND MIDDLE SCHOOL (Students: 750, Location: 3405 OAKLAND PL, Grades: 6-8)
- ANN HAWKINS GENTRY MIDDLE (Students: 747, Location: 4200 BETHEL ST, Grades: 6-8)
- DERBY RIDGE ELEM. (Students: 715, Location: 4000 DERBY RIDGE RD, Grades: PK-5)
- MARY PAXTON KEELEY ELEM. (Students: 687, Location: 201 PARK DEVILLE, Grades: PK-5)
- RUSSELL BLVD. ELEM. (Students: 554, Location: 1800 W ROLLINS RD, Grades: PK-5)
Private elementary/middle schools in Columbia:
- OUR LADY OF LOURDES INTERPARISH SCHOOL (Students: 588, Location: 817 BERNADETTE DR, Grades: KG-8)
- CHRISTIAN CHAPEL ACADEMY (Students: 125, Location: 3300 S PROVIDENCE RD, Grades: PK-8)
- GOOD SHEPHERD LUTHERAN SCHOOL (Students: 89, Location: 2201 W ROLLINS RD, Grades: KG-8)
- ISLAMIC SCHOOL OF COLUMBIA-MISSOURI (Students: 79, Location: 408 LOCUST ST, Grades: UG-5)
Library in Columbia:
User-submitted facts and corrections:
- The library is no longer on Park Deville Drive; it returned to 100 West Broadway when construction was completed a few years ago.
- FM Stations addition: KPOW 97.7 FM Sedalia, Mo Owner: Matthewson Broadcasting Sedalia Missouri genre: Classic Rock 100,000Watts
Points of interest:
Notable locations in Columbia: Sanborn Field and Soil Erosion Plots (A), Columbia Country Club (B), Columbia Plaza (C), Broadway Center (D), Crossroads West (E), Eastgate Plaza (F), Parkade Plaza (G), Columbia Fire Department Station 2 (H), Columbia Fire Department Station 3 (I), Columbia Fire Department Station 4 (J), Columbia Fire Department Station 5 (K), Columbia Fire Department Station 6 (L), Columbia Fire Department Station 7 (M), Columbia Fire Department Station 8 (N), Lenoir Home (O), Columbia Fire Department Headquarters (P), Department of Conservation Regional Fire Office Central (Q), Boone County Fire Protection District Station 14 (R), Columbia Fire Department Training Academy (S), Missouri University Fire and Rescue Training Institute (T). Display/hide their locations on the map
Shopping Centers: Forum Shopping Center (1), Rock Bridge Shopping Center (2), Biscayne Mall (3), Columbia Mall (4), North County Shopping Center (5), Whitegate Shopping Center (6). Display/hide their locations on the map
Churches in Columbia include: Emmanuel Church (A), Fairview Church (B), Sugar Grove Church (C), Broadway Church (D). Display/hide their locations on the map
Cemeteries: Jewell Cemetery (1), Memorial Park Cemetery (2), Antioch Cemetery (3), Hinkson Creek Cemetery (4), Columbia Cemetery (5), Fairview Cemetery (6). Display/hide their locations on the map
Lakes and reservoirs: Moores Lake (A), Shady Lake (B), Hulen Lake (C), Waters Edge Estates Lake (D), Stephens Lake (E), Lower Municipal Golf Course Lake (F), Fairview Lake (G), Cedar Lake (H). Display/hide their locations on the map
Streams, rivers, and creeks: Hinkson Creek (A), Hominy Branch (B), County House Branch (C), Goose Creek (D), Grindstone Creek (E), Goodin Branch (F), Merideth Branch (G), Flat Branch (H), Scotts Branch (I). Display/hide their locations on the map
Parks in Columbia include: Kiwanis Park (1), Cosmo Park (2), Stephens Park (3), Nickell Park (4), Memorial Stadium (5). Display/hide their locations on the map
Tourist attractions: Missouri Alliance for Historic Preservation (Historical Places & Services; 65 McReynolds Hall) (1), Historic Preservation Consulting (Cultural Attractions- Events- & Facilities; 811 Cherry Street) (2), Brown Amusement & Vending Inc (Amusement & Theme Parks; 4507 Interstate 70 Drive Southeast) (3), Amf Bowling Centers (Amusement & Theme Parks; 1508 North Providence Road) (4), Amf Town & Country Lanes (Amusement & Theme Parks; 1508 North Providence Road) (5), Fearfest (Amusement & Theme Parks; 6399 Highway 40 West) (6), Gunthers Games (Amusement & Theme Parks; 1106 East Broadway) (7), EZ Steel Buildings (4300 Chrstn Flwshp Road) (8), Balloon Stormers (4300 Christian Fellowship) (9). Display/hide their approximate locations on the map
Hotels: Churchill's (2200 Interstate 70 Drive Southwest) (1), Columbia Super 8 Motel (3216 Clark Ln) (2), Arrow Head Motel LLC (1411 Business Loop 70 East) (3), Atrium Lounge (2200 Interstate 70 Drive Southwest) (4), Motel 6 (1800 Interstate 70 Drive Southwest) (5), Deluxe Inn (2112 Business Loop 70 East) (6), Columbia Dome Hotel (1612 N Providence Rd) (7), Hampton Inn Columbia- MO (3410 Clark Lane) (8), Comfort Suites (1010 Business Loop 70 East) (9). Display/hide their approximate locations on the map
Courts: Missouri Agricultural Statistics Service (601 Business Loop 70 West) (1), Boone County - Circuit Court Offices- Joint Communication (1 South 1st) (2), Boone County - Administrative Offices- Circuit Court Offices- Public Administrator Connie Hen (701 East Walnut Street) (3), Boone - Administrative Offices- Circuit Court Office- General Court Informa (705 East Walnut Street) (4), Boone County - Circuit Court Offices- Public Works- Administrative Off (701 East Walnut Street) (5). Display/hide their approximate locations on the map
Birthplace of: Norbert Wiener - (1894-1964), mathematician, Russ Carnahan - Politician, Jessica Capshaw - Film actor, Brett James - Country singer, Carlos Pena, Jr. - Black hair, Katherine Hanley - Politician, Judy Baker - Politician, Malcolm Thomas (basketball, born 1988) - Professional basketball player, Scott Murphy - Politician, Stan Kroenke - Billionaire.
Drinking water stations with addresses in Columbia and their reported violations in the past:
COLUMBIA (Population served: 100,733, Groundwater):Past health violations:BOONE CO PWSD 9 (Population served: 11,250, Groundwater):
- MCL, Average - Between APR-2008 and JUN-2008, Contaminant: TTHM. Follow-up actions: St Compliance achieved (AUG-26-2008)
- MCL, Average - Between JAN-2008 and MAR-2008, Contaminant: TTHM. Follow-up actions: St Compliance achieved (AUG-26-2008)
- MCL, Average - Between OCT-2007 and DEC-2007, Contaminant: TTHM. Follow-up actions: St Compliance achieved (AUG-26-2008)
Past health violations:BLUE ACRES MHP (Address: 4001 PONDEROSA LOT # 1 , Population served: 275, Purch groundwater):
- MCL, Average - Between OCT-2005 and SEP-2006, Contaminant: Combined Radium (-226 and -228). Follow-up actions: St Variance/Exemption issued (SEP-20-2006), St Compliance achieved (SEP-30-2010)
- MCL, Average - Between OCT-2005 and SEP-2006, Contaminant: Gross Alpha, Excl. Radon and U. Follow-up actions: St Variance/Exemption issued (SEP-20-2006), St Compliance achieved (OCT-29-2008)
- MCL, Average - Between JUL-2005 and JUN-2006, Contaminant: Combined Radium (-226 and -228). Follow-up actions: St Variance/Exemption issued (SEP-20-2006), St Compliance achieved (SEP-30-2010)
- MCL, Average - Between JUL-2005 and JUN-2006, Contaminant: Gross Alpha, Excl. Radon and U. Follow-up actions: St Variance/Exemption issued (SEP-20-2006), St Compliance achieved (OCT-29-2008)
- MCL, Average - Between APR-2005 and MAR-2006, Contaminant: Combined Radium (-226 and -228). Follow-up actions: St Variance/Exemption issued (SEP-20-2006), St Compliance achieved (SEP-30-2010)
- MCL, Average - Between APR-2005 and MAR-2006, Contaminant: Gross Alpha, Excl. Radon and U. Follow-up actions: St Variance/Exemption issued (SEP-20-2006), St Compliance achieved (OCT-29-2008)
Past monitoring violations:TARA CONDOMINIUMS (Population served: 30, Groundwater):
- Initial Tap Sampling for Pb and Cu - In JAN-01-2008, Contaminant: Lead and Copper Rule. Follow-up actions: St Compliance achieved (DEC-28-2012)
- 6 routine major monitoring violations
- One minor monitoring violation
Past health violations:Past monitoring violations:
- MCL, Monthly (TCR) - In MAY-2011, Contaminant: Coliform. Follow-up actions: St Public Notif requested (JUN-02-2011), St Violation/Reminder Notice (JUN-02-2011), St Public Notif received (JUN-13-2011), St Compliance achieved (JAN-22-2014)
- One regular monitoring violation
Drinking water stations with addresses in Columbia that have no violations reported:
- BOONE CO CONS PWSD 1 (Population served: 19,500, Primary Water Source Type: Groundwater)
| This city: | 2.3 people |
| Missouri: | 2.5 people |
| This city: | 49.7% |
| Whole state: | 65.3% |
| This city: | 7.4% |
| Whole state: | 6.7% |
Likely homosexual households (counted as self-reported same-sex unmarried-partner households)
- Lesbian couples: 0.5% of all households
- Gay men: 0.3% of all households
People in group quarters in Columbia in 2010:
- 7,387 people in college/university student housing
- 624 people in nursing facilities/skilled-nursing facilities
- 176 people in local jails and other municipal confinement facilities
- 136 people in mental (psychiatric) hospitals and psychiatric units in other hospitals
- 93 people in emergency and transitional shelters (with sleeping facilities) for people experiencing homelessness
- 82 people in other noninstitutional facilities
- 79 people in correctional residential facilities
- 63 people in residential treatment centers for juveniles (non-correctional)
- 55 people in residential treatment centers for adults
- 42 people in correctional facilities intended for juveniles
- 22 people in group homes for juveniles (non-correctional)
- 21 people in group homes intended for adults
- 20 people in workers' group living quarters and job corps centers
- 4 people in in-patient hospice facilities
People in group quarters in Columbia in 2000:
- 7,467 people in college dormitories (includes college quarters off campus)
- 549 people in nursing homes
- 241 people in other noninstitutional group quarters
- 82 people in other group homes
- 43 people in homes or halfway houses for drug/alcohol abuse
- 29 people in hospitals or wards for drug/alcohol abuse
- 21 people in homes for the mentally ill
- 17 people in hospitals/wards and hospices for chronically ill
- 17 people in other hospitals or wards for chronically ill
- 8 people in religious group quarters
- 2 people in homes for the mentally retarded
Banks with most branches in Columbia (2011 data):
- The Boone County National Bank of Columbia: 12 branches. Info updated 2006/11/03: Bank assets: $1,355.7 mil, Deposits: $1,121.1 mil, local headquarters, positive income, Commercial Lending Specialization, 18 total offices, Holding Company: Central Bancompany
- Commerce Bank: 9 branches. Info updated 2011/07/07: Bank assets: $20,493.6 mil, Deposits: $16,805.3 mil, headquarters in Kansas City, MO, positive income, 206 total offices, Holding Company: Commerce Bancshares, Inc.
- Landmark Bank, National Association: 8 branches. Info updated 2011/09/28: Bank assets: $1,675.9 mil, Deposits: $1,490.4 mil, local headquarters, positive income, Commercial Lending Specialization, 38 total offices, Holding Company: Landrum Company
- U.S. Bank National Association: University Of Missouri - Columbia, Columbia-Business Loop, Columbia East Broadway Branch, Columbia Forum Boulevard. Info updated 2012/01/30: Bank assets: $330,470.8 mil, Deposits: $236,091.5 mil, headquarters in Cincinnati, OH, positive income, 3121 total offices, Holding Company: U.S. Bancorp
- First State Community Bank: Columbia - Clark Lane Banking Center, Columbia - Bethel Banking Center, Columbia-Fifth Street Branch. Info updated 2011/01/03: Bank assets: $1,303.2 mil, Deposits: $1,092.4 mil, headquarters in Farmington, MO, positive income, Commercial Lending Specialization, 34 total offices, Holding Company: First State Bancshares, Inc.
- The Callaway Bank: Lake Of The Woods Branch, Broadway Branch, Chapel Hill Road Branch. Info updated 2006/11/03: Bank assets: $284.8 mil, Deposits: $235.7 mil, headquarters in Fulton, MO, positive income, Commercial Lending Specialization, 8 total offices, Holding Company: Callaway Security Banks, Inc.
- Regions Bank: Columbia Paris Road Branch, Providence Facility, Bernadette Drive Branch. Info updated 2011/02/24: Bank assets: $123,368.2 mil, Deposits: $98,301.3 mil, headquarters in Birmingham, AL, positive income, Commercial Lending Specialization, 1778 total offices, Holding Company: Regions Financial Corporation
- Bank of America, National Association: South Facility Branch, Columbia West Facility Branch, Columbia Downtown Branch. Info updated 2009/11/18: Bank assets: $1,451,969.3 mil, Deposits: $1,077,176.8 mil, headquarters in Charlotte, NC, positive income, 5782 total offices, Holding Company: Bank Of America Corporation
- Providence Bank: Columbia Branch at 8 North 5th Street, branch established on 2008/12/30; at 3855 Forum Boulevard, branch established on 1888/07/08. Info updated 2010/10/18: Bank assets: $670.4 mil, Deposits: $564.2 mil, local headquarters, negative income in the last year, Commercial Lending Specialization, 13 total offices, Holding Company: Linco Bancshares, Inc.
- 21 other banks with 21 local branches
For population 15 years and over in Columbia:
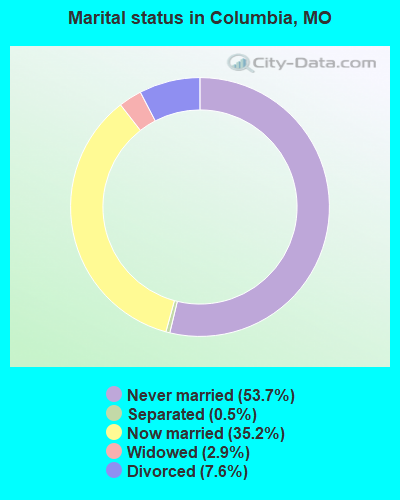
- Never married: 53.7%
- Now married: 35.2%
- Separated: 0.5%
- Widowed: 2.9%
- Divorced: 7.6%
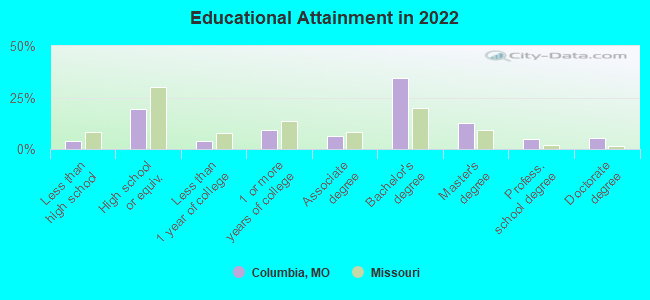
For population 25 years and over in Columbia:
- High school or higher: 96.0%
- Bachelor's degree or higher: 57.2%
- Graduate or professional degree: 22.8%
- Unemployed: 6.8%
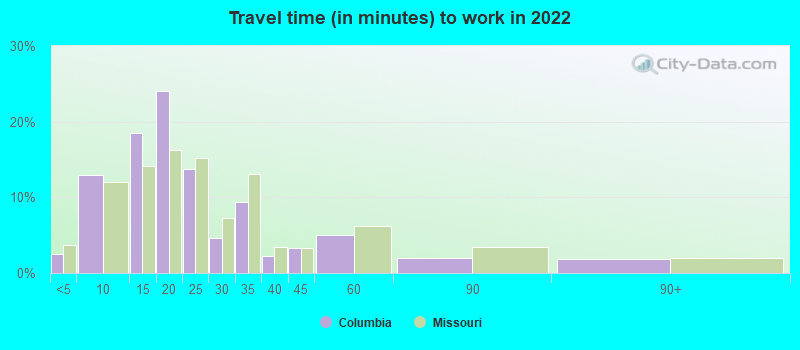
- Mean travel time to work (commute): 15.4 minutes
| Here: | 10.8 |
| Missouri average: | 11.1 |
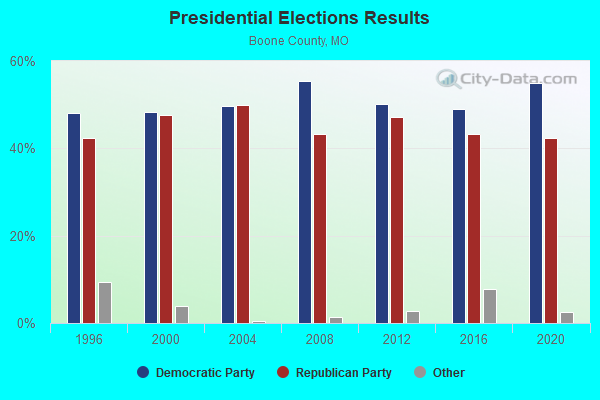
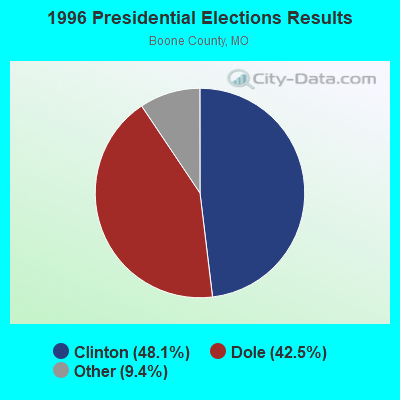
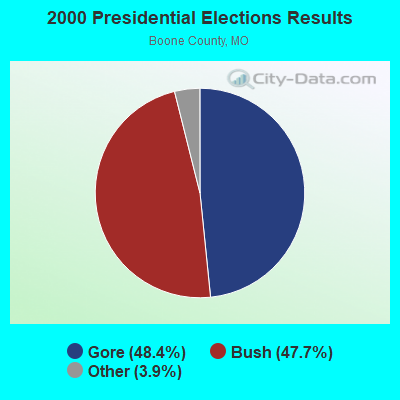
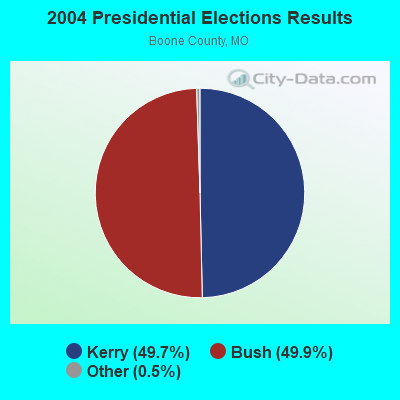
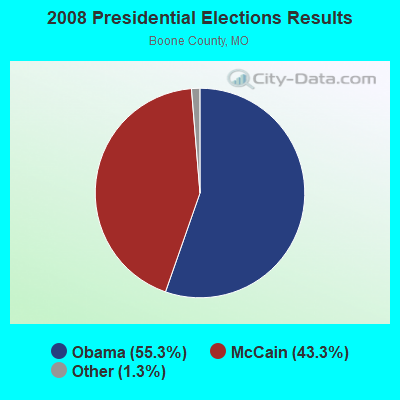
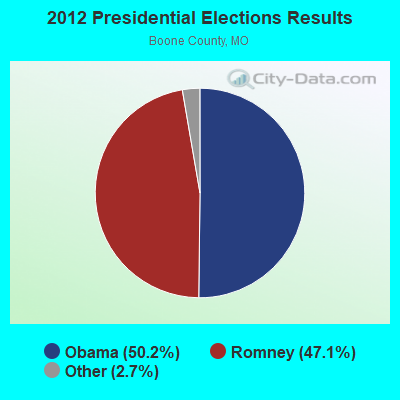
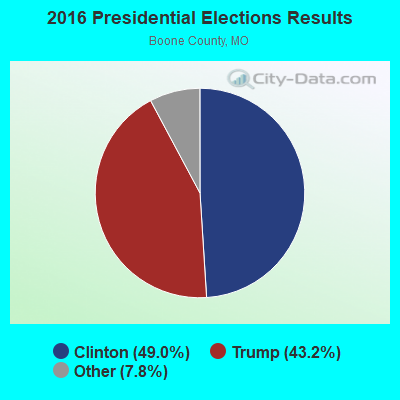
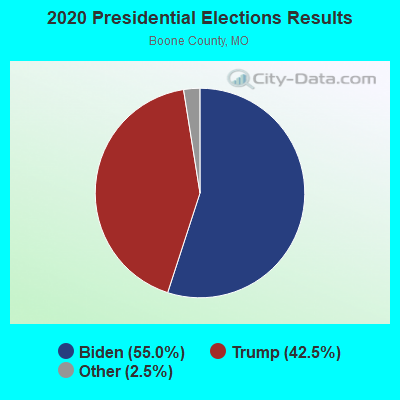
Graphs represent county-level data. Detailed 2008 Election Results
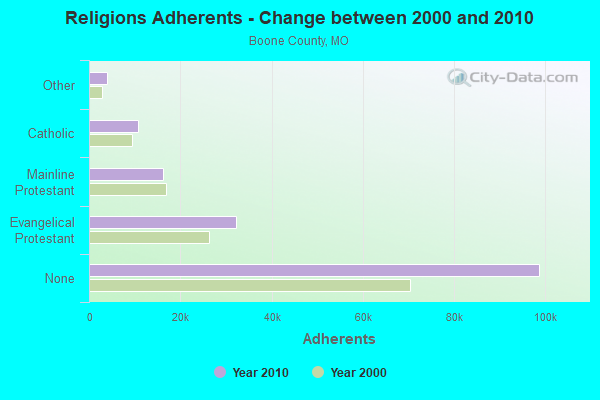
Religion statistics for Columbia, MO (based on Boone County data)
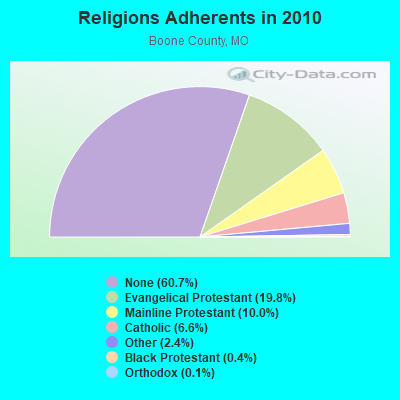
| Religion | Adherents | Congregations |
|---|---|---|
| Evangelical Protestant | 32,187 | 91 |
| Mainline Protestant | 16,273 | 39 |
| Catholic | 10,684 | 4 |
| Other | 3,873 | 23 |
| Black Protestant | 714 | 8 |
| Orthodox | 218 | 2 |
| None | 98,693 | - |
Food Environment Statistics:
| Boone County: | 1.45 / 10,000 pop. |
| Missouri: | 1.88 / 10,000 pop. |
| Boone County: | 0.13 / 10,000 pop. |
| Missouri: | 0.18 / 10,000 pop. |
| Boone County: | 0.26 / 10,000 pop. |
| Missouri: | 0.60 / 10,000 pop. |
| Boone County: | 4.60 / 10,000 pop. |
| Missouri: | 4.34 / 10,000 pop. |
| Boone County: | 10.06 / 10,000 pop. |
| State: | 7.37 / 10,000 pop. |
| Boone County: | 7.1% |
| State: | 8.8% |
| Here: | 28.7% |
| Missouri: | 29.6% |
| Boone County: | 15.3% |
| State: | 13.5% |
Health and Nutrition:
| Columbia: | 51.6% |
| Missouri: | 50.9% |
| Columbia: | 51.5% |
| Missouri: | 48.6% |
| This city: | 28.0 |
| Missouri: | 28.7 |
| This city: | 19.3% |
| Missouri: | 20.6% |
| This city: | 11.6% |
| Missouri: | 10.1% |
| Columbia: | 6.9 |
| Missouri: | 6.8 |
| Columbia: | 29.1% |
| State: | 34.3% |
| Columbia: | 60.5% |
| Missouri: | 57.5% |
| Columbia: | 81.9% |
| Missouri: | 79.3% |
More about Health and Nutrition of Columbia, MO Residents
| Local government employment and payroll (March 2022) | |||||
| Function | Full-time employees | Monthly full-time payroll | Average yearly full-time wage | Part-time employees | Monthly part-time payroll |
|---|---|---|---|---|---|
| Police Protection - Officers | 173 | $885,752 | $61,439 | 6 | $8,792 |
| Electric Power | 166 | $959,184 | $69,339 | 10 | $18,240 |
| Firefighters | 131 | $868,093 | $79,520 | 0 | $0 |
| Other Government Administration | 120 | $681,799 | $68,180 | 8 | $6,653 |
| Sewerage | 87 | $365,795 | $50,454 | 3 | $2,085 |
| Transit | 86 | $369,402 | $51,544 | 5 | $7,937 |
| Solid Waste Management | 80 | $299,578 | $44,937 | 3 | $4,374 |
| Parks and Recreation | 80 | $324,178 | $48,627 | 182 | $88,658 |
| Streets and Highways | 63 | $298,027 | $56,767 | 6 | $6,433 |
| Water Supply | 58 | $249,238 | $51,566 | 2 | $2,813 |
| Other and Unallocable | 58 | $303,909 | $62,878 | 0 | $0 |
| Health | 51 | $190,894 | $44,916 | 9 | $16,674 |
| Housing and Community Development (Local) | 50 | $264,671 | $63,521 | 1 | $1,411 |
| Financial Administration | 42 | $215,254 | $61,501 | 3 | $7,555 |
| Police - Other | 41 | $187,315 | $54,824 | 0 | $0 |
| Welfare | 17 | $83,908 | $59,229 | 2 | $928 |
| Judicial and Legal | 12 | $66,985 | $66,985 | 4 | $469 |
| Fire - Other | 8 | $64,230 | $96,345 | 0 | $0 |
| Airports | 5 | $31,737 | $76,169 | 3 | $4,384 |
| Totals for Government | 1,328 | $6,709,948 | $60,632 | 247 | $177,407 |
Columbia government finances - Expenditure in 2021 (per resident):
- Construction - Sewerage: $15,999,000 ($124.45)
Electric Utilities: $11,909,000 ($92.64)
Regular Highways: $8,923,000 ($69.41)
Air Transportation: $7,537,000 ($58.63)
Solid Waste Management: $4,603,000 ($35.81)
Parks and Recreation: $4,367,000 ($33.97)
Water Utilities: $3,362,000 ($26.15)
Parking Facilities: $599,000 ($4.66)
Transit Utilities: $369,000 ($2.87)
General Public Buildings: $355,000 ($2.76)
Police Protection: $77,000 ($0.60)
General - Other: $5,000 ($0.04)
- Current Operations - Electric Utilities: $109,709,000 ($853.40)
General - Other: $47,116,000 ($366.50)
Water Utilities: $21,162,000 ($164.61)
Police Protection: $19,664,000 ($152.96)
Solid Waste Management: $15,998,000 ($124.44)
Local Fire Protection: $13,453,000 ($104.65)
Parks and Recreation: $12,203,000 ($94.92)
Regular Highways: $9,736,000 ($75.73)
Sewerage: $7,605,000 ($59.16)
Central Staff Services: $6,928,000 ($53.89)
Health - Other: $6,629,000 ($51.57)
Transit Utilities: $6,211,000 ($48.31)
Air Transportation: $4,321,000 ($33.61)
Financial Administration: $4,270,000 ($33.22)
Judicial and Legal Services: $2,896,000 ($22.53)
Parking Facilities: $2,168,000 ($16.86)
Housing and Community Development: $889,000 ($6.92)
Public Welfare, Vendor Payments for Other Purposes: $872,000 ($6.78)
- Electric Utilities - Interest on Debt: $4,421,000 ($34.39)
- General - Interest on Debt: $3,710,000 ($28.86)
- Other Capital Outlay - Solid Waste Management: $5,948,000 ($46.27)
Local Fire Protection: $1,672,000 ($13.01)
Sewerage: $1,253,000 ($9.75)
Electric Utilities: $968,000 ($7.53)
Water Utilities: $618,000 ($4.81)
Parks and Recreation: $384,000 ($2.99)
General - Other: $232,000 ($1.80)
Police Protection: $105,000 ($0.82)
Regular Highways: $78,000 ($0.61)
Air Transportation: $43,000 ($0.33)
Parking Facilities: $20,000 ($0.16)
- Total Salaries and Wages: $123,616,000 ($961.58)
- Transit Utilities - Interest on Debt: $44,000 ($0.34)
- Water Utilities - Interest on Debt: $2,017,000 ($15.69)
Columbia government finances - Revenue in 2021 (per resident):
- Charges - Sewerage: $24,068,000 ($187.22)
Solid Waste Management: $22,892,000 ($178.07)
Other: $6,396,000 ($49.75)
Parking Facilities: $3,735,000 ($29.05)
Parks and Recreation: $3,234,000 ($25.16)
Air Transportation: $1,098,000 ($8.54)
- Federal Intergovernmental - Air Transportation: $4,322,000 ($33.62)
Transit Utilities: $2,269,000 ($17.65)
Highways: $2,105,000 ($16.37)
Housing and Community Development: $1,397,000 ($10.87)
Health and Hospitals: $657,000 ($5.11)
Other: $520,000 ($4.04)
Sewerage: $43,000 ($0.33)
Water Utilities: $17,000 ($0.13)
- Local Intergovernmental - Electric Utilities: $12,124,000 ($94.31)
Water Utilities: $4,661,000 ($36.26)
Highways: $2,334,000 ($18.16)
Health and Hospitals: $1,557,000 ($12.11)
- Miscellaneous - General Revenue - Other: $9,109,000 ($70.86)
Interest Earnings: $7,820,000 ($60.83)
Fines and Forfeits: $803,000 ($6.25)
- Revenue - Electric Utilities: $128,950,000 ($1003.07)
Water Utilities: $26,202,000 ($203.82)
Transit Utilities: $1,196,000 ($9.30)
- State Intergovernmental - Highways: $2,976,000 ($23.15)
Other: $1,470,000 ($11.43)
Health and Hospitals: $1,272,000 ($9.89)
Transit Utilities: $44,000 ($0.34)
- Tax - General Sales and Gross Receipts: $47,289,000 ($367.85)
Property: $8,948,000 ($69.60)
Public Utilities Sales: $5,730,000 ($44.57)
Other Selective Sales: $3,694,000 ($28.73)
Motor Vehicle License: $1,499,000 ($11.66)
Other License: $918,000 ($7.14)
Occupation and Business License - Other: $778,000 ($6.05)
Tobacco Products Sales: $423,000 ($3.29)
Alcoholic Beverage License: $172,000 ($1.34)
Columbia government finances - Debt in 2021 (per resident):
- Long Term Debt - Beginning Outstanding - Unspecified Public Purpose: $321,628,000 ($2501.87)
Outstanding Unspecified Public Purpose: $314,090,000 ($2443.23)
Retired Unspecified Public Purpose: $160,948,000 ($1251.98)
Issue, Unspecified Public Purpose: $153,410,000 ($1193.34)
Beginning Outstanding - Public Debt for Private Purpose: $1,819,000 ($14.15)
Retired Nonguaranteed - Public Debt for Private Purpose: $1,355,000 ($10.54)
Outstanding Nonguaranteed - Industrial Revenue: $465,000 ($3.62)
Columbia government finances - Cash and Securities in 2021 (per resident):
- Bond Funds - Cash and Securities: $35,940,000 ($279.57)
- Other Funds - Cash and Securities: $498,279,000 ($3876.00)
- Sinking Funds - Cash and Securities: $17,177,000 ($133.62)
| Businesses in Columbia, MO | ||||
| Name | Count | Name | Count | |
|---|---|---|---|---|
| AMF Bowling | 1 | Little Caesars Pizza | 1 | |
| AT&T | 5 | Long John Silver's | 1 | |
| Abercrombie & Fitch | 1 | Lowe's | 1 | |
| Ace Hardware | 2 | Macy's | 1 | |
| Aeropostale | 1 | Marriott | 2 | |
| American Eagle Outfitters | 1 | Marshalls | 1 | |
| Ann Taylor | 1 | MasterBrand Cabinets | 17 | |
| Applebee's | 2 | Maurices | 1 | |
| Arby's | 2 | Mazda | 1 | |
| Ashley Furniture | 1 | McDonald's | 7 | |
| AutoZone | 1 | Men's Wearhouse | 1 | |
| BMW | 1 | Menards | 1 | |
| Barnes & Noble | 1 | Motel 6 | 2 | |
| Baskin-Robbins | 2 | Motherhood Maternity | 2 | |
| Bath & Body Works | 1 | New Balance | 7 | |
| Bed Bath & Beyond | 1 | New York & Co | 1 | |
| Big O Tires | 2 | Nike | 27 | |
| Blockbuster | 2 | Nissan | 1 | |
| Burger King | 3 | Office Depot | 1 | |
| Caribou Coffee | 2 | Old Navy | 1 | |
| Casual Male XL | 1 | Olive Garden | 1 | |
| Chevrolet | 1 | Outback | 1 | |
| Chico's | 1 | Outback Steakhouse | 1 | |
| Chipotle | 2 | Pac Sun | 1 | |
| Chuck E. Cheese's | 1 | Panera Bread | 3 | |
| Church's Chicken | 1 | Papa John's Pizza | 2 | |
| Cold Stone Creamery | 1 | Payless | 2 | |
| Coldwater Creek | 1 | Penske | 1 | |
| Comfort Suites | 1 | PetSmart | 1 | |
| Cracker Barrel | 1 | Pier 1 Imports | 1 | |
| Curves | 2 | Pizza Hut | 4 | |
| DHL | 2 | Plato's Closet | 1 | |
| Dairy Queen | 3 | Quality | 1 | |
| Days Inn | 1 | Quiznos | 2 | |
| Deb | 1 | RadioShack | 2 | |
| Decora Cabinetry | 8 | Ramada | 2 | |
| Dennys | 1 | Red Lobster | 1 | |
| Domino's Pizza | 4 | Red Roof Inn | 1 | |
| Econo Lodge | 1 | Ruby Tuesday | 2 | |
| Eddie Bauer | 1 | Rue21 | 1 | |
| Express | 1 | SAS Shoes | 1 | |
| Extended Stay America | 1 | SONIC Drive-In | 6 | |
| Fashion Bug | 1 | Sam's Club | 1 | |
| FedEx | 33 | Sears | 2 | |
| Finish Line | 1 | Sephora | 1 | |
| Firestone Complete Auto Care | 1 | Shoe Carnival | 1 | |
| Foot Locker | 1 | Slumberland | 1 | |
| Ford | 1 | Spencer Gifts | 1 | |
| GNC | 2 | Sprint Nextel | 4 | |
| GameStop | 2 | Staples | 1 | |
| Gap | 1 | Starbucks | 5 | |
| Goodwill | 2 | Steak 'n Shake | 2 | |
| Gymboree | 1 | Subaru | 1 | |
| H&R Block | 6 | Subway | 11 | |
| Hardee's | 3 | Super 8 | 3 | |
| Hilton | 2 | T-Mobile | 7 | |
| Hobby Lobby | 1 | T.G.I. Driday's | 1 | |
| Holiday Inn | 4 | Taco Bell | 6 | |
| Hollister Co. | 1 | Talbots | 1 | |
| Home Depot | 1 | Target | 1 | |
| Honda | 1 | The Room Place | 1 | |
| Hot Topic | 1 | Toys"R"Us | 1 | |
| Houlihan's | 1 | Travelodge | 1 | |
| Hyundai | 1 | U-Haul | 5 | |
| IHOP | 1 | U.S. Cellular | 3 | |
| JCPenney | 1 | UPS | 25 | |
| Jimmy John's | 2 | Vans | 2 | |
| JoS. A. Bank | 1 | Verizon Wireless | 1 | |
| Jones New York | 3 | Victoria's Secret | 1 | |
| Journeys | 1 | Volkswagen | 1 | |
| Justice | 1 | Waffle House | 2 | |
| KFC | 3 | Walgreens | 2 | |
| Kohl's | 1 | Walmart | 3 | |
| Kroger | 3 | Wendy's | 2 | |
| La Quinta | 1 | Wet Seal | 1 | |
| La-Z-Boy | 2 | White Castle | 1 | |
| Lane Bryant | 1 | Wingate | 1 | |
| LensCrafters | 1 | YMCA | 1 | |
Strongest AM radio stations in Columbia:
- KFRU (1400 AM; 1 kW; COLUMBIA, MO; Owner: COLUMBIA AM, INC.)
- KTGR (1580 AM; 0 kW; COLUMBIA, MO)
- KWOS (950 AM; 5 kW; JEFFERSON CITY, MO; Owner: ZIMMER RADIO OF MID-MISSOURI, INC.)
- KLIK (1240 AM; 5 kW; JEFFERSON CITY, MO; Owner: PREMIER RADIO GROUP)
- WHB (810 AM; 50 kW; KANSAS CITY, MO; Owner: UNION BROADCASTING, INC.)
- KXEN (1010 AM; 50 kW; FESTUS-ST. LOUIS, MO; Owner: BDJ RADIO ENTERPRISES, LLC)
- KMOX (1120 AM; 50 kW; ST. LOUIS, MO; Owner: INFINITY BROADCASTING OPERATIONS, INC.)
- KRMS (1150 AM; 10 kW; OSAGE BEACH, MO; Owner: VIPER COMMUNICATIONS, INC)
- KFAL (900 AM; 1 kW; FULTON, MO; Owner: ZIMMER RADIO OF MID-MISSOURI, INC.)
- KKHK (1250 AM; 25 kW; KANSAS CITY, KS)
- KWRT (1370 AM; 1 kW; BOONVILLE, MO; Owner: BIG COUNTRY OF MISSOURI, INC.)
- WHO (1040 AM; 50 kW; DES MOINES, IA; Owner: CITICASTERS LICENSES, L.P.)
- KHMO (1070 AM; 5 kW; HANNIBAL, MO)
Strongest FM radio stations in Columbia:
- K280EJ (103.9 FM; COLUMBIA, MO; Owner: GOOD NEWS PUBLISHERS, INC.)
- KBXR (102.3 FM; COLUMBIA, MO; Owner: FT. SMITH FM, INC.)
- KWWC-FM (90.5 FM; COLUMBIA, MO; Owner: STEPHENS COLLEGE)
- KPLA (101.5 FM; COLUMBIA, MO; Owner: COLUMBIA FM, INC.)
- KBIA (91.3 FM; COLUMBIA, MO; Owner: UNIVERSITY OF MISSOURI)
- KCOU (88.1 FM; COLUMBIA, MO; Owner: THE CURATORS OF THE UNIVERSITY OF MI)
- KCMQ (96.7 FM; COLUMBIA, MO; Owner: ZIMMER RADIO OF MID-MISSOURI, INC.)
- K276DI (103.1 FM; COLUMBIA, ETC., MO; Owner: LIGHT WAVES, INC.)
- KOQL (106.1 FM; ASHLAND, MO; Owner: MID-MISSOURI BROADCASTING, INC.)
- KTXY (106.9 FM; JEFFERSON CITY, MO; Owner: ZIMMER RADIO OF MID-MISSOURI, INC.)
- KWWR (95.7 FM; MEXICO, MO; Owner: KXEO RADIO, INC.)
- KOPN (89.5 FM; COLUMBIA, MO; Owner: NEW WAVE CORPORATION)
- KCLR-FM (99.3 FM; BOONVILLE, MO; Owner: ZIMMER RADIO OF MID-MISSOURI, INC)
- KWRT-FM (93.1 FM; BOONVILLE, MO; Owner: BIG COUNTRY OF MISSOURI, INC.)
- KSSZ (93.9 FM; FAYETTE, MO; Owner: ZIMMER RADIO OF MID-MISSOURI, INC.)
- KMFC (92.1 FM; CENTRALIA, MO; Owner: THE CLAIR GROUP)
- KRES (104.7 FM; MOBERLY, MO; Owner: KWIX, INC)
- KBBM (100.1 FM; JEFFERSON CITY, MO; Owner: PREMIER RADIO GROUP)
- KJLU (88.9 FM; JEFFERSON CITY, MO; Owner: LINCOLN UNIVERSITY OF MISSOURI)
- KATI (94.3 FM; CALIFORNIA, MO; Owner: ZIMMER RADIO OF MID-MISSOURI, INC.)
TV broadcast stations around Columbia:
- K02NQ (Channel 2; COLUMBIA, MO; Owner: CHELSEY BROADCASTING COMPANY OF COLUMBIA, LLC)
- K11SN (Channel 11; COLUMBIA, MO; Owner: RICHARD E. KOENIG)
- K56AU (Channel 56; COLUMBIA, MO; Owner: TRINITY BROADCASTING NETWORK)
- KOMU-TV (Channel 8; COLUMBIA, MO; Owner: THE CURATORS OF THE UNIVERSITY OF MISSOURI)
- K32FH (Channel 32; WARRENSBURG, MO; Owner: ROGER E. HARDERS)
- KMIZ (Channel 17; COLUMBIA, MO; Owner: CHELSEY BROADCASTING COMPANY OF COLUMBIA, LLC)
- K43EU (Channel 43; ST LOUIS, MO; Owner: ROGER E. HARDERS)
- K41OI (Channel 41; JEFFERSON CITY, MO; Owner: TRINITY BROADCASTING NETWORK)
- KMOS-TV (Channel 6; SEDALIA, MO; Owner: BOARD OF GOVERNORS OF CENTRAL MISSOURI STATE UNIVERSITY)
- KNLJ (Channel 25; JEFFERSON CITY, MO; Owner: NEW LIFE EVANGELISTIC CENTER, INC.)
- KRCG (Channel 13; JEFFERSON CITY, MO; Owner: MEL WHEELER INC.)
Medal of Honor Recipients
Medal of Honor Recipient born in Columbia: Leon W. Johnson.
- National Bridge Inventory (NBI) Statistics
- 255Number of bridges
- 2,582ft / 787mTotal length
- $8,034,000Total costs
- 2,451,720Total average daily traffic
- 382,857Total average daily truck traffic
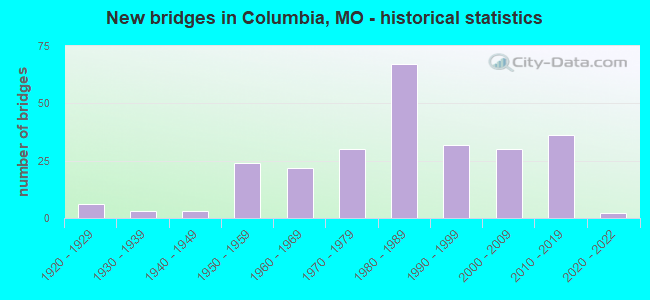
- New bridges - historical statistics
- 61920-1929
- 31930-1939
- 31940-1949
- 241950-1959
- 221960-1969
- 301970-1979
- 671980-1989
- 321990-1999
- 302000-2009
- 362010-2019
- 22020-2022
FCC Registered Antenna Towers: 358 (See the full list of FCC Registered Antenna Towers)
FCC Registered Commercial Land Mobile Towers: 11 (See the full list of FCC Registered Commercial Land Mobile Towers in Columbia, MO)
FCC Registered Private Land Mobile Towers: 8 (See the full list of FCC Registered Private Land Mobile Towers)
FCC Registered Broadcast Land Mobile Towers: 109 (See the full list of FCC Registered Broadcast Land Mobile Towers)
FCC Registered Microwave Towers: 162 (See the full list of FCC Registered Microwave Towers in this town)
FCC Registered Paging Towers: 17 (See the full list of FCC Registered Paging Towers)
FCC Registered Maritime Coast & Aviation Ground Towers: 10 (See the full list of FCC Registered Maritime Coast & Aviation Ground Towers)
FCC Registered Amateur Radio Licenses: 623 (See the full list of FCC Registered Amateur Radio Licenses in Columbia)
FAA Registered Aircraft Manufacturers and Dealers: 13 (See the full list of FAA Registered Manufacturers and Dealers in Columbia)
FAA Registered Aircraft: 126 (See the full list of FAA Registered Aircraft)
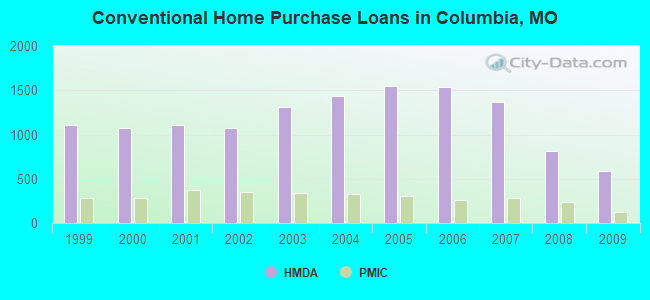
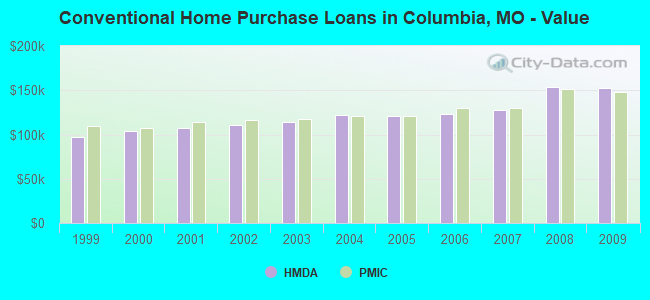
| Home Mortgage Disclosure Act Aggregated Statistics For Year 2009 (Based on 13 full and 8 partial tracts) | ||||||||||||||
| A) FHA, FSA/RHS & VA Home Purchase Loans | B) Conventional Home Purchase Loans | C) Refinancings | D) Home Improvement Loans | E) Loans on Dwellings For 5+ Families | F) Non-occupant Loans on < 5 Family Dwellings (A B C & D) | G) Loans On Manufactured Home Dwelling (A B C & D) | ||||||||
|---|---|---|---|---|---|---|---|---|---|---|---|---|---|---|
| Number | Average Value | Number | Average Value | Number | Average Value | Number | Average Value | Number | Average Value | Number | Average Value | Number | Average Value | |
| LOANS ORIGINATED | 336 | $139,447 | 590 | $152,056 | 2,000 | $152,403 | 93 | $100,922 | 10 | $1,033,019 | 248 | $146,580 | 7 | $36,084 |
| APPLICATIONS APPROVED, NOT ACCEPTED | 9 | $109,797 | 35 | $146,956 | 125 | $153,171 | 12 | $36,717 | 0 | $0 | 8 | $132,778 | 3 | $43,973 |
| APPLICATIONS DENIED | 28 | $137,799 | 52 | $117,163 | 298 | $163,766 | 30 | $54,609 | 3 | $184,667 | 31 | $138,654 | 6 | $37,643 |
| APPLICATIONS WITHDRAWN | 37 | $126,651 | 67 | $151,638 | 368 | $150,772 | 15 | $86,845 | 1 | $2,930,000 | 24 | $119,610 | 1 | $42,190 |
| FILES CLOSED FOR INCOMPLETENESS | 6 | $102,665 | 4 | $143,542 | 77 | $177,942 | 2 | $28,690 | 0 | $0 | 3 | $144,313 | 0 | $0 |
Detailed mortgage data for all 21 tracts in Columbia, MO
| Private Mortgage Insurance Companies Aggregated Statistics For Year 2009 (Based on 11 full and 8 partial tracts) | ||||||
| A) Conventional Home Purchase Loans | B) Refinancings | C) Non-occupant Loans on < 5 Family Dwellings (A & B) | ||||
|---|---|---|---|---|---|---|
| Number | Average Value | Number | Average Value | Number | Average Value | |
| LOANS ORIGINATED | 128 | $148,444 | 126 | $168,334 | 0 | $0 |
| APPLICATIONS APPROVED, NOT ACCEPTED | 22 | $175,241 | 28 | $169,338 | 1 | $182,510 |
| APPLICATIONS DENIED | 19 | $118,531 | 9 | $163,281 | 2 | $94,035 |
| APPLICATIONS WITHDRAWN | 5 | $119,994 | 6 | $153,657 | 0 | $0 |
| FILES CLOSED FOR INCOMPLETENESS | 3 | $136,103 | 3 | $100,463 | 0 | $0 |
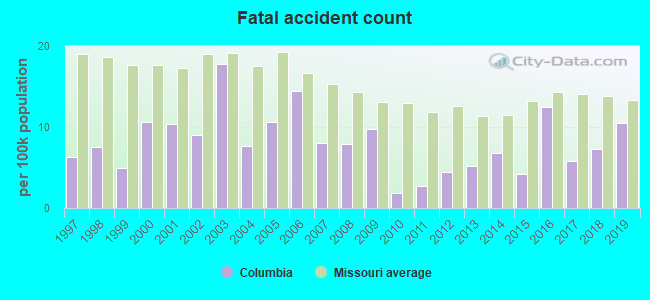
2002 - 2018 National Fire Incident Reporting System (NFIRS) incidents
- Fire incident types reported to NFIRS in Columbia, MO
- 2,41741.7%Structure Fires
- 2,15537.2%Outside Fires
- 1,10419.1%Mobile Property/Vehicle Fires
- 1142.0%Other
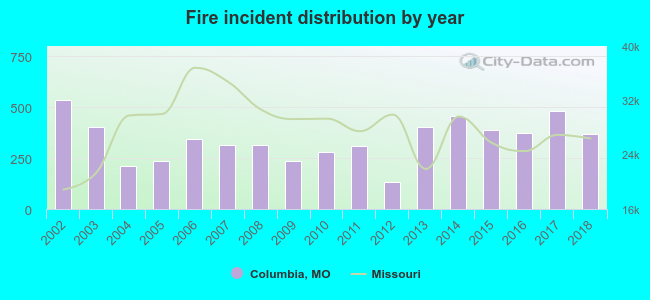 Based on the data from the years 2002 - 2018 the average number of fire incidents per year is 341. The highest number of fires - 534 took place in 2002, and the least - 131 in 2012. The data has a decreasing trend.
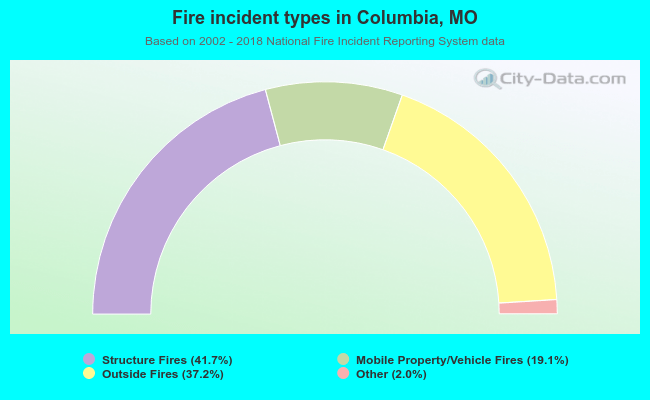 When looking into fire subcategories, the most incidents belonged to: Structure Fires (41.7%), and Outside Fires (37.2%).
Fire-safe hotels and motels in Columbia, Missouri:
- Americas Best Value Inn, 1900 1-70 Dr SW, Columbia, Missouri 65203 , Phone: (573) 445-8511, Fax: (573) 445-7991
- Campus Inn, 1112 Stadium Dr, Columbia, Missouri 65201 , Phone: (573) 449-2731, Fax: (573) 449-6691
- Drury Inn Columbia Stadium Boulevard, 1000 Knipp St, Columbia, Missouri 65203 , Phone: (573) 445-1800
- Baymont Inn & Suites, 801 Keene St, Columbia, Missouri 65201 , Phone: (573) 449-4422, Fax: (573) 442-1110
- Super 8, 3216 Clark Ln, Columbia, Missouri 65202 , Phone: (573) 474-8488, Fax: (573) 474-4180
- Best Western Plus, 2904 Clark Ln, Columbia, Missouri 65202 , Phone: (573) 397-6471, Fax: (573) 397-6472
- Howard Johnson, 3100 Interstate 70 Dr SE, Columbia, Missouri 65201 , Phone: (573) 474-6161, Fax: (573) 474-9323
- Staybridge Suites, 805 Keene St, Columbia, Missouri 65201 , Phone: (573) 442-8600, Fax: (573) 441-9041
- 23 other hotels and motels
| Most common first names in Columbia, MO among deceased individuals | ||
| Name | Count | Lived (average) |
|---|---|---|
| Mary | 541 | 80.1 years |
| William | 464 | 74.4 years |
| James | 413 | 71.6 years |
| John | 396 | 73.6 years |
| Robert | 339 | 72.2 years |
| Charles | 253 | 75.4 years |
| Helen | 208 | 79.9 years |
| Dorothy | 199 | 78.4 years |
| George | 193 | 77.2 years |
| Ruth | 179 | 82.0 years |
| Most common last names in Columbia, MO among deceased individuals | ||
| Last name | Count | Lived (average) |
|---|---|---|
| Smith | 179 | 75.3 years |
| Johnson | 154 | 76.2 years |
| Brown | 136 | 75.5 years |
| Williams | 135 | 76.1 years |
| Jones | 121 | 76.4 years |
| Turner | 109 | 76.3 years |
| Miller | 99 | 77.8 years |
| Davis | 96 | 73.7 years |
| Martin | 86 | 73.0 years |
| Nichols | 79 | 74.5 years |
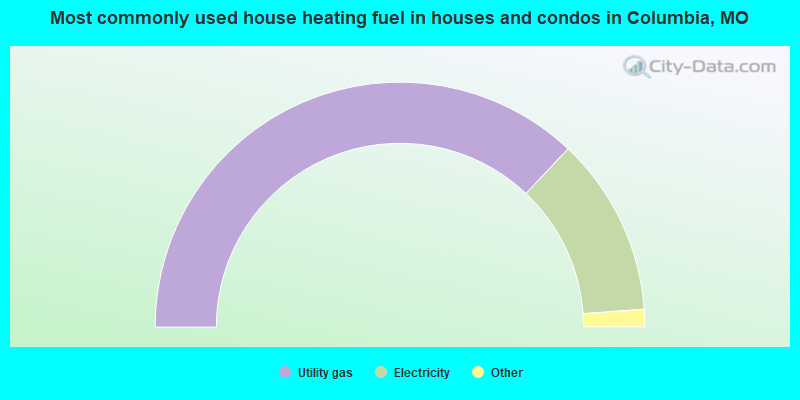
- 74.0%Utility gas
- 23.6%Electricity
- 1.3%Bottled, tank, or LP gas
- 0.3%Other fuel
- 0.3%Wood
- 0.2%No fuel used
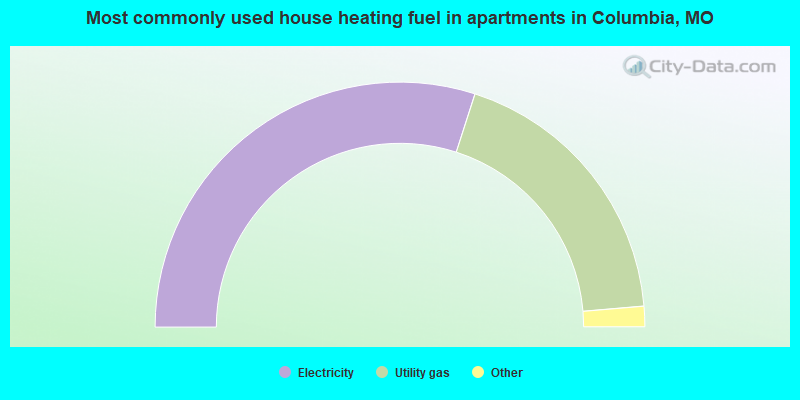
- 60.0%Electricity
- 37.4%Utility gas
- 1.9%Bottled, tank, or LP gas
- 0.4%No fuel used
- 0.2%Wood
Columbia compared to Missouri state average:
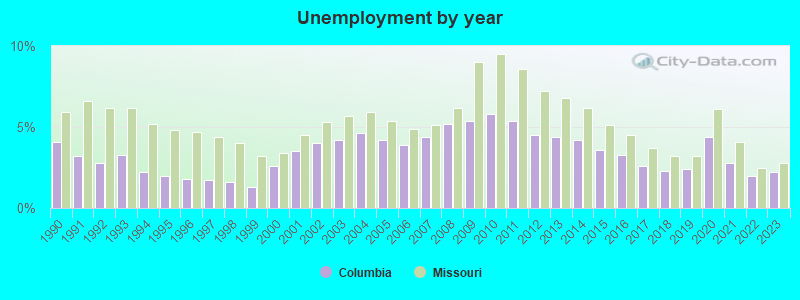
- Unemployed percentage below state average.
- Median age below state average.
- Foreign-born population percentage significantly above state average.
- Renting percentage above state average.
- Length of stay since moving in below state average.
- House age below state average.
- Number of college students significantly above state average.
- Percentage of population with a bachelor's degree or higher significantly above state average.
Columbia on our top lists:
- #3 on the list of "Top 101 cities with largest percentage of females in occupations: food preparation and serving related occupations (population 50,000+)"
- #19 on the list of "Top 101 cities with largest percentage of females in industries: accommodation and food services (population 50,000+)"
- #20 on the list of "Top 101 cities with the most people having Doctorate degrees (population 50,000+)"
- #23 on the list of "Top 100 cities with youngest residents (pop. 50,000+)"
- #24 on the list of "Top 101 cities with largest percentage of males in industries: educational services (population 50,000+)"
- #25 on the list of "Top 101 cities with largest percentage of females in occupations: education, training, and library occupations (population 50,000+)"
- #25 on the list of "Top 100 cities with shortest commuting times (pop. 50,000+)"
- #30 on the list of "Top 101 cities with largest percentage of females in occupations: life, physical, and social science occupations (population 50,000+)"
- #31 on the list of "Top 101 cities with largest percentage of males in occupations: personal care and service occupations (population 50,000+)"
- #32 on the list of "Top 101 cities with the lowest percentage of family households, population 100,000+"
- #32 on the list of "Top 101 cities with the smallest percentage of high school students in private schools (3,000+ students)"
- #34 on the list of "Top 101 cities with largest percentage of females in industries: educational services (population 50,000+)"
- #35 on the list of "Top 101 cities with largest percentage of males in occupations: education, training, and library occupations (population 50,000+)"
- #35 on the list of "Top 101 cities with the most recent year of entry for the foreign-born population (2,000+ people)+"
- #43 on the list of "Top 101 cities with most building permits per 10,000 residents (population 50,000+)"
- #50 on the list of "Top 101 cities with largest percentage of males in industries: arts, entertainment, and recreation (population 50,000+)"
- #51 on the list of "Top 100 cities with highest percentage of college students (pop. 50,000+)"
- #53 on the list of "Top 101 cities with largest percentage of males in industries: utilities (population 50,000+)"
- #57 on the list of "Top 101 cities with the most people having Master's or Doctorate degrees (population 50,000+)"
- #62 on the list of "Top 101 cities where the highest percentage of females (15+ years) which never married (with at least 10,000 females in this group)"
- #64 on the list of "Top 101 counties with highest percentage of residents voting for 3rd party candidates in the 2012 Presidential Election (pop. 50,000+)"
- #85 on the list of "Top 101 counties with the lowest number of deaths per 1000 residents 2007-2013 (pop. 50,000+)"

|
|
Total of 845 patent applications in 2008-2024.