Cathedral City, California Submit your own pictures of this city and show them to the world
OSM Map
General Map
Google Map
MSN Map
OSM Map
General Map
Google Map
MSN Map
OSM Map
General Map
Google Map
MSN Map
OSM Map
General Map
Google Map
MSN Map
Please wait while loading the map...
Population in 2022: 52,494 (100% urban, 0% rural). Population change since 2000: +23.1%Males: 27,113 Females: 25,381
March 2022 cost of living index in Cathedral City: 83.1 (low, U.S. average is 100) Percentage of residents living in poverty in 2022: 17.3%for White Non-Hispanic residents , 31.1% for Black residents , 21.0% for Hispanic or Latino residents , 25.8% for American Indian residents , 6.2% for Native Hawaiian and other Pacific Islander residents , 23.0% for other race residents , 14.6% for two or more races residents )
Profiles of local businesses
Business Search - 14 Million verified businesses
Data:
Median household income ($)
Median household income (% change since 2000)
Household income diversity
Ratio of average income to average house value (%)
Ratio of average income to average rent
Median household income ($) - White
Median household income ($) - Black or African American
Median household income ($) - Asian
Median household income ($) - Hispanic or Latino
Median household income ($) - American Indian and Alaska Native
Median household income ($) - Multirace
Median household income ($) - Other Race
Median household income for houses/condos with a mortgage ($)
Median household income for apartments without a mortgage ($)
Races - White alone (%)
Races - White alone (% change since 2000)
Races - Black alone (%)
Races - Black alone (% change since 2000)
Races - American Indian alone (%)
Races - American Indian alone (% change since 2000)
Races - Asian alone (%)
Races - Asian alone (% change since 2000)
Races - Hispanic (%)
Races - Hispanic (% change since 2000)
Races - Native Hawaiian and Other Pacific Islander alone (%)
Races - Native Hawaiian and Other Pacific Islander alone (% change since 2000)
Races - Two or more races (%)
Races - Two or more races (% change since 2000)
Races - Other race alone (%)
Races - Other race alone (% change since 2000)
Racial diversity
Unemployment (%)
Unemployment (% change since 2000)
Unemployment (%) - White
Unemployment (%) - Black or African American
Unemployment (%) - Asian
Unemployment (%) - Hispanic or Latino
Unemployment (%) - American Indian and Alaska Native
Unemployment (%) - Multirace
Unemployment (%) - Other Race
Population density (people per square mile)
Population - Males (%)
Population - Females (%)
Population - Males (%) - White
Population - Males (%) - Black or African American
Population - Males (%) - Asian
Population - Males (%) - Hispanic or Latino
Population - Males (%) - American Indian and Alaska Native
Population - Males (%) - Multirace
Population - Males (%) - Other Race
Population - Females (%) - White
Population - Females (%) - Black or African American
Population - Females (%) - Asian
Population - Females (%) - Hispanic or Latino
Population - Females (%) - American Indian and Alaska Native
Population - Females (%) - Multirace
Population - Females (%) - Other Race
Coronavirus confirmed cases (May 23, 2024)
Deaths caused by coronavirus (May 23, 2024)
Coronavirus confirmed cases (per 100k population) (May 23, 2024)
Deaths caused by coronavirus (per 100k population) (May 23, 2024)
Daily increase in number of cases (May 23, 2024)
Weekly increase in number of cases (May 23, 2024)
Cases doubled (in days) (May 23, 2024)
Hospitalized patients (Apr 18, 2022)
Negative test results (Apr 18, 2022)
Total test results (Apr 18, 2022)
COVID Vaccine doses distributed (per 100k population) (Sep 19, 2023)
COVID Vaccine doses administered (per 100k population) (Sep 19, 2023)
COVID Vaccine doses distributed (Sep 19, 2023)
COVID Vaccine doses administered (Sep 19, 2023)
Likely homosexual households (%)
Likely homosexual households (% change since 2000)
Likely homosexual households - Lesbian couples (%)
Likely homosexual households - Lesbian couples (% change since 2000)
Likely homosexual households - Gay men (%)
Likely homosexual households - Gay men (% change since 2000)
Cost of living index
Median gross rent ($)
Median contract rent ($)
Median monthly housing costs ($)
Median house or condo value ($)
Median house or condo value ($ change since 2000)
Mean house or condo value by units in structure - 1, detached ($)
Mean house or condo value by units in structure - 1, attached ($)
Mean house or condo value by units in structure - 2 ($)
Mean house or condo value by units in structure by units in structure - 3 or 4 ($)
Mean house or condo value by units in structure - 5 or more ($)
Mean house or condo value by units in structure - Boat, RV, van, etc. ($)
Mean house or condo value by units in structure - Mobile home ($)
Median house or condo value ($) - White
Median house or condo value ($) - Black or African American
Median house or condo value ($) - Asian
Median house or condo value ($) - Hispanic or Latino
Median house or condo value ($) - American Indian and Alaska Native
Median house or condo value ($) - Multirace
Median house or condo value ($) - Other Race
Median resident age
Resident age diversity
Median resident age - Males
Median resident age - Females
Median resident age - White
Median resident age - Black or African American
Median resident age - Asian
Median resident age - Hispanic or Latino
Median resident age - American Indian and Alaska Native
Median resident age - Multirace
Median resident age - Other Race
Median resident age - Males - White
Median resident age - Males - Black or African American
Median resident age - Males - Asian
Median resident age - Males - Hispanic or Latino
Median resident age - Males - American Indian and Alaska Native
Median resident age - Males - Multirace
Median resident age - Males - Other Race
Median resident age - Females - White
Median resident age - Females - Black or African American
Median resident age - Females - Asian
Median resident age - Females - Hispanic or Latino
Median resident age - Females - American Indian and Alaska Native
Median resident age - Females - Multirace
Median resident age - Females - Other Race
Commute - mean travel time to work (minutes)
Travel time to work - Less than 5 minutes (%)
Travel time to work - Less than 5 minutes (% change since 2000)
Travel time to work - 5 to 9 minutes (%)
Travel time to work - 5 to 9 minutes (% change since 2000)
Travel time to work - 10 to 19 minutes (%)
Travel time to work - 10 to 19 minutes (% change since 2000)
Travel time to work - 20 to 29 minutes (%)
Travel time to work - 20 to 29 minutes (% change since 2000)
Travel time to work - 30 to 39 minutes (%)
Travel time to work - 30 to 39 minutes (% change since 2000)
Travel time to work - 40 to 59 minutes (%)
Travel time to work - 40 to 59 minutes (% change since 2000)
Travel time to work - 60 to 89 minutes (%)
Travel time to work - 60 to 89 minutes (% change since 2000)
Travel time to work - 90 or more minutes (%)
Travel time to work - 90 or more minutes (% change since 2000)
Marital status - Never married (%)
Marital status - Now married (%)
Marital status - Separated (%)
Marital status - Widowed (%)
Marital status - Divorced (%)
Median family income ($)
Median family income (% change since 2000)
Median non-family income ($)
Median non-family income (% change since 2000)
Median per capita income ($)
Median per capita income (% change since 2000)
Median family income ($) - White
Median family income ($) - Black or African American
Median family income ($) - Asian
Median family income ($) - Hispanic or Latino
Median family income ($) - American Indian and Alaska Native
Median family income ($) - Multirace
Median family income ($) - Other Race
Median year house/condo built
Median year apartment built
Year house built - Built 2005 or later (%)
Year house built - Built 2000 to 2004 (%)
Year house built - Built 1990 to 1999 (%)
Year house built - Built 1980 to 1989 (%)
Year house built - Built 1970 to 1979 (%)
Year house built - Built 1960 to 1969 (%)
Year house built - Built 1950 to 1959 (%)
Year house built - Built 1940 to 1949 (%)
Year house built - Built 1939 or earlier (%)
Average household size
Household density (households per square mile)
Average household size - White
Average household size - Black or African American
Average household size - Asian
Average household size - Hispanic or Latino
Average household size - American Indian and Alaska Native
Average household size - Multirace
Average household size - Other Race
Occupied housing units (%)
Vacant housing units (%)
Owner occupied housing units (%)
Renter occupied housing units (%)
Vacancy status - For rent (%)
Vacancy status - For sale only (%)
Vacancy status - Rented or sold, not occupied (%)
Vacancy status - For seasonal, recreational, or occasional use (%)
Vacancy status - For migrant workers (%)
Vacancy status - Other vacant (%)
Residents with income below the poverty level (%)
Residents with income below 50% of the poverty level (%)
Children below poverty level (%)
Poor families by family type - Married-couple family (%)
Poor families by family type - Male, no wife present (%)
Poor families by family type - Female, no husband present (%)
Poverty status for native-born residents (%)
Poverty status for foreign-born residents (%)
Poverty among high school graduates not in families (%)
Poverty among people who did not graduate high school not in families (%)
Residents with income below the poverty level (%) - White
Residents with income below the poverty level (%) - Black or African American
Residents with income below the poverty level (%) - Asian
Residents with income below the poverty level (%) - Hispanic or Latino
Residents with income below the poverty level (%) - American Indian and Alaska Native
Residents with income below the poverty level (%) - Multirace
Residents with income below the poverty level (%) - Other Race
Air pollution - Air Quality Index (AQI)
Air pollution - CO
Air pollution - NO2
Air pollution - SO2
Air pollution - Ozone
Air pollution - PM10
Air pollution - PM25
Air pollution - Pb
Crime - Murders per 100,000 population
Crime - Rapes per 100,000 population
Crime - Robberies per 100,000 population
Crime - Assaults per 100,000 population
Crime - Burglaries per 100,000 population
Crime - Thefts per 100,000 population
Crime - Auto thefts per 100,000 population
Crime - Arson per 100,000 population
Crime - City-data.com crime index
Crime - Violent crime index
Crime - Property crime index
Crime - Murders per 100,000 population (5 year average)
Crime - Rapes per 100,000 population (5 year average)
Crime - Robberies per 100,000 population (5 year average)
Crime - Assaults per 100,000 population (5 year average)
Crime - Burglaries per 100,000 population (5 year average)
Crime - Thefts per 100,000 population (5 year average)
Crime - Auto thefts per 100,000 population (5 year average)
Crime - Arson per 100,000 population (5 year average)
Crime - City-data.com crime index (5 year average)
Crime - Violent crime index (5 year average)
Crime - Property crime index (5 year average)
1996 Presidential Elections Results (%) - Democratic Party (Clinton)
1996 Presidential Elections Results (%) - Republican Party (Dole)
1996 Presidential Elections Results (%) - Other
2000 Presidential Elections Results (%) - Democratic Party (Gore)
2000 Presidential Elections Results (%) - Republican Party (Bush)
2000 Presidential Elections Results (%) - Other
2004 Presidential Elections Results (%) - Democratic Party (Kerry)
2004 Presidential Elections Results (%) - Republican Party (Bush)
2004 Presidential Elections Results (%) - Other
2008 Presidential Elections Results (%) - Democratic Party (Obama)
2008 Presidential Elections Results (%) - Republican Party (McCain)
2008 Presidential Elections Results (%) - Other
2012 Presidential Elections Results (%) - Democratic Party (Obama)
2012 Presidential Elections Results (%) - Republican Party (Romney)
2012 Presidential Elections Results (%) - Other
2016 Presidential Elections Results (%) - Democratic Party (Clinton)
2016 Presidential Elections Results (%) - Republican Party (Trump)
2016 Presidential Elections Results (%) - Other
2020 Presidential Elections Results (%) - Democratic Party (Biden)
2020 Presidential Elections Results (%) - Republican Party (Trump)
2020 Presidential Elections Results (%) - Other
Ancestries Reported - Arab (%)
Ancestries Reported - Czech (%)
Ancestries Reported - Danish (%)
Ancestries Reported - Dutch (%)
Ancestries Reported - English (%)
Ancestries Reported - French (%)
Ancestries Reported - French Canadian (%)
Ancestries Reported - German (%)
Ancestries Reported - Greek (%)
Ancestries Reported - Hungarian (%)
Ancestries Reported - Irish (%)
Ancestries Reported - Italian (%)
Ancestries Reported - Lithuanian (%)
Ancestries Reported - Norwegian (%)
Ancestries Reported - Polish (%)
Ancestries Reported - Portuguese (%)
Ancestries Reported - Russian (%)
Ancestries Reported - Scotch-Irish (%)
Ancestries Reported - Scottish (%)
Ancestries Reported - Slovak (%)
Ancestries Reported - Subsaharan African (%)
Ancestries Reported - Swedish (%)
Ancestries Reported - Swiss (%)
Ancestries Reported - Ukrainian (%)
Ancestries Reported - United States (%)
Ancestries Reported - Welsh (%)
Ancestries Reported - West Indian (%)
Ancestries Reported - Other (%)
Educational Attainment - No schooling completed (%)
Educational Attainment - Less than high school (%)
Educational Attainment - High school or equivalent (%)
Educational Attainment - Less than 1 year of college (%)
Educational Attainment - 1 or more years of college (%)
Educational Attainment - Associate degree (%)
Educational Attainment - Bachelor's degree (%)
Educational Attainment - Master's degree (%)
Educational Attainment - Professional school degree (%)
Educational Attainment - Doctorate degree (%)
School Enrollment - Nursery, preschool (%)
School Enrollment - Kindergarten (%)
School Enrollment - Grade 1 to 4 (%)
School Enrollment - Grade 5 to 8 (%)
School Enrollment - Grade 9 to 12 (%)
School Enrollment - College undergrad (%)
School Enrollment - Graduate or professional (%)
School Enrollment - Not enrolled in school (%)
School enrollment - Public schools (%)
School enrollment - Private schools (%)
School enrollment - Not enrolled (%)
Median number of rooms in houses and condos
Median number of rooms in apartments
Housing units lacking complete plumbing facilities (%)
Housing units lacking complete kitchen facilities (%)
Density of houses
Urban houses (%)
Rural houses (%)
Households with people 60 years and over (%)
Households with people 65 years and over (%)
Households with people 75 years and over (%)
Households with one or more nonrelatives (%)
Households with no nonrelatives (%)
Population in households (%)
Family households (%)
Nonfamily households (%)
Population in families (%)
Family households with own children (%)
Median number of bedrooms in owner occupied houses
Mean number of bedrooms in owner occupied houses
Median number of bedrooms in renter occupied houses
Mean number of bedrooms in renter occupied houses
Median number of vehichles in owner occupied houses
Mean number of vehichles in owner occupied houses
Median number of vehichles in renter occupied houses
Mean number of vehichles in renter occupied houses
Mortgage status - with mortgage (%)
Mortgage status - with second mortgage (%)
Mortgage status - with home equity loan (%)
Mortgage status - with both second mortgage and home equity loan (%)
Mortgage status - without a mortgage (%)
Average family size
Average family size - White
Average family size - Black or African American
Average family size - Asian
Average family size - Hispanic or Latino
Average family size - American Indian and Alaska Native
Average family size - Multirace
Average family size - Other Race
Geographical mobility - Same house 1 year ago (%)
Geographical mobility - Moved within same county (%)
Geographical mobility - Moved from different county within same state (%)
Geographical mobility - Moved from different state (%)
Geographical mobility - Moved from abroad (%)
Place of birth - Born in state of residence (%)
Place of birth - Born in other state (%)
Place of birth - Native, outside of US (%)
Place of birth - Foreign born (%)
Housing units in structures - 1, detached (%)
Housing units in structures - 1, attached (%)
Housing units in structures - 2 (%)
Housing units in structures - 3 or 4 (%)
Housing units in structures - 5 to 9 (%)
Housing units in structures - 10 to 19 (%)
Housing units in structures - 20 to 49 (%)
Housing units in structures - 50 or more (%)
Housing units in structures - Mobile home (%)
Housing units in structures - Boat, RV, van, etc. (%)
House/condo owner moved in on average (years ago)
Renter moved in on average (years ago)
Year householder moved into unit - Moved in 1999 to March 2000 (%)
Year householder moved into unit - Moved in 1995 to 1998 (%)
Year householder moved into unit - Moved in 1990 to 1994 (%)
Year householder moved into unit - Moved in 1980 to 1989 (%)
Year householder moved into unit - Moved in 1970 to 1979 (%)
Year householder moved into unit - Moved in 1969 or earlier (%)
Means of transportation to work - Drove car alone (%)
Means of transportation to work - Carpooled (%)
Means of transportation to work - Public transportation (%)
Means of transportation to work - Bus or trolley bus (%)
Means of transportation to work - Streetcar or trolley car (%)
Means of transportation to work - Subway or elevated (%)
Means of transportation to work - Railroad (%)
Means of transportation to work - Ferryboat (%)
Means of transportation to work - Taxicab (%)
Means of transportation to work - Motorcycle (%)
Means of transportation to work - Bicycle (%)
Means of transportation to work - Walked (%)
Means of transportation to work - Other means (%)
Working at home (%)
Industry diversity
Most Common Industries - Agriculture, forestry, fishing and hunting, and mining (%)
Most Common Industries - Agriculture, forestry, fishing and hunting (%)
Most Common Industries - Mining, quarrying, and oil and gas extraction (%)
Most Common Industries - Construction (%)
Most Common Industries - Manufacturing (%)
Most Common Industries - Wholesale trade (%)
Most Common Industries - Retail trade (%)
Most Common Industries - Transportation and warehousing, and utilities (%)
Most Common Industries - Transportation and warehousing (%)
Most Common Industries - Utilities (%)
Most Common Industries - Information (%)
Most Common Industries - Finance and insurance, and real estate and rental and leasing (%)
Most Common Industries - Finance and insurance (%)
Most Common Industries - Real estate and rental and leasing (%)
Most Common Industries - Professional, scientific, and management, and administrative and waste management services (%)
Most Common Industries - Professional, scientific, and technical services (%)
Most Common Industries - Management of companies and enterprises (%)
Most Common Industries - Administrative and support and waste management services (%)
Most Common Industries - Educational services, and health care and social assistance (%)
Most Common Industries - Educational services (%)
Most Common Industries - Health care and social assistance (%)
Most Common Industries - Arts, entertainment, and recreation, and accommodation and food services (%)
Most Common Industries - Arts, entertainment, and recreation (%)
Most Common Industries - Accommodation and food services (%)
Most Common Industries - Other services, except public administration (%)
Most Common Industries - Public administration (%)
Occupation diversity
Most Common Occupations - Management, business, science, and arts occupations (%)
Most Common Occupations - Management, business, and financial occupations (%)
Most Common Occupations - Management occupations (%)
Most Common Occupations - Business and financial operations occupations (%)
Most Common Occupations - Computer, engineering, and science occupations (%)
Most Common Occupations - Computer and mathematical occupations (%)
Most Common Occupations - Architecture and engineering occupations (%)
Most Common Occupations - Life, physical, and social science occupations (%)
Most Common Occupations - Education, legal, community service, arts, and media occupations (%)
Most Common Occupations - Community and social service occupations (%)
Most Common Occupations - Legal occupations (%)
Most Common Occupations - Education, training, and library occupations (%)
Most Common Occupations - Arts, design, entertainment, sports, and media occupations (%)
Most Common Occupations - Healthcare practitioners and technical occupations (%)
Most Common Occupations - Health diagnosing and treating practitioners and other technical occupations (%)
Most Common Occupations - Health technologists and technicians (%)
Most Common Occupations - Service occupations (%)
Most Common Occupations - Healthcare support occupations (%)
Most Common Occupations - Protective service occupations (%)
Most Common Occupations - Fire fighting and prevention, and other protective service workers including supervisors (%)
Most Common Occupations - Law enforcement workers including supervisors (%)
Most Common Occupations - Food preparation and serving related occupations (%)
Most Common Occupations - Building and grounds cleaning and maintenance occupations (%)
Most Common Occupations - Personal care and service occupations (%)
Most Common Occupations - Sales and office occupations (%)
Most Common Occupations - Sales and related occupations (%)
Most Common Occupations - Office and administrative support occupations (%)
Most Common Occupations - Natural resources, construction, and maintenance occupations (%)
Most Common Occupations - Farming, fishing, and forestry occupations (%)
Most Common Occupations - Construction and extraction occupations (%)
Most Common Occupations - Installation, maintenance, and repair occupations (%)
Most Common Occupations - Production, transportation, and material moving occupations (%)
Most Common Occupations - Production occupations (%)
Most Common Occupations - Transportation occupations (%)
Most Common Occupations - Material moving occupations (%)
People in Group quarters - Institutionalized population (%)
People in Group quarters - Correctional institutions (%)
People in Group quarters - Federal prisons and detention centers (%)
People in Group quarters - Halfway houses (%)
People in Group quarters - Local jails and other confinement facilities (including police lockups) (%)
People in Group quarters - Military disciplinary barracks (%)
People in Group quarters - State prisons (%)
People in Group quarters - Other types of correctional institutions (%)
People in Group quarters - Nursing homes (%)
People in Group quarters - Hospitals/wards, hospices, and schools for the handicapped (%)
People in Group quarters - Hospitals/wards and hospices for chronically ill (%)
People in Group quarters - Hospices or homes for chronically ill (%)
People in Group quarters - Military hospitals or wards for chronically ill (%)
People in Group quarters - Other hospitals or wards for chronically ill (%)
People in Group quarters - Hospitals or wards for drug/alcohol abuse (%)
People in Group quarters - Mental (Psychiatric) hospitals or wards (%)
People in Group quarters - Schools, hospitals, or wards for the mentally retarded (%)
People in Group quarters - Schools, hospitals, or wards for the physically handicapped (%)
People in Group quarters - Institutions for the deaf (%)
People in Group quarters - Institutions for the blind (%)
People in Group quarters - Orthopedic wards and institutions for the physically handicapped (%)
People in Group quarters - Wards in general hospitals for patients who have no usual home elsewhere (%)
People in Group quarters - Wards in military hospitals for patients who have no usual home elsewhere (%)
People in Group quarters - Juvenile institutions (%)
People in Group quarters - Long-term care (%)
People in Group quarters - Homes for abused, dependent, and neglected children (%)
People in Group quarters - Residential treatment centers for emotionally disturbed children (%)
People in Group quarters - Training schools for juvenile delinquents (%)
People in Group quarters - Short-term care, detention or diagnostic centers for delinquent children (%)
People in Group quarters - Type of juvenile institution unknown (%)
People in Group quarters - Noninstitutionalized population (%)
People in Group quarters - College dormitories (includes college quarters off campus) (%)
People in Group quarters - Military quarters (%)
People in Group quarters - On base (%)
People in Group quarters - Barracks, unaccompanied personnel housing (UPH), (Enlisted/Officer), ;and similar group living quarters for military personnel (%)
People in Group quarters - Transient quarters for temporary residents (%)
People in Group quarters - Military ships (%)
People in Group quarters - Group homes (%)
People in Group quarters - Homes or halfway houses for drug/alcohol abuse (%)
People in Group quarters - Homes for the mentally ill (%)
People in Group quarters - Homes for the mentally retarded (%)
People in Group quarters - Homes for the physically handicapped (%)
People in Group quarters - Other group homes (%)
People in Group quarters - Religious group quarters (%)
People in Group quarters - Dormitories (%)
People in Group quarters - Agriculture workers' dormitories on farms (%)
People in Group quarters - Job Corps and vocational training facilities (%)
People in Group quarters - Other workers' dormitories (%)
People in Group quarters - Crews of maritime vessels (%)
People in Group quarters - Other nonhousehold living situations (%)
People in Group quarters - Other noninstitutional group quarters (%)
Residents speaking English at home (%)
Residents speaking English at home - Born in the United States (%)
Residents speaking English at home - Native, born elsewhere (%)
Residents speaking English at home - Foreign born (%)
Residents speaking Spanish at home (%)
Residents speaking Spanish at home - Born in the United States (%)
Residents speaking Spanish at home - Native, born elsewhere (%)
Residents speaking Spanish at home - Foreign born (%)
Residents speaking other language at home (%)
Residents speaking other language at home - Born in the United States (%)
Residents speaking other language at home - Native, born elsewhere (%)
Residents speaking other language at home - Foreign born (%)
Class of Workers - Employee of private company (%)
Class of Workers - Self-employed in own incorporated business (%)
Class of Workers - Private not-for-profit wage and salary workers (%)
Class of Workers - Local government workers (%)
Class of Workers - State government workers (%)
Class of Workers - Federal government workers (%)
Class of Workers - Self-employed workers in own not incorporated business and Unpaid family workers (%)
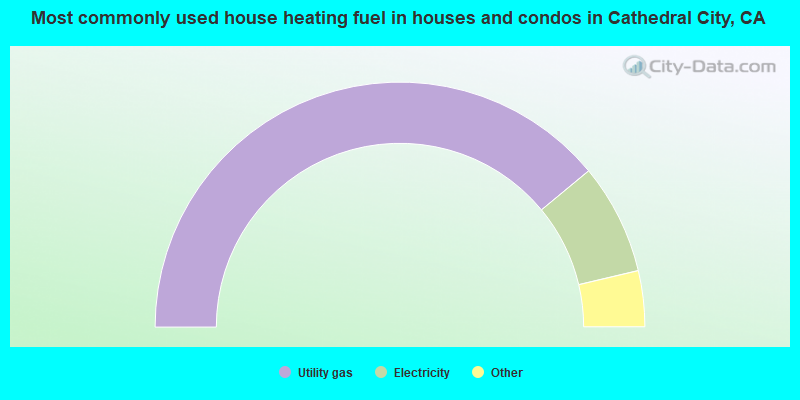
House heating fuel used in houses and condos - Utility gas (%)
House heating fuel used in houses and condos - Bottled, tank, or LP gas (%)
House heating fuel used in houses and condos - Electricity (%)
House heating fuel used in houses and condos - Fuel oil, kerosene, etc. (%)
House heating fuel used in houses and condos - Coal or coke (%)
House heating fuel used in houses and condos - Wood (%)
House heating fuel used in houses and condos - Solar energy (%)
House heating fuel used in houses and condos - Other fuel (%)
House heating fuel used in houses and condos - No fuel used (%)
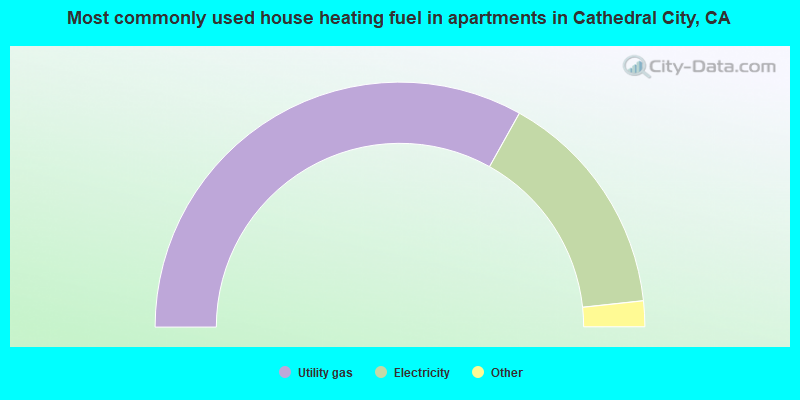
House heating fuel used in apartments - Utility gas (%)
House heating fuel used in apartments - Bottled, tank, or LP gas (%)
House heating fuel used in apartments - Electricity (%)
House heating fuel used in apartments - Fuel oil, kerosene, etc. (%)
House heating fuel used in apartments - Coal or coke (%)
House heating fuel used in apartments - Wood (%)
House heating fuel used in apartments - Solar energy (%)
House heating fuel used in apartments - Other fuel (%)
House heating fuel used in apartments - No fuel used (%)
Armed forces status - In Armed Forces (%)
Armed forces status - Civilian (%)
Armed forces status - Civilian - Veteran (%)
Armed forces status - Civilian - Nonveteran (%)
Fatal accidents locations in years 2005-2021
Fatal accidents locations in 2005
Fatal accidents locations in 2006
Fatal accidents locations in 2007
Fatal accidents locations in 2008
Fatal accidents locations in 2009
Fatal accidents locations in 2010
Fatal accidents locations in 2011
Fatal accidents locations in 2012
Fatal accidents locations in 2013
Fatal accidents locations in 2014
Fatal accidents locations in 2015
Fatal accidents locations in 2016
Fatal accidents locations in 2017
Fatal accidents locations in 2018
Fatal accidents locations in 2019
Fatal accidents locations in 2020
Fatal accidents locations in 2021
Alcohol use - People drinking some alcohol every month (%)
Alcohol use - People not drinking at all (%)
Alcohol use - Average days/month drinking alcohol
Alcohol use - Average drinks/week
Alcohol use - Average days/year people drink much
Audiometry - Average condition of hearing (%)
Audiometry - People that can hear a whisper from across a quiet room (%)
Audiometry - People that can hear normal voice from across a quiet room (%)
Audiometry - Ears ringing, roaring, buzzing (%)
Audiometry - Had a job exposure to loud noise (%)
Audiometry - Had off-work exposure to loud noise (%)
Blood Pressure & Cholesterol - Has high blood pressure (%)
Blood Pressure & Cholesterol - Checking blood pressure at home (%)
Blood Pressure & Cholesterol - Frequently checking blood cholesterol (%)
Blood Pressure & Cholesterol - Has high cholesterol level (%)
Consumer Behavior - Money monthly spent on food at supermarket/grocery store
Consumer Behavior - Money monthly spent on food at other stores
Consumer Behavior - Money monthly spent on eating out
Consumer Behavior - Money monthly spent on carryout/delivered foods
Consumer Behavior - Income spent on food at supermarket/grocery store (%)
Consumer Behavior - Income spent on food at other stores (%)
Consumer Behavior - Income spent on eating out (%)
Consumer Behavior - Income spent on carryout/delivered foods (%)
Current Health Status - General health condition (%)
Current Health Status - Blood donors (%)
Current Health Status - Has blood ever tested for HIV virus (%)
Current Health Status - Left-handed people (%)
Dermatology - People using sunscreen (%)
Diabetes - Diabetics (%)
Diabetes - Had a blood test for high blood sugar (%)
Diabetes - People taking insulin (%)
Diet Behavior & Nutrition - Diet health (%)
Diet Behavior & Nutrition - Milk product consumption (# of products/month)
Diet Behavior & Nutrition - Meals not home prepared (#/week)
Diet Behavior & Nutrition - Meals from fast food or pizza place (#/week)
Diet Behavior & Nutrition - Ready-to-eat foods (#/month)
Diet Behavior & Nutrition - Frozen meals/pizza (#/month)
Drug Use - People that ever used marijuana or hashish (%)
Drug Use - Ever used hard drugs (%)
Drug Use - Ever used any form of cocaine (%)
Drug Use - Ever used heroin (%)
Drug Use - Ever used methamphetamine (%)
Health Insurance - People covered by health insurance (%)
Kidney Conditions-Urology - Avg. # of times urinating at night
Medical Conditions - People with asthma (%)
Medical Conditions - People with anemia (%)
Medical Conditions - People with psoriasis (%)
Medical Conditions - People with overweight (%)
Medical Conditions - Elderly people having difficulties in thinking or remembering (%)
Medical Conditions - People who ever received blood transfusion (%)
Medical Conditions - People having trouble seeing even with glass/contacts (%)
Medical Conditions - People with arthritis (%)
Medical Conditions - People with gout (%)
Medical Conditions - People with congestive heart failure (%)
Medical Conditions - People with coronary heart disease (%)
Medical Conditions - People with angina pectoris (%)
Medical Conditions - People who ever had heart attack (%)
Medical Conditions - People who ever had stroke (%)
Medical Conditions - People with emphysema (%)
Medical Conditions - People with thyroid problem (%)
Medical Conditions - People with chronic bronchitis (%)
Medical Conditions - People with any liver condition (%)
Medical Conditions - People who ever had cancer or malignancy (%)
Mental Health - People who have little interest in doing things (%)
Mental Health - People feeling down, depressed, or hopeless (%)
Mental Health - People who have trouble sleeping or sleeping too much (%)
Mental Health - People feeling tired or having little energy (%)
Mental Health - People with poor appetite or overeating (%)
Mental Health - People feeling bad about themself (%)
Mental Health - People who have trouble concentrating on things (%)
Mental Health - People moving or speaking slowly or too fast (%)
Mental Health - People having thoughts they would be better off dead (%)
Oral Health - Average years since last visit a dentist
Oral Health - People embarrassed because of mouth (%)
Oral Health - People with gum disease (%)
Oral Health - General health of teeth and gums (%)
Oral Health - Average days a week using dental floss/device
Oral Health - Average days a week using mouthwash for dental problem
Oral Health - Average number of teeth
Pesticide Use - Households using pesticides to control insects (%)
Pesticide Use - Households using pesticides to kill weeds (%)
Physical Activity - People doing vigorous-intensity work activities (%)
Physical Activity - People doing moderate-intensity work activities (%)
Physical Activity - People walking or bicycling (%)
Physical Activity - People doing vigorous-intensity recreational activities (%)
Physical Activity - People doing moderate-intensity recreational activities (%)
Physical Activity - Average hours a day doing sedentary activities
Physical Activity - Average hours a day watching TV or videos
Physical Activity - Average hours a day using computer
Physical Functioning - People having limitations keeping them from working (%)
Physical Functioning - People limited in amount of work they can do (%)
Physical Functioning - People that need special equipment to walk (%)
Physical Functioning - People experiencing confusion/memory problems (%)
Physical Functioning - People requiring special healthcare equipment (%)
Prescription Medications - Average number of prescription medicines taking
Preventive Aspirin Use - Adults 40+ taking low-dose aspirin (%)
Reproductive Health - Vaginal deliveries (%)
Reproductive Health - Cesarean deliveries (%)
Reproductive Health - Deliveries resulted in a live birth (%)
Reproductive Health - Pregnancies resulted in a delivery (%)
Reproductive Health - Women breastfeeding newborns (%)
Reproductive Health - Women that had a hysterectomy (%)
Reproductive Health - Women that had both ovaries removed (%)
Reproductive Health - Women that have ever taken birth control pills (%)
Reproductive Health - Women taking birth control pills (%)
Reproductive Health - Women that have ever used Depo-Provera or injectables (%)
Reproductive Health - Women that have ever used female hormones (%)
Sexual Behavior - People 18+ that ever had sex (vaginal, anal, or oral) (%)
Sexual Behavior - Males 18+ that ever had vaginal sex with a woman (%)
Sexual Behavior - Males 18+ that ever performed oral sex on a woman (%)
Sexual Behavior - Males 18+ that ever had anal sex with a woman (%)
Sexual Behavior - Males 18+ that ever had any sex with a man (%)
Sexual Behavior - Females 18+ that ever had vaginal sex with a man (%)
Sexual Behavior - Females 18+ that ever performed oral sex on a man (%)
Sexual Behavior - Females 18+ that ever had anal sex with a man (%)
Sexual Behavior - Females 18+ that ever had any kind of sex with a woman (%)
Sexual Behavior - Average age people first had sex
Sexual Behavior - Average number of female sex partners in lifetime (males 18+)
Sexual Behavior - Average number of female vaginal sex partners in lifetime (males 18+)
Sexual Behavior - Average age people first performed oral sex on a woman (18+)
Sexual Behavior - Average number of woman performed oral sex on in lifetime (18+)
Sexual Behavior - Average number of male sex partners in lifetime (males 18+)
Sexual Behavior - Average number of male anal sex partners in lifetime (males 18+)
Sexual Behavior - Average age people first performed oral sex on a man (18+)
Sexual Behavior - Average number of male oral sex partners in lifetime (18+)
Sexual Behavior - People using protection when performing oral sex (%)
Sexual Behavior - Average number of times people have vaginal or anal sex a year
Sexual Behavior - People having sex without condom (%)
Sexual Behavior - Average number of male sex partners in lifetime (females 18+)
Sexual Behavior - Average number of male vaginal sex partners in lifetime (females 18+)
Sexual Behavior - Average number of female sex partners in lifetime (females 18+)
Sexual Behavior - Circumcised males 18+ (%)
Sleep Disorders - Average hours sleeping at night
Sleep Disorders - People that has trouble sleeping (%)
Smoking-Cigarette Use - People smoking cigarettes (%)
Taste & Smell - People 40+ having problems with smell (%)
Taste & Smell - People 40+ having problems with taste (%)
Taste & Smell - People 40+ that ever had wisdom teeth removed (%)
Taste & Smell - People 40+ that ever had tonsils teeth removed (%)
Taste & Smell - People 40+ that ever had a loss of consciousness because of a head injury (%)
Taste & Smell - People 40+ that ever had a broken nose or other serious injury to face or skull (%)
Taste & Smell - People 40+ that ever had two or more sinus infections (%)
Weight - Average height (inches)
Weight - Average weight (pounds)
Weight - Average BMI
Weight - People that are obese (%)
Weight - People that ever were obese (%)
Weight - People trying to lose weight (%)
31,964 60.4% Hispanic 14,661 27.7% White alone 3,680 7.0% Asian alone 1,399 2.6% Two or more races 865 1.6% Black alone 152 0.3% Other race alone 132 0.2% American Indian alone 123 0.2% Native Hawaiian and Other
The City-Data.com crime index weighs serious crimes and violent crimes more heavily. Higher means more crime, U.S. average is 246.1. It adjusts for the number of visitors and daily workers commuting into cities.
- means the value is smaller than the state average.
- means the value is about the same as the state average.
- means the value is bigger than the state average.
- means the value is much bigger than the state average.
Crime rate in Cathedral City detailed stats: murders, rapes, robberies, assaults, burglaries, thefts, arson Officers per 1,000 residents here:
0.82California average:
2.30
Latest news from Cathedral City, CA collected exclusively by city-data.com from local newspapers, TV, and radio stations
Cathedral City, CA City Guides: Ancestries: American (3.5%), German (3.2%), English (3.0%), Irish (2.2%), Italian (1.7%).
Current Local Time:
Land area: 19.2 square miles.
Population density: 2,738 people per square mile (average).
15,832 residents are foreign born (21.9% Latin America , 4.8% Asia ).
This city:
29.9%California:
26.5%
Median real estate property taxes paid for housing units with mortgages in 2022: $4,024 (0.8%)Median real estate property taxes paid for housing units with no mortgage in 2022: $3,009 (0.7%)
Nearest city with pop. 50,000+: Coachella Valley, CA
Nearest city with pop. 200,000+: Riverside, CA
Nearest city with pop. 1,000,000+: San Diego, CA
Nearest cities:
Latitude: 33.81 N, Longitude: 116.46 W
Daytime population change due to commuting: -8,560 (-16.2%)Workers who live and work in this city: 7,572 (30.3%)
Area code commonly used in this area: 760
Cathedral City tourist attractions:
Single-family new house construction building permits:
2022: 55 buildings , average cost: $340,1002021: 150 buildings , average cost: $175,7002020: 249 buildings , average cost: $210,0002019: 142 buildings , average cost: $203,7002018: 92 buildings , average cost: $200,6002017: 85 buildings , average cost: $274,0002016: 44 buildings , average cost: $223,2002015: 24 buildings , average cost: $210,7002014: 32 buildings , average cost: $205,2002013: 10 buildings , average cost: $220,7002012: 9 buildings , average cost: $217,5002011: 2 buildings , average cost: $233,2002010: 4 buildings , average cost: $197,2002009: 2 buildings , average cost: $225,4002008: 10 buildings , average cost: $202,2002007: 40 buildings , average cost: $210,8002006: 166 buildings , average cost: $212,4002005: 412 buildings , average cost: $223,0002004: 336 buildings , average cost: $194,3002003: 386 buildings , average cost: $203,6002002: 641 buildings , average cost: $167,7002001: 492 buildings , average cost: $156,3002000: 219 buildings , average cost: $125,6001999: 225 buildings , average cost: $125,6001998: 216 buildings , average cost: $125,6001997: 197 buildings , average cost: $125,600Unemployment in December 2023: Population change in the 1990s: +11,444 (+36.7%).
Most common occupations in Cathedral City, CA (%)
Both Males Females
Building and grounds cleaning and maintenance occupations (10.6%)
Retail sales workers, except cashiers (4.2%)
Other management occupations, except farmers and farm managers (4.0%)
Other sales and related occupations, including supervisors (4.0%)
Waiters and waitresses (3.4%)
Other office and administrative support workers, including supervisors (3.3%)
Cooks and food preparation workers (3.3%)
Building and grounds cleaning and maintenance occupations (11.1%)
Construction laborers (5.2%)
Other management occupations, except farmers and farm managers (4.5%)
Other food preparation and serving workers, including supervisors (4.0%)
Electrical equipment mechanics and other installation, maintenance, and repair workers, including supervisors (3.9%)
Cooks and food preparation workers (3.9%)
Retail sales workers, except cashiers (3.8%)
Building and grounds cleaning and maintenance occupations (10.0%)
Other sales and related occupations, including supervisors (5.9%)
Other office and administrative support workers, including supervisors (5.2%)
Retail sales workers, except cashiers (4.8%)
Cashiers (4.7%)
Secretaries and administrative assistants (4.5%)
Information and record clerks, except customer service representatives (4.3%)
Earthquake activity:
Cathedral City-area historical earthquake activity is significantly above California state average. It is 6936% greater than the overall U.S. average. On 6/28/1992 at 11:57:34, a magnitude 7.6 (6.2 MB, 7.6 MS, 7.3 MW, Depth: 0.7 mi, Class: Major, Intensity: VIII - XII) earthquake occurred 26.3 miles away from Cathedral City center, causing 3 deaths ( 1 shaking deaths, 2 other deaths) and 400 injuries, causing $100,000,000 total damage and $40,000,000 insured lossesOn 10/16/1999 at 09:46:44, a magnitude 7.4 (6.3 MB, 7.4 MS, 7.2 MW, 7.3 ML) earthquake occurred 48.9 miles away from Cathedral City center On 7/21/1952 at 11:52:14, a magnitude 7.7 (7.7 UK) earthquake occurred 166.5 miles away from the city center, causing $50,000,000 total damage On 5/19/1940 at 04:36:40, a magnitude 7.2 (7.2 UK) earthquake occurred 60.0 miles away from Cathedral City center, causing $33,000,000 total damage On 12/31/1934 at 18:45:56, a magnitude 7.1 (7.1 UK) earthquake occurred 87.7 miles away from the city center On 6/28/1992 at 15:05:30, a magnitude 6.9 (6.3 MB, 6.7 MS, 6.5 MW, 6.9 ME, Depth: 3.1 mi, Class: Strong, Intensity: VII - IX) earthquake occurred 38.9 miles away from the city center Magnitude types: body-wave magnitude (MB), energy magnitude (ME), local magnitude (ML), surface-wave magnitude (MS), moment magnitude (MW) Natural disasters: The number of natural disasters in Riverside County (46) is a lot greater than the US average (15).Major Disasters (Presidential) Declared: 27Emergencies Declared: 1Fires: 22, Floods: 20, Storms: 8, Winter Storms: 8, Landslides: 6, Mudslides: 5, Heavy Rains: 2, Earthquake: 1, Flash Flood: 1, Freeze: 1, Hurricane: 1, Tornado: 1, Tropical Storm: 1, Other: 1 (Note: some incidents may be assigned to more than one category). Hospitals and medical centers in Cathedral City: CANYON SPRINGS (69696 RAMON ROAD) CHARTER BHS OF SO CA PALM SPRINGS (provides emergency services, 69696 RAMON ROAD) CATHEDRAL CITY DIALYSIS (30885 DATE PALM DRIVE)
DESERT OASIS HEALTHCARE-HOME HEALTH SERVICES (35-325 DATE PALM DRIVE, SUITE #236)
LIFECARE SOLUTIONS, INC (27620 LANDAU BLVD STE 1)
Heliports located in Cathedral City: Amtrak stations near Cathedral City: 5 miles: PALM SPRINGS (300 N. INDIAN AVE.) - Bus Station Services: fully wheelchair accessible, public payphones, free short-term parking, call for taxi service, public transit connection.
8 miles: PALM DESERT (MONTEREY AVE. & SAN GORGONIO WAY) - Bus Station Services: fully wheelchair accessible, public payphones, snack bar, free short-term parking, call for taxi service, public transit connection.
8 miles: PALM SPRINGS - NORTH (PALM SPRINGS, INDIAN CANYON DR. @ I-10) Services: fully wheelchair accessible, public restrooms, public payphones.
College/University in Cathedral City: Mayfield College Full-time enrollment: 238; Location: 35-325 Date Palm Dr Ste 101; Private, for-profit; Website: www.mayfieldcollege.edu)
Colleges/universities with over 2000 students nearest to Cathedral City:
College of the Desert (about 7 miles; Palm Desert, CA ; Full-time enrollment: 5,686)
Mt San Jacinto Community College District (about 30 miles; San Jacinto, CA ; FT enrollment: 8,426)
Crafton Hills College (about 40 miles; Yucaipa, CA ; FT enrollment: 3,222)
Moreno Valley College (about 43 miles; Moreno Valley, CA ; FT enrollment: 4,650)
University of Redlands (about 44 miles; Redlands, CA ; FT enrollment: 4,854)
Loma Linda University (about 49 miles; Loma Linda, CA ; FT enrollment: 2,839)
The Art Institute of California-Argosy University Inland Empire (about 50 miles; San Bernardino, CA ; FT enrollment: 2,238)
Public high schools in Cathedral City:
Private high school in Cathedral City: STEPPING STONES Students: 50, Location: 68550 DINAH SHORE DR, Grades: 2-12)Public elementary/middle schools in Cathedral City: JAMES WORKMAN MIDDLE Students: 1,479, Location: 69-300 30TH AVE., Grades: 6-8)NELLIE N. COFFMAN MIDDLE Students: 1,048, Location: 34-603 PLUMLEY RD., Grades: 6-8)SUNNY SANDS ELEMENTARY Students: 645, Location: 69-310 MCCALLUM WAY, Grades: KG-5)LANDAU ELEMENTARY Students: 535, Location: 30310 LANDAU BLVD., Grades: KG-5)CATHEDRAL CITY ELEMENTARY Students: 534, Location: 69300 CONVERSE RD., Grades: KG-5)AGUA CALIENTE ELEMENTARY Students: 504, Location: 30-800 SAN LUIS REY PLAZA, Grades: KG-5)RIO VISTA ELEMENTARY Students: 466, Location: 67-700 VERONA RD., Grades: KG-5)See full list of schools located in Cathedral City
Notable locations in Cathedral City: (A) , Outdoor Resorts of America Golf Course (B) , Olympic Golf and Tennis Driving Range (C) , Desert Princess Resort and Country Club (D) , De Anza Country Club (E) , Cathedral City Branch Riverside City and County Public Library (F) , Cathedral City Fire Department Station 413 (G) , Cathedral City Fire Department Station 411 (H) , Cathedral City Fire Department Station 412 (I) . Display/hide their locations on the map
Shopping Centers: (1) , Date Palm Shopping Center (2) , Century Plaza Shopping Center (3) , Cathedral Village Shopping Center (4) , Cathedral Plaza Shopping Center (5) , Cathedral City Shopping Plaza Shopping Center (6) , Cathedral City Marketplace Shopping Center (7) . Display/hide their locations on the map
Cemetery: (1) . Display/hide its location on the map
Streams, rivers, and creeks: (A) . Display/hide its location on the map
Parks in Cathedral City include: (1) , Century Park (2) , Panorama Park (3) , Second Street Park (4) . Display/hide their locations on the map
Hotels: (1) , Beckley's Villa Motel (67500 East Palm Canyon Drive) (2) . Display/hide their approximate locations on the map
Birthplace of: Jeremy Thornburg - Football player, Thomas Shewmake - College basketball player (CS Northridge Matadors).
Riverside County has a predicted average indoor radon screening level between 2 and 4 pCi/L (pico curies per liter) - Moderate Potential Average household size: This city:
3.0 peopleCalifornia:
2.9 people
Percentage of family households: This city:
64.9%Whole state:
68.7%
Percentage of households with unmarried partners: This city:
10.8%Whole state:
7.2%
Likely homosexual households (counted as self-reported same-sex unmarried-partner households)
Lesbian couples: 0.8% of all households Gay men: 3.8% of all households
People in group quarters in Cathedral City in 2010:
148 people in group homes intended for adults
66 people in workers' group living quarters and job corps centers
32 people in nursing facilities/skilled-nursing facilities
25 people in residential treatment centers for adults
20 people in emergency and transitional shelters (with sleeping facilities) for people experiencing homelessness
4 people in other noninstitutional facilities
People in group quarters in Cathedral City in 2000:
108 people in other group homes
32 people in other noninstitutional group quarters
5 people in homes or halfway houses for drug/alcohol abuse
Banks with branches in Cathedral City (2011 data):
Bank of America, National Association: Cathedral City Branch at 68-435 Highway 111, branch established on 1954/04/19. Info updated 2009/11/18: Bank assets: $1,451,969.3 mil, Deposits: $1,077,176.8 mil, headquarters in Charlotte, NC, positive income , 5782 total offices , Holding Company: Bank Of America Corporation
JPMorgan Chase Bank, National Association: Cathedral City Stater Bros. Banking at 67800 Vista Chino, branch established on 2010/05/03. Info updated 2011/11/10: Bank assets: $1,811,678.0 mil, Deposits: $1,190,738.0 mil, headquarters in Columbus, OH, positive income , International Specialization, 5577 total offices , Holding Company: Jpmorgan Chase & Co.
U.S. Bank National Association: Cathedral City Branch at 35950 Date Palm Drive, branch established on 1892/01/01. Info updated 2012/01/30: Bank assets: $330,470.8 mil, Deposits: $236,091.5 mil, headquarters in Cincinnati, OH, positive income , 3121 total offices , Holding Company: U.S. Bancorp
Wells Fargo Bank, National Association: Cathedral City Branch at 69255 Ramon Road, branch established on 2001/08/12. Info updated 2011/04/05: Bank assets: $1,161,490.0 mil, Deposits: $905,653.0 mil, headquarters in Sioux Falls, SD, positive income , 6395 total offices , Holding Company: Wells Fargo & Company
Pacific Western Bank: Cathedral City Branch at 30-855 Date Palm Drive, branch established on 1990/01/16. Info updated 2011/03/14: Bank assets: $5,513.1 mil, Deposits: $4,614.5 mil, headquarters in Los Angeles, CA, positive income , Commercial Lending Specialization, 78 total offices , Holding Company: Capgen Capital Group Ii Lp
For population 15 years and over in Cathedral City:
Never married: 36.7%Now married: 46.5%Separated: 1.7%Widowed: 5.1%Divorced: 10.0% For population 25 years and over in Cathedral City:
High school or higher: 80.7%Bachelor's degree or higher: 26.0%Graduate or professional degree: 10.5%Unemployed: 4.4%Mean travel time to work (commute): 17.8 minutes
Education Gini index (Inequality in education) Here:
16.3California average:
15.5
Religion statistics for Cathedral City, CA (based on Riverside County data)
Religion Adherents Congregations Catholic 602,765 51 Evangelical Protestant 240,306 741 Other 77,581 194 Mainline Protestant 29,535 103 Black Protestant 19,170 40 Orthodox 3,647 11 None 1,216,637 -
Source: Clifford Grammich, Kirk Hadaway, Richard Houseal, Dale E.Jones, Alexei Krindatch, Richie Stanley and Richard H.Taylor. 2012. 2010 U.S.Religion Census: Religious Congregations & Membership Study. Association of Statisticians of American Religious Bodies. Jones, Dale E., et al. 2002. Congregations and Membership in the United States 2000. Nashville, TN: Glenmary Research Center. Graphs represent county-level data
Food Environment Statistics: Number of grocery stores : 330Here :
1.60 / 10,000 pop.State :
2.14 / 10,000 pop.
Number of supercenters and club stores : 11Riverside County :
0.05 / 10,000 pop.State :
0.04 / 10,000 pop.
Number of convenience stores (no gas) : 91This county :
0.44 / 10,000 pop.California :
0.62 / 10,000 pop.
Number of convenience stores (with gas) : 311This county :
1.51 / 10,000 pop.California :
1.49 / 10,000 pop.
Number of full-service restaurants : 1,125Riverside County :
5.45 / 10,000 pop.California :
7.42 / 10,000 pop.
Adult diabetes rate : This county :
7.7%California :
7.3%
Adult obesity rate : Riverside County :
24.5%State :
21.3%
Low-income preschool obesity rate : Here :
15.2%California :
17.9%
Health and Nutrition: Healthy diet rate : This city:
48.0%California:
49.4%
Average overall health of teeth and gums : This city:
47.3%California:
48.0%
People feeling badly about themselves : This city:
21.6%California:
20.2%
People not drinking alcohol at all : This city:
10.2%California:
11.2%
Average hours sleeping at night : Cathedral City:
6.8California:
6.8
Overweight people : Cathedral City:
32.4%California:
31.5%
General health condition : Here:
55.3%California:
56.4%
Average condition of hearing : Cathedral City:
80.0%California:
80.9%
More about Health and Nutrition of Cathedral City, CA Residents
Cathedral City government finances - Expenditure in 2021 (per resident):
Construction - Regular Highways: $28,936,000 ($551.22)
Parks and Recreation: $357,000 ($6.80)Housing and Community Development: $351,000 ($6.69)Current Operations - Police Protection: $18,064,000 ($344.12)
Central Staff Services: $12,744,000 ($242.77)Local Fire Protection: $9,719,000 ($185.14)Housing and Community Development: $4,247,000 ($80.90)Regular Highways: $3,840,000 ($73.15)Financial Administration: $3,256,000 ($62.03)Health - Other: $3,168,000 ($60.35)Protective Inspection and Regulation - Other: $2,891,000 ($55.07)Solid Waste Management: $552,000 ($10.52)Parks and Recreation: $504,000 ($9.60)Judicial and Legal Services: $384,000 ($7.32)General - Other: $368,000 ($7.01)General - Interest on Debt: $17,521,000 ($333.77)
Cathedral City government finances - Revenue in 2021 (per resident):
Charges - Other: $7,880,000 ($150.11)
Solid Waste Management: $1,032,000 ($19.66)Housing and Community Development: $128,000 ($2.44)Federal Intergovernmental - Other: $9,370,000 ($178.50)
Housing and Community Development: $1,031,000 ($19.64)Local Intergovernmental - Other: $8,051,000 ($153.37)
Miscellaneous - Interest Earnings: $4,059,000 ($77.32)
Donations From Private Sources: $824,000 ($15.70)Fines and Forfeits: $666,000 ($12.69)General Revenue - Other: $123,000 ($2.34)Rents: $110,000 ($2.10)State Intergovernmental - Highways: $2,163,000 ($41.20)
Other: $784,000 ($14.94)General Local Government Support: $10,000 ($0.19)Tax - General Sales and Gross Receipts: $22,346,000 ($425.69)
Property: $17,535,000 ($334.04)Public Utilities Sales: $5,379,000 ($102.47)Other: $5,097,000 ($97.10)Other Selective Sales: $3,670,000 ($69.91)Other License: $3,362,000 ($64.05)Occupation and Business License - Other: $576,000 ($10.97)Documentary and Stock Transfer: $340,000 ($6.48)
Cathedral City government finances - Debt in 2021 (per resident):
Long Term Debt - Beginning Outstanding - Unspecified Public Purpose: $424,843,000 ($8093.17)
Retired Unspecified Public Purpose: $256,098,000 ($4878.61)Outstanding Unspecified Public Purpose: $219,685,000 ($4184.95)Issue, Unspecified Public Purpose: $50,940,000 ($970.40)
Cathedral City government finances - Cash and Securities in 2021 (per resident):
Bond Funds - Cash and Securities: $5,207,000 ($99.19)
Other Funds - Cash and Securities: $67,950,000 ($1294.43)
Sinking Funds - Cash and Securities: $76,800,000 ($1463.02)
7.19% of this county's 2021 resident taxpayers lived in other counties in 2020 ($71,521 average adjusted gross income )
Here:
7.19%California average:
5.19%
0.03% of residents moved from foreign countries ($210 average AGI )Riverside County:
0.03%California average:
0.03%
Top counties from which taxpayers relocated into this county between 2020 and 2021:
6.28% of this county's 2020 resident taxpayers moved to other counties in 2021 ($64,593 average adjusted gross income )
Here:
6.28%California average:
6.14%
0.02% of residents moved to foreign countries ($200 average AGI )Riverside County:
0.02%California average:
0.02%
Top counties to which taxpayers relocated from this county between 2020 and 2021:
Businesses in Cathedral City, CA
Name Count Name Count
24 Hour Fitness 1 Kroger 1 7-Eleven 2 MasterBrand Cabinets 1 99 Cents Only Stores 1 Mazda 1 AT&T 1 McDonald's 2 Applebee's 1 Nissan 1 AutoZone 1 Panda Express 1 Baskin-Robbins 1 Payless 1 Big O Tires 1 Penske 1 Burger King 1 Pizza Hut 1 Burlington Coat Factory 1 Quality 1 CVS 2 RadioShack 1 Carl\s Jr. 2 Rite Aid 1 Chevrolet 1 SONIC Drive-In 1 Circle K 4 Sprint Nextel 2 Cold Stone Creamery 1 Starbucks 3 DHL 1 Subaru 1 Dennys 1 Subway 4 Discount Tire 1 T-Mobile 1 Domino's Pizza 1 Taco Bell 1 El Pollo Loco 2 Target 1 FedEx 5 The Room Place 1 GNC 1 Trader Joe's 1 Goodwill 1 Travelodge 1 H&R Block 2 U-Haul 1 Holiday Inn 1 UPS 7 Honda 1 Vans 1 IHOP 1 Volkswagen 1 Jones New York 1 Walgreens 3 KFC 1
Strongest AM radio stations in Cathedral City:
KWXY (1340 AM; 1 kW; CATHEDRAL CITY, CA; Owner: GLEN BARNETT, INC.)
KGAM (1450 AM; 1 kW; PALM SPRINGS, CA; Owner: R & R RADIO CORPORATION)
KNWQ (1140 AM; 10 kW; PALM SPRINGS, CA; Owner: MCC RADIO, LLC)
KPSI (920 AM; 5 kW; PALM SPRINGS, CA; Owner: R & R RADIO CORPORATION)
KXPS (1010 AM; 4 kW; THOUSAND PALMS, CA; Owner: MCC RADIO, LLC)
KCMJ (1270 AM; 5 kW; THOUSAND PALMS, CA; Owner: MCC RADIO, LLC)
KNWZ (970 AM; 5 kW; COACHELLA, CA; Owner: MCC RADIO, LLC)
KPLS (830 AM; 50 kW; ORANGE, CA; Owner: CRN LICENSES, LLC)
KFMB (760 AM; 50 kW; SAN DIEGO, CA; Owner: MIDWEST TELEVISION, INC.)
KLAC (570 AM; 50 kW; LOS ANGELES, CA; Owner: AMFM RADIO LICENSES, L.L.C.)
KFI (640 AM; 50 kW; LOS ANGELES, CA; Owner: CAPSTAR TX LIMITED PARTNERSHIP)
KCBQ (1170 AM; 50 kW; SAN DIEGO, CA; Owner: RADIO 1210, INC.)
KTNQ (1020 AM; 50 kW; LOS ANGELES, CA; Owner: KTNQ-AM LICENSE CORP.)
Strongest FM radio stations in Cathedral City:
KLOB (94.7 FM; THOUSAND PALMS, CA; Owner: ENTRAVISION HOLDINGS, LLC)
KEZN (103.1 FM; PALM DESERT, CA; Owner: INFINITY RADIO SUBSIDIARY OPERATIONS INC.)
KMRJ (99.5 FM; RANCHO MIRAGE, CA; Owner: DANIEL P. MITCHELL)
KHCS (91.7 FM; PALM DESERT, CA; Owner: PRAIRIE AVENUE GOSPEL CENTER)
K280CV (103.9 FM; CATHEDRAL CITY, CA; Owner: MCC RADIO, LLC)
KDES-FM (104.7 FM; PALM SPRINGS, CA; Owner: R & R RADIO CORPORATION)
KWXY-FM (98.5 FM; CATHEDRAL CITY, CA; Owner: GLEN BARNETT, INC.)
KATY-FM (101.3 FM; IDYLLWILD, CA; Owner: ALL PRO BROADCASTING, INC.)
KLRD (90.1 FM; YUCAIPA, CA; Owner: EDUCATIONAL MEDIA FOUNDATION)
K201AR (88.1 FM; BANNING, CA; Owner: KSGN, INC.)
K232CX (94.3 FM; DESERT HOT SPRINGS, CA; Owner: MCC RADIO, LLC)
KYOR (106.9 FM; YUCCA VALLEY, CA; Owner: MCC RADIO, LLC)
KRTM (88.9 FM; TEMECULA, CA; Owner: PENFOLD COMMUNICATIONS, INC.)
KCLB-FM (93.7 FM; COACHELLA, CA; Owner: MCC RADIO, LLC)
KWRP (96.1 FM; SAN JACINTO, CA; Owner: MAGIC BROADCASTING, INC.)
KPSC (88.5 FM; PALM SPRINGS, CA; Owner: UNIVERSITY OF SOUTHERN CALIFORNIA)
KUOR-FM (89.1 FM; REDLANDS, CA; Owner: UNIVERSITY OF REDLANDS)
KCRI (89.3 FM; INDIO, CA; Owner: SANTA MONICA COMMUNITY COLLEGE DIST.)
KJJZ (102.3 FM; INDIO, CA; Owner: R M BROADCASTING L.L.C.)
KUNA-FM (96.7 FM; LA QUINTA, CA; Owner: GULF-CALIFORNIA BROADCAST COMPANY)
TV broadcast stations around Cathedral City:
KESQ-TV (Channel 42; PALM SPRINGS, CA; Owner: GULF-CALIFORNIA BROADCAST COMPANY)
KYAV-LP (Channel 12; PALM SPRINGS, CA; Owner: JDF INVESTMENT CO. LLC)
KVPS-LP (Channel 8; INDIO, CA; Owner: VALCOM BROADCASTING LLC)
KMIR-TV (Channel 36; PALM SPRINGS, CA; Owner: JOURNAL BROADCAST CORPORATION)
K25GW (Channel 25; INDIO, CA; Owner: DESERT SPRINGS, INC.)
KPSP-LP (Channel 58; CATHEDRAL CITY-PALM, CA; Owner: DESERT TELEVISION LLC)
KVES-LP (Channel 28; PALM SPRINGS, CA; Owner: ENTRAVISION HOLDINGS, LLC)
KDPX-LP (Channel 45; CATHEDRAL CITY, CA; Owner: CHARLES R. MEEKER)
K21DO (Channel 21; PALM SPRINGS/INDIO, CA; Owner: THREE ANGELS BROADCASTING NETWORK)
K32EM (Channel 32; MORONGO VALLEY, CA; Owner: COUNTY OF SAN BERNARDINO AREA 70)
K34EU (Channel 34; MORONGO VALLEY, CA; Owner: COUNTY OF SAN BERNARDINO AREA 70)
K13WJ (Channel 13; MORONGO VALLEY, CA; Owner: COUNTY OF SAN BERNARDINO AREA 70)
K62AO (Channel 62; MORONGO VALLEY, CA; Owner: COUNTY OF SAN BERNARDINO AREA 70)
K21GI (Channel 21; MORONGO VALLEY, CA; Owner: COUNTY OF SAN BERNARDINO AREA 70)
K30GU (Channel 30; MORONGO VALLEY, CA; Owner: COUNTY OF SAN BERNARDINO AREA 70)
K67BH (Channel 67; MORONGO VALLEY, CA; Owner: COUNTY OF SAN BERNARDINO AREA 70)
K66BM (Channel 66; PALM SPRINGS, CA; Owner: TRINITY BROADCASTING NETWORK, INC.)
KPSE-LP (Channel 50; PALM SPRINGS, CA; Owner: MIRAGE MEDIA, LLC)
Home Mortgage Disclosure Act Aggregated Statistics For Year 2009(Based on 10 full and 6 partial tracts) A) FHA, FSA/RHS & VA B) Conventional C) Refinancings D) Home Improvement Loans E) Loans on Dwellings For 5+ Families F) Non-occupant Loans on G) Loans On Manufactured Number Average Value Number Average Value Number Average Value Number Average Value Number Average Value Number Average Value Number Average Value
LOANS ORIGINATED 307 $171,138 372 $165,520 558 $202,587 12 $119,520 0 $0 358 $182,975 11 $53,777 APPLICATIONS APPROVED, NOT ACCEPTED 31 $168,478 66 $167,425 89 $210,659 6 $73,922 0 $0 62 $191,896 7 $43,877 APPLICATIONS DENIED 58 $178,405 132 $159,115 399 $223,142 34 $86,170 1 $830,790 196 $199,437 14 $47,148 APPLICATIONS WITHDRAWN 43 $183,421 82 $150,406 209 $209,886 15 $141,774 0 $0 76 $176,787 0 $0 FILES CLOSED FOR INCOMPLETENESS 8 $180,796 24 $165,562 61 $211,546 5 $195,304 0 $0 30 $189,911 0 $0
Aggregated Statistics For Year 2008(Based on 10 full and 6 partial tracts) A) FHA, FSA/RHS & VA B) Conventional C) Refinancings D) Home Improvement Loans E) Loans on Dwellings For 5+ Families F) Non-occupant Loans on G) Loans On Manufactured Number Average Value Number Average Value Number Average Value Number Average Value Number Average Value Number Average Value Number Average Value
LOANS ORIGINATED 177 $225,528 420 $209,559 409 $214,818 47 $96,911 2 $362,435 309 $197,698 11 $49,973 APPLICATIONS APPROVED, NOT ACCEPTED 16 $236,188 103 $220,447 143 $223,318 16 $127,689 0 $0 75 $214,537 11 $99,486 APPLICATIONS DENIED 36 $218,458 190 $205,709 495 $251,173 83 $110,384 0 $0 165 $203,841 15 $60,001 APPLICATIONS WITHDRAWN 29 $235,976 99 $209,585 197 $242,342 18 $161,643 0 $0 95 $229,975 1 $19,920 FILES CLOSED FOR INCOMPLETENESS 4 $191,770 27 $267,348 50 $246,464 3 $120,180 1 $359,170 20 $218,290 0 $0
Aggregated Statistics For Year 2007(Based on 10 full and 6 partial tracts) A) FHA, FSA/RHS & VA B) Conventional C) Refinancings D) Home Improvement Loans E) Loans on Dwellings For 5+ Families F) Non-occupant Loans on G) Loans On Manufactured Number Average Value Number Average Value Number Average Value Number Average Value Number Average Value Number Average Value Number Average Value
LOANS ORIGINATED 11 $374,636 861 $247,754 1,427 $249,382 159 $191,015 2 $943,000 670 $248,686 27 $67,149 APPLICATIONS APPROVED, NOT ACCEPTED 0 $0 173 $255,096 467 $250,256 47 $163,383 0 $0 153 $254,312 14 $42,233 APPLICATIONS DENIED 6 $201,005 363 $270,920 1,228 $281,728 160 $164,148 1 $60,000 287 $268,753 48 $47,062 APPLICATIONS WITHDRAWN 1 $296,000 120 $239,141 447 $276,425 46 $168,904 1 $475,000 72 $278,878 1 $59,930 FILES CLOSED FOR INCOMPLETENESS 0 $0 60 $238,963 173 $291,896 11 $156,920 0 $0 24 $295,404 0 $0
Aggregated Statistics For Year 2006(Based on 10 full and 6 partial tracts) A) FHA, FSA/RHS & VA B) Conventional C) Refinancings D) Home Improvement Loans E) Loans on Dwellings For 5+ Families F) Non-occupant Loans on G) Loans On Manufactured Number Average Value Number Average Value Number Average Value Number Average Value Number Average Value Number Average Value Number Average Value
LOANS ORIGINATED 10 $436,275 1,759 $250,399 2,156 $250,578 283 $158,287 3 $321,667 887 $255,814 14 $58,374 APPLICATIONS APPROVED, NOT ACCEPTED 0 $0 329 $234,899 552 $255,813 56 $133,686 0 $0 142 $242,679 22 $69,714 APPLICATIONS DENIED 1 $368,030 554 $251,287 1,187 $274,336 247 $124,369 1 $119,720 258 $264,097 41 $77,420 APPLICATIONS WITHDRAWN 0 $0 277 $254,623 770 $267,911 64 $167,249 0 $0 131 $276,471 3 $133,177 FILES CLOSED FOR INCOMPLETENESS 0 $0 62 $275,752 229 $263,314 13 $120,981 1 $416,000 36 $266,229 3 $94,667
Aggregated Statistics For Year 2005(Based on 10 full and 6 partial tracts) A) FHA, FSA/RHS & VA B) Conventional C) Refinancings D) Home Improvement Loans E) Loans on Dwellings For 5+ Families F) Non-occupant Loans on G) Loans On Manufactured Number Average Value Number Average Value Number Average Value Number Average Value Number Average Value Number Average Value Number Average Value
LOANS ORIGINATED 6 $269,588 2,695 $234,285 2,785 $232,020 329 $174,805 8 $485,659 1,430 $239,553 14 $92,311 APPLICATIONS APPROVED, NOT ACCEPTED 0 $0 369 $232,147 454 $223,328 55 $138,891 2 $357,565 178 $258,806 15 $82,402 APPLICATIONS DENIED 0 $0 775 $226,015 1,083 $238,736 253 $110,202 1 $360,000 344 $251,079 43 $96,744 APPLICATIONS WITHDRAWN 0 $0 455 $224,710 804 $237,725 90 $161,635 4 $261,250 203 $249,059 6 $119,438 FILES CLOSED FOR INCOMPLETENESS 0 $0 118 $208,088 355 $222,869 17 $116,904 0 $0 53 $213,807 0 $0
Aggregated Statistics For Year 2004(Based on 10 full and 6 partial tracts) A) FHA, FSA/RHS & VA B) Conventional C) Refinancings D) Home Improvement Loans E) Loans on Dwellings For 5+ Families F) Non-occupant Loans on G) Loans On Manufactured Number Average Value Number Average Value Number Average Value Number Average Value Number Average Value Number Average Value Number Average Value
LOANS ORIGINATED 23 $223,807 2,787 $192,789 2,933 $190,064 253 $146,223 6 $368,617 1,496 $196,435 18 $66,568 APPLICATIONS APPROVED, NOT ACCEPTED 0 $0 378 $187,113 541 $181,022 64 $103,147 1 $407,000 181 $180,550 29 $58,549 APPLICATIONS DENIED 6 $197,352 701 $183,912 1,174 $184,944 202 $92,328 2 $142,410 322 $189,817 34 $52,079 APPLICATIONS WITHDRAWN 4 $190,000 344 $194,888 802 $186,057 62 $89,848 2 $145,500 169 $192,404 4 $64,875 FILES CLOSED FOR INCOMPLETENESS 0 $0 86 $185,605 299 $177,503 18 $140,548 0 $0 40 $199,460 2 $51,015
Aggregated Statistics For Year 2003(Based on 10 full and 6 partial tracts) A) FHA, FSA/RHS & VA B) Conventional C) Refinancings D) Home Improvement Loans E) Loans on Dwellings For 5+ Families F) Non-occupant Loans on Number Average Value Number Average Value Number Average Value Number Average Value Number Average Value Number Average Value
LOANS ORIGINATED 93 $163,756 2,141 $165,321 4,014 $148,885 61 $46,259 15 $363,715 1,394 $157,802 APPLICATIONS APPROVED, NOT ACCEPTED 8 $133,289 261 $146,681 629 $144,978 25 $50,654 0 $0 166 $146,556 APPLICATIONS DENIED 11 $155,405 453 $161,247 1,412 $146,398 101 $28,839 2 $297,700 231 $140,732 APPLICATIONS WITHDRAWN 11 $141,727 227 $176,869 893 $148,830 26 $67,417 2 $845,550 132 $148,650 FILES CLOSED FOR INCOMPLETENESS 6 $157,000 39 $150,330 203 $141,864 12 $36,567 0 $0 42 $136,582
Aggregated Statistics For Year 2002(Based on 1 full tract) A) FHA, FSA/RHS & VA B) Conventional C) Refinancings D) Home Improvement Loans E) Loans on Dwellings For 5+ Families F) Non-occupant Loans on Number Average Value Number Average Value Number Average Value Number Average Value Number Average Value Number Average Value
LOANS ORIGINATED 5 $135,886 86 $151,894 169 $136,372 5 $24,942 3 $210,847 47 $134,392 APPLICATIONS APPROVED, NOT ACCEPTED 0 $0 11 $119,180 28 $156,425 6 $21,118 0 $0 6 $142,007 APPLICATIONS DENIED 0 $0 15 $117,329 58 $129,116 6 $38,245 3 $203,530 7 $127,706 APPLICATIONS WITHDRAWN 0 $0 16 $167,551 43 $135,780 7 $40,763 0 $0 7 $136,114 FILES CLOSED FOR INCOMPLETENESS 0 $0 7 $111,030 19 $119,409 0 $0 0 $0 1 $124,710
Aggregated Statistics For Year 2001(Based on 1 full tract) A) FHA, FSA/RHS & VA B) Conventional C) Refinancings D) Home Improvement Loans E) Loans on Dwellings For 5+ Families F) Non-occupant Loans on Number Average Value Number Average Value Number Average Value Number Average Value Number Average Value Number Average Value
LOANS ORIGINATED 12 $131,114 67 $128,912 158 $125,521 6 $22,947 5 $188,166 40 $136,410 APPLICATIONS APPROVED, NOT ACCEPTED 0 $0 12 $121,719 29 $116,008 0 $0 0 $0 6 $93,118 APPLICATIONS DENIED 0 $0 15 $77,821 74 $130,025 10 $21,051 1 $152,650 13 $130,085 APPLICATIONS WITHDRAWN 0 $0 10 $137,583 46 $121,177 2 $7,980 1 $175,600 6 $112,075 FILES CLOSED FOR INCOMPLETENESS 0 $0 3 $220,160 13 $115,349 1 $62,860 0 $0 2 $100,270
Aggregated Statistics For Year 2000(Based on 1 full tract) A) FHA, FSA/RHS & VA B) Conventional C) Refinancings D) Home Improvement Loans F) Non-occupant Loans on Number Average Value Number Average Value Number Average Value Number Average Value Number Average Value
LOANS ORIGINATED 12 $125,045 111 $120,704 49 $110,622 18 $30,097 31 $121,623 APPLICATIONS APPROVED, NOT ACCEPTED 0 $0 16 $119,288 13 $108,672 13 $31,926 5 $84,206 APPLICATIONS DENIED 2 $116,230 23 $103,891 39 $82,963 15 $25,807 8 $75,825 APPLICATIONS WITHDRAWN 3 $69,507 19 $158,214 30 $75,925 4 $38,660 3 $150,320 FILES CLOSED FOR INCOMPLETENESS 0 $0 7 $158,920 9 $102,320 0 $0 0 $0
Aggregated Statistics For Year 1999(Based on 1 full and 3 partial tracts) A) FHA, FSA/RHS & VA B) Conventional C) Refinancings D) Home Improvement Loans E) Loans on Dwellings For 5+ Families F) Non-occupant Loans on Number Average Value Number Average Value Number Average Value Number Average Value Number Average Value Number Average Value
LOANS ORIGINATED 157 $105,323 458 $125,694 297 $122,006 95 $57,321 6 $605,075 161 $121,504 APPLICATIONS APPROVED, NOT ACCEPTED 5 $112,544 38 $133,239 80 $104,198 24 $26,968 0 $0 22 $103,343 APPLICATIONS DENIED 7 $128,987 84 $125,630 208 $96,716 48 $26,471 0 $0 36 $141,478 APPLICATIONS WITHDRAWN 14 $110,011 78 $126,133 122 $100,738 8 $52,445 1 $100,920 26 $149,515 FILES CLOSED FOR INCOMPLETENESS 3 $109,657 17 $137,133 39 $108,718 2 $18,350 0 $0 7 $148,640
Detailed mortgage data for all 14 tracts in Cathedral City, CA
Private Mortgage Insurance Companies Aggregated Statistics For Year 2009(Based on 10 full and 6 partial tracts) A) Conventional B) Refinancings C) Non-occupant Loans on Number Average Value Number Average Value Number Average Value
LOANS ORIGINATED 42 $165,470 3 $290,630 8 $176,005 APPLICATIONS APPROVED, NOT ACCEPTED 21 $191,418 1 $198,000 3 $208,697 APPLICATIONS DENIED 4 $223,875 7 $316,413 2 $126,580 APPLICATIONS WITHDRAWN 3 $53,950 1 $199,890 3 $97,007 FILES CLOSED FOR INCOMPLETENESS 3 $195,803 2 $313,445 0 $0
Aggregated Statistics For Year 2008(Based on 10 full and 6 partial tracts) A) Conventional B) Refinancings C) Non-occupant Loans on Number Average Value Number Average Value Number Average Value
LOANS ORIGINATED 101 $236,566 43 $306,586 15 $242,888 APPLICATIONS APPROVED, NOT ACCEPTED 70 $265,023 61 $320,131 21 $275,969 APPLICATIONS DENIED 11 $212,563 10 $306,953 8 $237,119 APPLICATIONS WITHDRAWN 8 $286,600 9 $318,556 2 $285,000 FILES CLOSED FOR INCOMPLETENESS 7 $284,850 3 $267,667 2 $289,500
Aggregated Statistics For Year 2007(Based on 10 full and 6 partial tracts) A) Conventional B) Refinancings C) Non-occupant Loans on Number Average Value Number Average Value Number Average Value
LOANS ORIGINATED 94 $315,335 82 $325,683 32 $294,041 APPLICATIONS APPROVED, NOT ACCEPTED 12 $319,216 24 $338,048 2 $326,960 APPLICATIONS DENIED 6 $431,333 1 $95,960 0 $0 APPLICATIONS WITHDRAWN 6 $317,258 9 $409,000 3 $331,763 FILES CLOSED FOR INCOMPLETENESS 0 $0 1 $351,000 0 $0
Aggregated Statistics For Year 2006(Based on 10 full and 5 partial tracts) A) Conventional B) Refinancings C) Non-occupant Loans on D) Loans On Manufactured Number Average Value Number Average Value Number Average Value Number Average Value
LOANS ORIGINATED 39 $327,317 43 $335,343 17 $252,783 0 $0 APPLICATIONS APPROVED, NOT ACCEPTED 9 $280,197 15 $349,111 5 $249,758 2 $256,600 APPLICATIONS DENIED 3 $449,110 2 $441,000 0 $0 0 $0 APPLICATIONS WITHDRAWN 1 $464,420 10 $387,316 1 $260,000 0 $0 FILES CLOSED FOR INCOMPLETENESS 0 $0 0 $0 0 $0 0 $0
Aggregated Statistics For Year 2005(Based on 10 full and 6 partial tracts) A) Conventional B) Refinancings C) Non-occupant Loans on Number Average Value Number Average Value Number Average Value
LOANS ORIGINATED 80 $284,512 47 $302,651 21 $253,972 APPLICATIONS APPROVED, NOT ACCEPTED 19 $265,533 8 $238,538 5 $247,002 APPLICATIONS DENIED 1 $188,570 2 $315,200 1 $188,570 APPLICATIONS WITHDRAWN 8 $295,482 1 $400,000 1 $490,270 FILES CLOSED FOR INCOMPLETENESS 0 $0 0 $0 0 $0
Aggregated Statistics For Year 2004(Based on 10 full and 6 partial tracts) A) Conventional B) Refinancings C) Non-occupant Loans on Number Average Value Number Average Value Number Average Value
LOANS ORIGINATED 192 $217,262 51 $200,963 68 $204,546 APPLICATIONS APPROVED, NOT ACCEPTED 32 $214,712 19 $197,888 20 $190,764 APPLICATIONS DENIED 2 $301,675 1 $185,000 0 $0 APPLICATIONS WITHDRAWN 15 $221,241 4 $202,002 5 $218,000 FILES CLOSED FOR INCOMPLETENESS 4 $185,500 1 $227,690 0 $0
Aggregated Statistics For Year 2003(Based on 10 full and 6 partial tracts) A) Conventional B) Refinancings C) Non-occupant Loans on Number Average Value Number Average Value Number Average Value
LOANS ORIGINATED 306 $180,950 130 $173,959 78 $156,895 APPLICATIONS APPROVED, NOT ACCEPTED 38 $185,025 43 $186,333 16 $144,344 APPLICATIONS DENIED 4 $122,385 3 $196,667 0 $0 APPLICATIONS WITHDRAWN 24 $190,475 7 $169,571 11 $153,326 FILES CLOSED FOR INCOMPLETENESS 0 $0 0 $0 0 $0
Aggregated Statistics For Year 2002(Based on 1 full tract) A) Conventional B) Refinancings C) Non-occupant Loans on Number Average Value Number Average Value Number Average Value
LOANS ORIGINATED 10 $166,217 5 $177,990 4 $206,772 APPLICATIONS APPROVED, NOT ACCEPTED 4 $178,838 5 $211,312 0 $0 APPLICATIONS DENIED 2 $287,340 0 $0 2 $287,340 APPLICATIONS WITHDRAWN 0 $0 0 $0 0 $0 FILES CLOSED FOR INCOMPLETENESS 0 $0 0 $0 0 $0
Aggregated Statistics For Year 2001(Based on 1 full tract) A) Conventional B) Refinancings C) Non-occupant Loans on Number Average Value Number Average Value Number Average Value
LOANS ORIGINATED 12 $167,281 3 $184,243 4 $170,108 APPLICATIONS APPROVED, NOT ACCEPTED 0 $0 1 $142,670 1 $142,670 APPLICATIONS DENIED 0 $0 0 $0 0 $0 APPLICATIONS WITHDRAWN 0 $0 0 $0 0 $0 FILES CLOSED FOR INCOMPLETENESS 0 $0 0 $0 0 $0
Aggregated Statistics For Year 2000(Based on 1 full tract) A) Conventional B) Refinancings C) Non-occupant Loans on Number Average Value Number Average Value Number Average Value
LOANS ORIGINATED 16 $145,539 6 $121,387 2 $97,275 APPLICATIONS APPROVED, NOT ACCEPTED 0 $0 1 $148,660 0 $0 APPLICATIONS DENIED 1 $118,730 0 $0 0 $0 APPLICATIONS WITHDRAWN 1 $83,810 0 $0 0 $0 FILES CLOSED FOR INCOMPLETENESS 0 $0 0 $0 0 $0
Aggregated Statistics For Year 1999(Based on 1 full and 3 partial tracts) A) Conventional B) Refinancings C) Non-occupant Loans on Number Average Value Number Average Value Number Average Value
LOANS ORIGINATED 103 $114,381 30 $115,599 25 $96,065 APPLICATIONS APPROVED, NOT ACCEPTED 6 $106,308 7 $106,286 2 $118,665 APPLICATIONS DENIED 7 $99,311 2 $89,245 2 $58,180 APPLICATIONS WITHDRAWN 3 $79,423 1 $56,220 1 $62,210 FILES CLOSED FOR INCOMPLETENESS 1 $71,000 1 $167,290 0 $0
Fire-safe hotels and motels in Cathedral City, California:
Quaility Inn & Suites Date Palm, 69151 E Palm Cyn Dr, Cathedral City, California 92234 Phone: (619) 324-5939
DoubleTree by Hilton Golf Resort Palm Springs, 67967 Vis Chino, Cathedral City, California 92234 Phone: (760) 322-7000, Fax: (760) 322-6853
Staybridge Suites Cathedral City, 67711 30th Ave, Cathedral city, California 92234 Phone: (877) 238-8889, Fax: (760) 680-7071
All 3 fire-safe hotels and motels in Cathedral City, California
Most common first names in Cathedral City, CA among deceased individuals Name Count Lived (average)
John 144 73.3 years James 138 69.6 years Robert 136 72.6 years William 126 74.2 years Mary 85 79.2 years Richard 82 71.9 years Joseph 75 75.9 years Charles 73 74.4 years George 69 75.4 years Donald 57 72.3 years
Most common last names in Cathedral City, CA among deceased individuals Last name Count Lived (average)
Smith 49 70.7 years Johnson 38 75.9 years Davis 29 77.3 years Miller 26 77.5 years Brown 24 71.6 years Anderson 23 77.6 years Jones 23 77.7 years Williams 22 70.2 years Wilson 21 77.7 years Martin 19 77.9 years
Cathedral City compared to California state average:
Median house value below state average. Unemployed percentage significantly below state average. Black race population percentage below state average. Hispanic race population percentage above state average. Length of stay since moving in significantly above state average. House age below state average. Cathedral City on our top lists :
#1 on the list of "Top 101 cities with the largest percentage of likely gay men couples (counted as self-reported male-male unmarried-partner households) (population 50,000+)"
#1 on the list of "Top 101 cities with the largest percentage of likely homosexual households (counted as self-reported same-sex unmarried-partner households) (population 50,000+)"
#1 on the list of "Top 101 cities with largest percentage of males in industries: administrative and support and waste management services (population 50,000+)"
#1 on the list of "Top 101 cities with largest percentage of females in occupations: building and grounds cleaning and maintenance occupations (population 50,000+)"
#3 on the list of "Top 101 cities with largest percentage of males in occupations: building and grounds cleaning and maintenance occupations (population 50,000+)"
#4 on the list of "Top 101 cities with the highest daily high temperatures (population 50,000+)"
#6 on the list of "Top 101 cities with largest percentage of females in industries: accommodation and food services (population 50,000+)"
#9 on the list of "Top 101 cities with the largest percentage of unmarried partner households (population 50,000+)"
#9 on the list of "Top 101 cities with the hottest summers (population 50,000+)"
#9 on the list of "Top 101 cities with the lowest average yearly precipitation (population 50,000+)"
#10 on the list of "Top 100 cities with strongest arts, entertainment, recreation, accommodation and food services industries (pop. 50,000+)"
#13 on the list of "Top 101 cities with largest percentage of females in occupations: food preparation and serving related occupations (population 50,000+)"
#15 on the list of "Top 101 cities with the lowest number of police officers per 1000 residents (population 50,000+)"
#22 on the list of "Top 101 cities with the largest percentage of likely lesbian couples (counted as self-reported female-female unmarried-partner households) (population 50,000+)"
#22 on the list of "Top 100 cities with the largest percentage of males (pop. 50,000+)"
#25 on the list of "Top 101 cities with largest percentage of males in industries: arts, entertainment, and recreation (population 50,000+)"
#41 on the list of "Top 101 cities with largest percentage of females in industries: administrative and support and waste management services (population 50,000+)"
#45 on the list of "Top 101 cities with the largest differences between daily high and daily low temperatures (population 50,000+)"
#45 on the list of "Top 101 cities with largest percentage of females in industries: arts, entertainment, and recreation (population 50,000+)"
#46 on the list of "Top 101 cities with the largest city-data.com crime index decrease from 2011 to 2012 (population 50,000+)"
#26 (92270) on the list of "Top 101 zip codes with the smallest percentage of returns reporting salary or wage in 2012 (pop 5,000+)"
#80 (92264) on the list of "Top 101 zip codes with the most hotels or motels in 2005"
#97 (92270) on the list of "Top 101 zip codes with the most offices of physicians in 2005"
#3 on the list of "Top 101 counties with the highest lead air pollution readings in 2012 (µg/m3 )"
#4 on the list of "Top 101 counties with the highest ground withdrawal of fresh water for public supply"
#11 on the list of "Top 101 counties with the most Catholic adherents"
#11 on the list of "Top 101 counties with the highest total withdrawal of fresh water for public supply"
#12 on the list of "Top 101 counties with the highest carbon monoxide air pollution readings in 2012 (ppm)"
Top Patent Applicants
Allan Yang Wu (5)
Clark E. Zellmer (3)
Bruce Alan Sheppard (2)
James A. Siegrist (1)
James David Heil (1)
James Siegrist (1)
Kenneth Sykes Patten (1)
Zahid Hussain (1)
Max Rye (1)
Cameron L. Demille (1)
Total of 26 patent applications in 2008-2024.
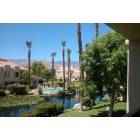
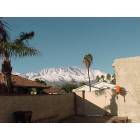
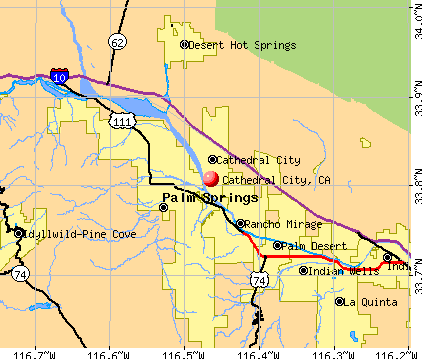


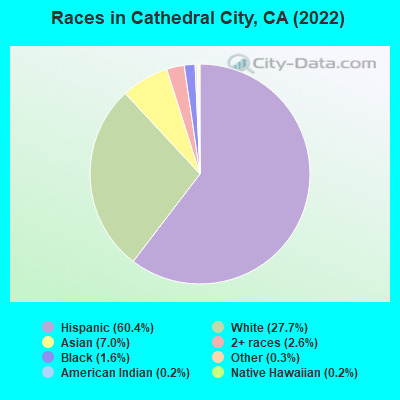
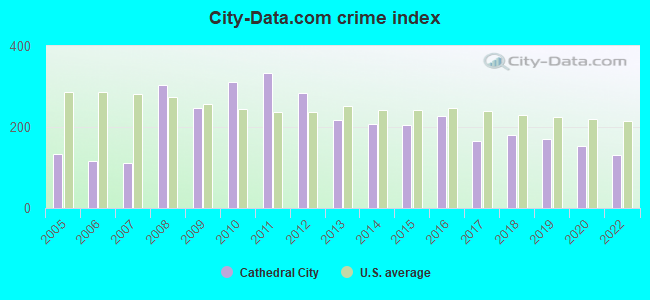
 Recent articles from our blog. Our writers, many of them Ph.D. graduates or candidates, create easy-to-read articles on a wide variety of topics.

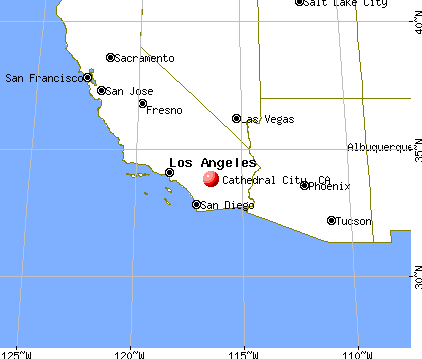
 (20.8 miles
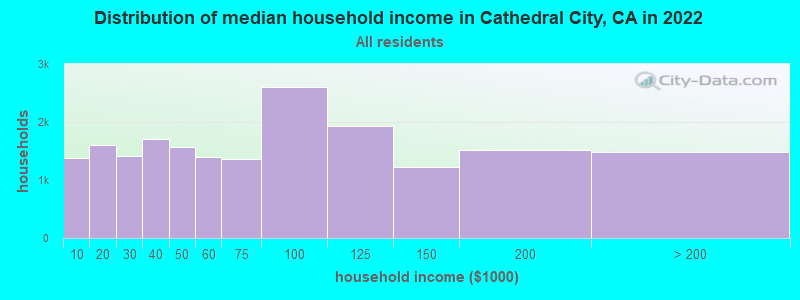
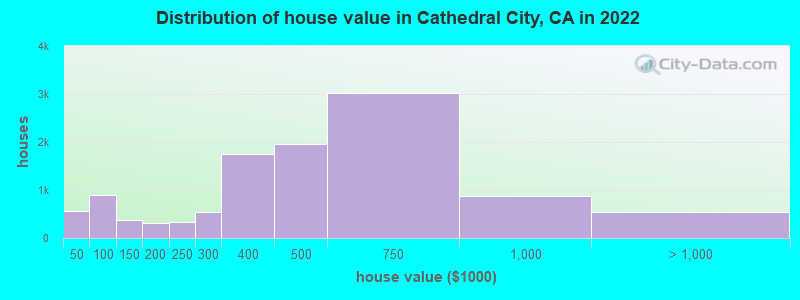

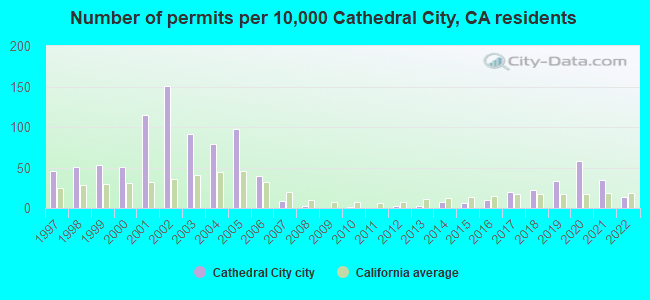
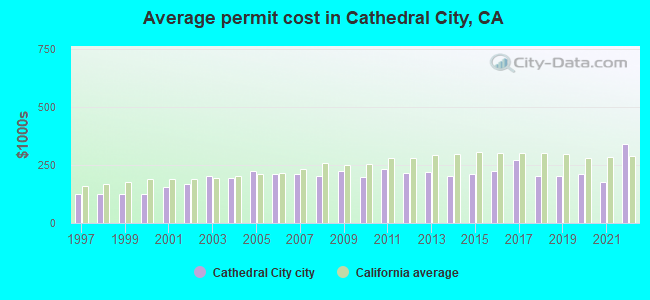
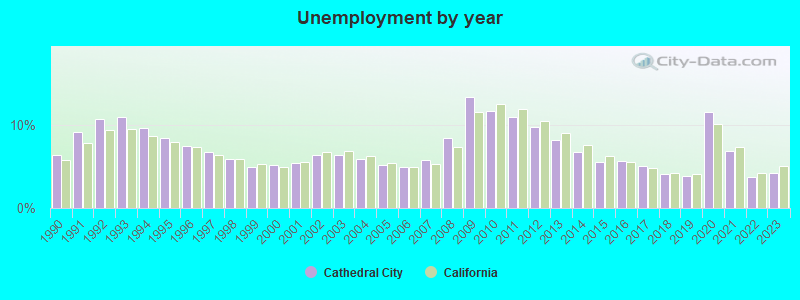
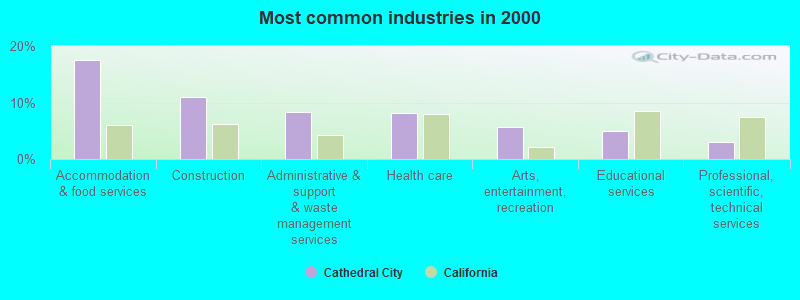

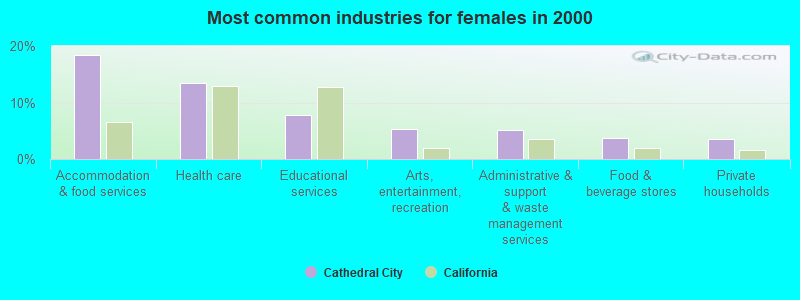
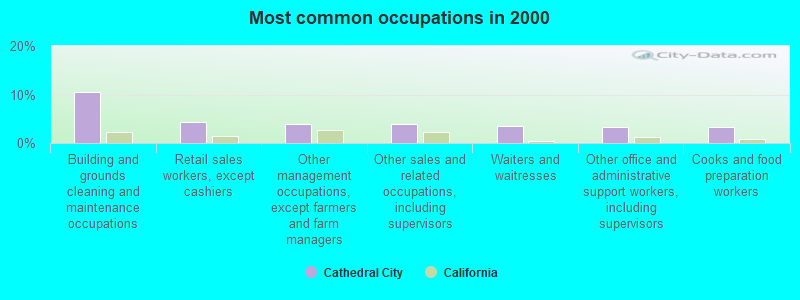
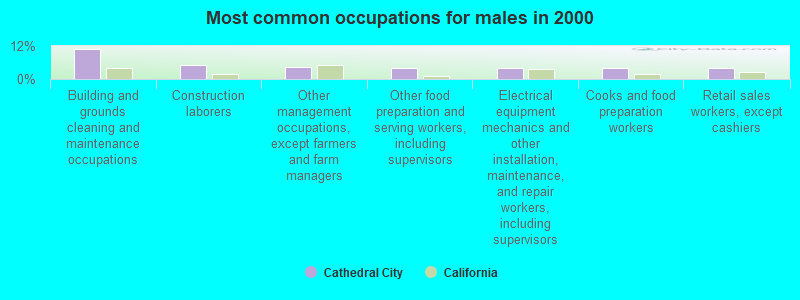
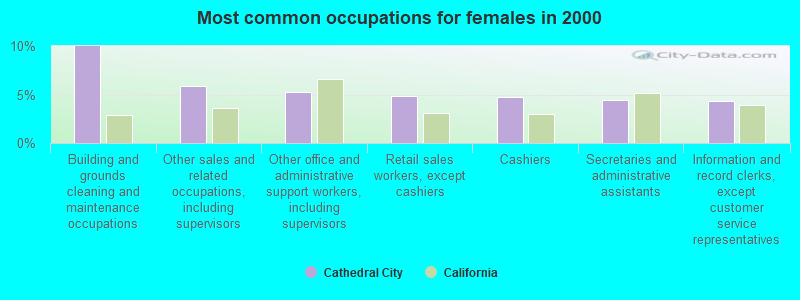


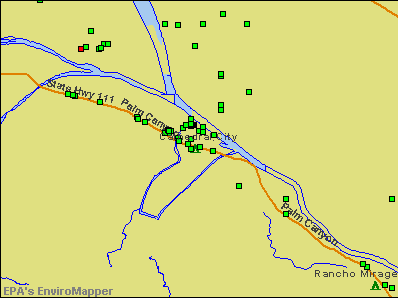

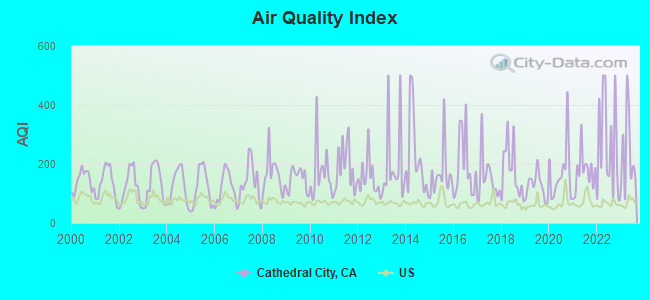
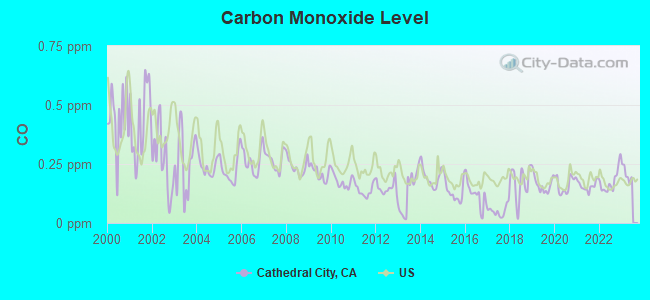
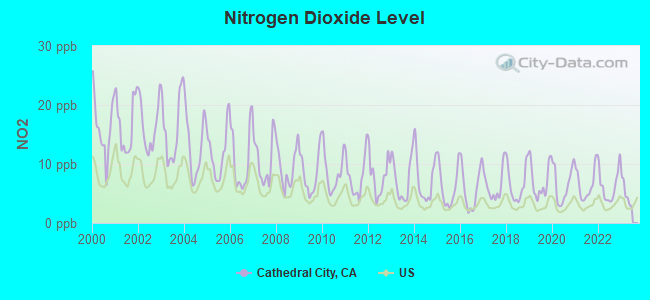
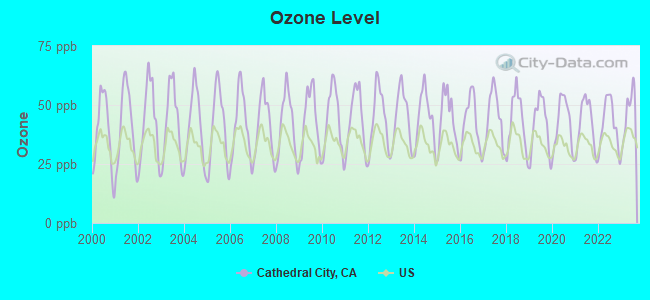
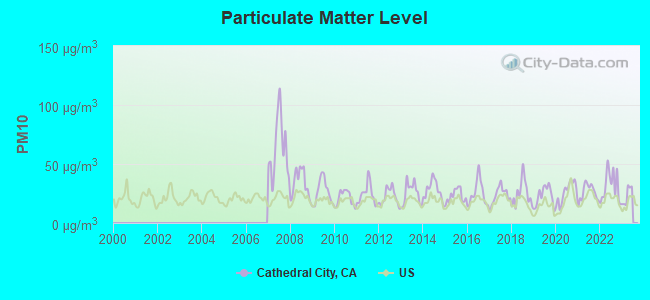
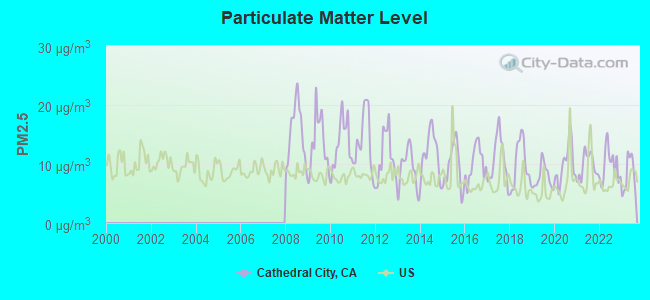

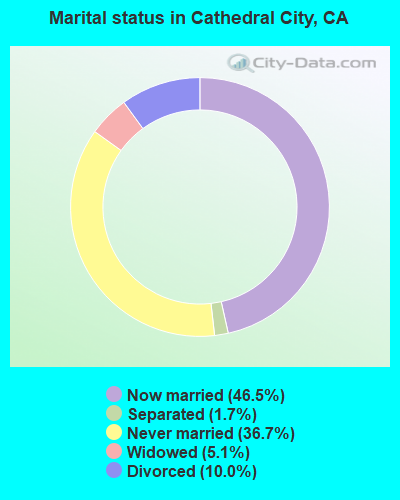
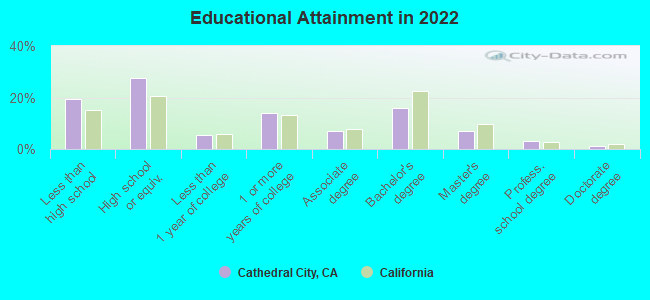
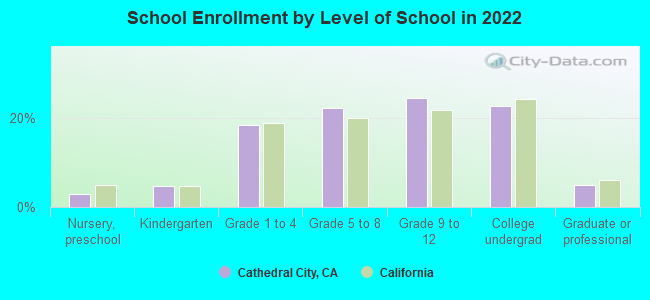
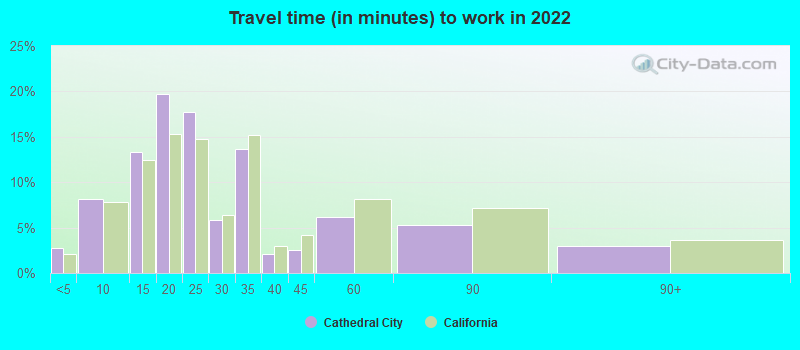
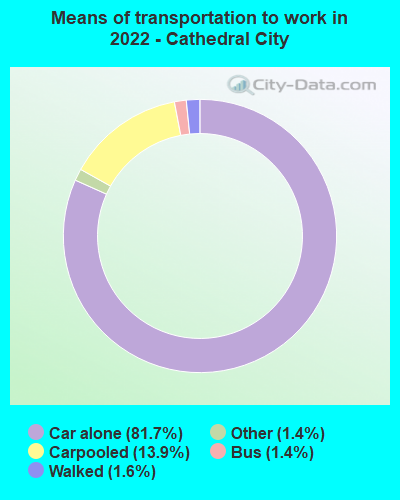


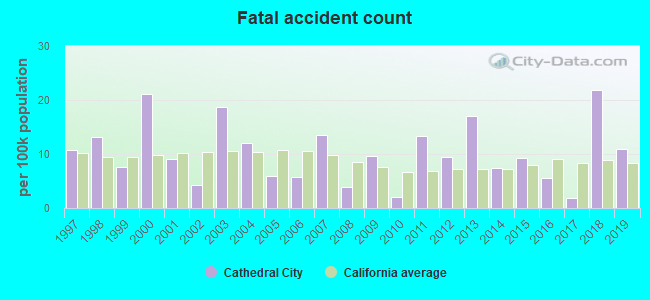
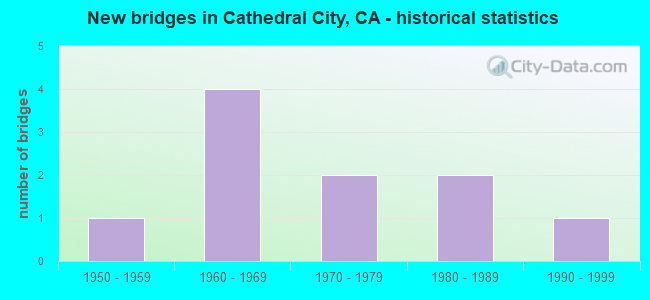
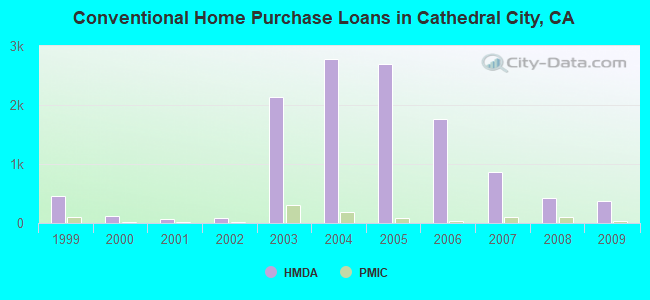
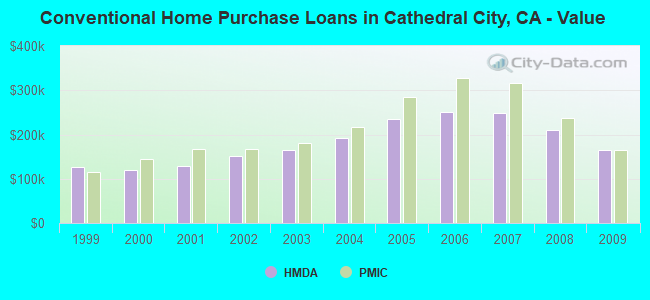
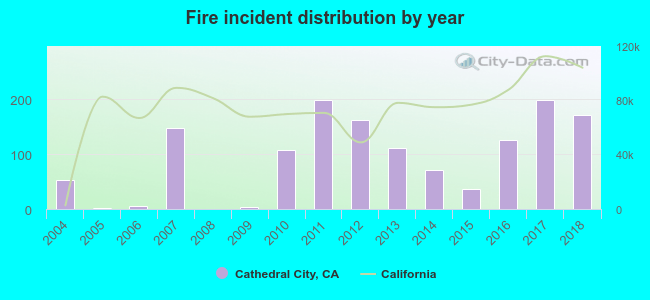 Based on the data from the years 2004 - 2018 the average number of fires per year is 93. The highest number of fire incidents - 198 took place in 2011, and the least - 0 in 2008. The data has a growing trend.
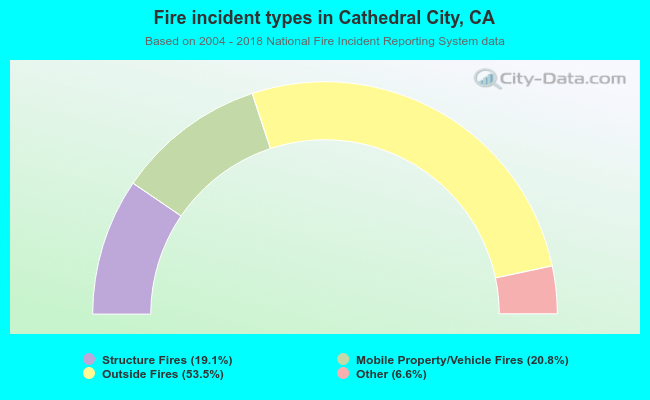 When looking into fire subcategories, the most reports belonged to: Outside Fires (53.5%), and Mobile Property/Vehicle Fires (20.8%).