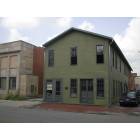
Bucyrus, Ohio Submit your own pictures of this city and show them to the world
OSM Map
General Map
Google Map
MSN Map
OSM Map
General Map
Google Map
MSN Map
OSM Map
General Map
Google Map
MSN Map
OSM Map
General Map
Google Map
MSN Map
Please wait while loading the map...
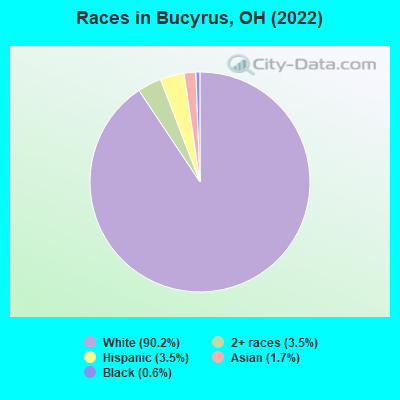
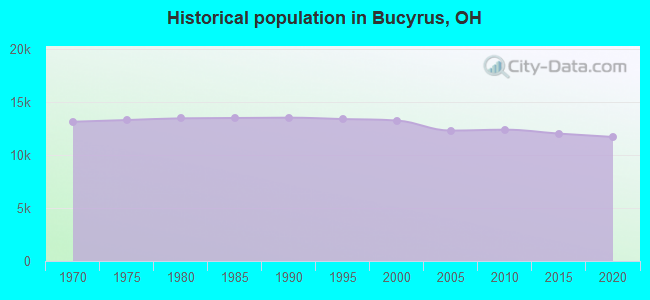
Population in 2022: 11,538 (99% urban, 1% rural). Population change since 2000: -12.7%Males: 5,828 Females: 5,710
March 2022 cost of living index in Bucyrus: 76.1 (low, U.S. average is 100) Percentage of residents living in poverty in 2022: 19.9%for White Non-Hispanic residents , 17.9% for Black residents , 30.8% for Hispanic or Latino residents , 45.0% for two or more races residents )Business Search - 14 Million verified businesses
Data:
Median household income ($)
Median household income (% change since 2000)
Household income diversity
Ratio of average income to average house value (%)
Ratio of average income to average rent
Median household income ($) - White
Median household income ($) - Black or African American
Median household income ($) - Asian
Median household income ($) - Hispanic or Latino
Median household income ($) - American Indian and Alaska Native
Median household income ($) - Multirace
Median household income ($) - Other Race
Median household income for houses/condos with a mortgage ($)
Median household income for apartments without a mortgage ($)
Races - White alone (%)
Races - White alone (% change since 2000)
Races - Black alone (%)
Races - Black alone (% change since 2000)
Races - American Indian alone (%)
Races - American Indian alone (% change since 2000)
Races - Asian alone (%)
Races - Asian alone (% change since 2000)
Races - Hispanic (%)
Races - Hispanic (% change since 2000)
Races - Native Hawaiian and Other Pacific Islander alone (%)
Races - Native Hawaiian and Other Pacific Islander alone (% change since 2000)
Races - Two or more races (%)
Races - Two or more races (% change since 2000)
Races - Other race alone (%)
Races - Other race alone (% change since 2000)
Racial diversity
Unemployment (%)
Unemployment (% change since 2000)
Unemployment (%) - White
Unemployment (%) - Black or African American
Unemployment (%) - Asian
Unemployment (%) - Hispanic or Latino
Unemployment (%) - American Indian and Alaska Native
Unemployment (%) - Multirace
Unemployment (%) - Other Race
Population density (people per square mile)
Population - Males (%)
Population - Females (%)
Population - Males (%) - White
Population - Males (%) - Black or African American
Population - Males (%) - Asian
Population - Males (%) - Hispanic or Latino
Population - Males (%) - American Indian and Alaska Native
Population - Males (%) - Multirace
Population - Males (%) - Other Race
Population - Females (%) - White
Population - Females (%) - Black or African American
Population - Females (%) - Asian
Population - Females (%) - Hispanic or Latino
Population - Females (%) - American Indian and Alaska Native
Population - Females (%) - Multirace
Population - Females (%) - Other Race
Coronavirus confirmed cases (Jun 04, 2024)
Deaths caused by coronavirus (Jun 04, 2024)
Coronavirus confirmed cases (per 100k population) (Jun 04, 2024)
Deaths caused by coronavirus (per 100k population) (Jun 04, 2024)
Daily increase in number of cases (Jun 04, 2024)
Weekly increase in number of cases (Jun 04, 2024)
Cases doubled (in days) (Jun 04, 2024)
Hospitalized patients (Apr 18, 2022)
Negative test results (Apr 18, 2022)
Total test results (Apr 18, 2022)
COVID Vaccine doses distributed (per 100k population) (Sep 19, 2023)
COVID Vaccine doses administered (per 100k population) (Sep 19, 2023)
COVID Vaccine doses distributed (Sep 19, 2023)
COVID Vaccine doses administered (Sep 19, 2023)
Likely homosexual households (%)
Likely homosexual households (% change since 2000)
Likely homosexual households - Lesbian couples (%)
Likely homosexual households - Lesbian couples (% change since 2000)
Likely homosexual households - Gay men (%)
Likely homosexual households - Gay men (% change since 2000)
Cost of living index
Median gross rent ($)
Median contract rent ($)
Median monthly housing costs ($)
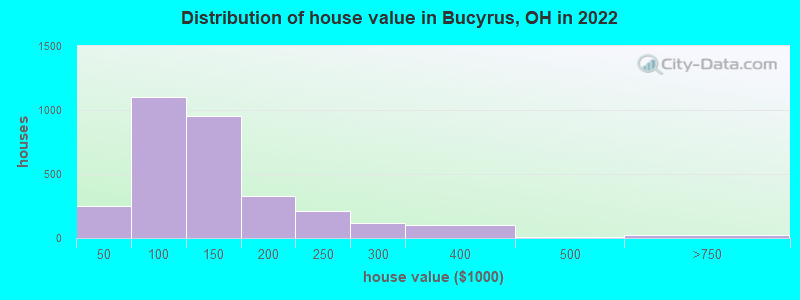
Median house or condo value ($)
Median house or condo value ($ change since 2000)
Mean house or condo value by units in structure - 1, detached ($)
Mean house or condo value by units in structure - 1, attached ($)
Mean house or condo value by units in structure - 2 ($)
Mean house or condo value by units in structure by units in structure - 3 or 4 ($)
Mean house or condo value by units in structure - 5 or more ($)
Mean house or condo value by units in structure - Boat, RV, van, etc. ($)
Mean house or condo value by units in structure - Mobile home ($)
Median house or condo value ($) - White
Median house or condo value ($) - Black or African American
Median house or condo value ($) - Asian
Median house or condo value ($) - Hispanic or Latino
Median house or condo value ($) - American Indian and Alaska Native
Median house or condo value ($) - Multirace
Median house or condo value ($) - Other Race
Median resident age
Resident age diversity
Median resident age - Males
Median resident age - Females
Median resident age - White
Median resident age - Black or African American
Median resident age - Asian
Median resident age - Hispanic or Latino
Median resident age - American Indian and Alaska Native
Median resident age - Multirace
Median resident age - Other Race
Median resident age - Males - White
Median resident age - Males - Black or African American
Median resident age - Males - Asian
Median resident age - Males - Hispanic or Latino
Median resident age - Males - American Indian and Alaska Native
Median resident age - Males - Multirace
Median resident age - Males - Other Race
Median resident age - Females - White
Median resident age - Females - Black or African American
Median resident age - Females - Asian
Median resident age - Females - Hispanic or Latino
Median resident age - Females - American Indian and Alaska Native
Median resident age - Females - Multirace
Median resident age - Females - Other Race
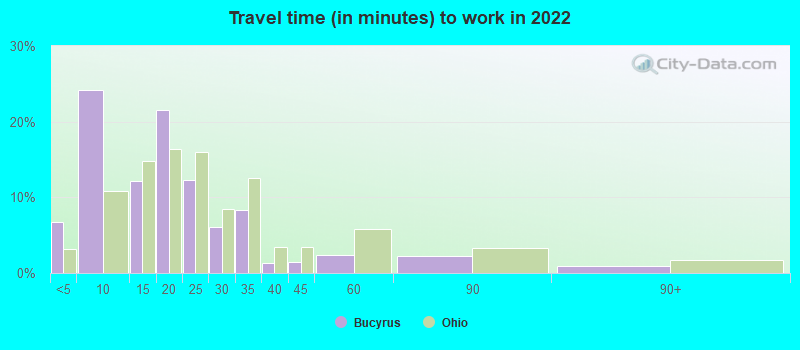
Commute - mean travel time to work (minutes)
Travel time to work - Less than 5 minutes (%)
Travel time to work - Less than 5 minutes (% change since 2000)
Travel time to work - 5 to 9 minutes (%)
Travel time to work - 5 to 9 minutes (% change since 2000)
Travel time to work - 10 to 19 minutes (%)
Travel time to work - 10 to 19 minutes (% change since 2000)
Travel time to work - 20 to 29 minutes (%)
Travel time to work - 20 to 29 minutes (% change since 2000)
Travel time to work - 30 to 39 minutes (%)
Travel time to work - 30 to 39 minutes (% change since 2000)
Travel time to work - 40 to 59 minutes (%)
Travel time to work - 40 to 59 minutes (% change since 2000)
Travel time to work - 60 to 89 minutes (%)
Travel time to work - 60 to 89 minutes (% change since 2000)
Travel time to work - 90 or more minutes (%)
Travel time to work - 90 or more minutes (% change since 2000)
Marital status - Never married (%)
Marital status - Now married (%)
Marital status - Separated (%)
Marital status - Widowed (%)
Marital status - Divorced (%)
Median family income ($)
Median family income (% change since 2000)
Median non-family income ($)
Median non-family income (% change since 2000)
Median per capita income ($)
Median per capita income (% change since 2000)
Median family income ($) - White
Median family income ($) - Black or African American
Median family income ($) - Asian
Median family income ($) - Hispanic or Latino
Median family income ($) - American Indian and Alaska Native
Median family income ($) - Multirace
Median family income ($) - Other Race
Median year house/condo built
Median year apartment built
Year house built - Built 2005 or later (%)
Year house built - Built 2000 to 2004 (%)
Year house built - Built 1990 to 1999 (%)
Year house built - Built 1980 to 1989 (%)
Year house built - Built 1970 to 1979 (%)
Year house built - Built 1960 to 1969 (%)
Year house built - Built 1950 to 1959 (%)
Year house built - Built 1940 to 1949 (%)
Year house built - Built 1939 or earlier (%)
Average household size
Household density (households per square mile)
Average household size - White
Average household size - Black or African American
Average household size - Asian
Average household size - Hispanic or Latino
Average household size - American Indian and Alaska Native
Average household size - Multirace
Average household size - Other Race
Occupied housing units (%)
Vacant housing units (%)
Owner occupied housing units (%)
Renter occupied housing units (%)
Vacancy status - For rent (%)
Vacancy status - For sale only (%)
Vacancy status - Rented or sold, not occupied (%)
Vacancy status - For seasonal, recreational, or occasional use (%)
Vacancy status - For migrant workers (%)
Vacancy status - Other vacant (%)
Residents with income below the poverty level (%)
Residents with income below 50% of the poverty level (%)
Children below poverty level (%)
Poor families by family type - Married-couple family (%)
Poor families by family type - Male, no wife present (%)
Poor families by family type - Female, no husband present (%)
Poverty status for native-born residents (%)
Poverty status for foreign-born residents (%)
Poverty among high school graduates not in families (%)
Poverty among people who did not graduate high school not in families (%)
Residents with income below the poverty level (%) - White
Residents with income below the poverty level (%) - Black or African American
Residents with income below the poverty level (%) - Asian
Residents with income below the poverty level (%) - Hispanic or Latino
Residents with income below the poverty level (%) - American Indian and Alaska Native
Residents with income below the poverty level (%) - Multirace
Residents with income below the poverty level (%) - Other Race
Air pollution - Air Quality Index (AQI)
Air pollution - CO
Air pollution - NO2
Air pollution - SO2
Air pollution - Ozone
Air pollution - PM10
Air pollution - PM25
Air pollution - Pb
Crime - Murders per 100,000 population
Crime - Rapes per 100,000 population
Crime - Robberies per 100,000 population
Crime - Assaults per 100,000 population
Crime - Burglaries per 100,000 population
Crime - Thefts per 100,000 population
Crime - Auto thefts per 100,000 population
Crime - Arson per 100,000 population
Crime - City-data.com crime index
Crime - Violent crime index
Crime - Property crime index
Crime - Murders per 100,000 population (5 year average)
Crime - Rapes per 100,000 population (5 year average)
Crime - Robberies per 100,000 population (5 year average)
Crime - Assaults per 100,000 population (5 year average)
Crime - Burglaries per 100,000 population (5 year average)
Crime - Thefts per 100,000 population (5 year average)
Crime - Auto thefts per 100,000 population (5 year average)
Crime - Arson per 100,000 population (5 year average)
Crime - City-data.com crime index (5 year average)
Crime - Violent crime index (5 year average)
Crime - Property crime index (5 year average)
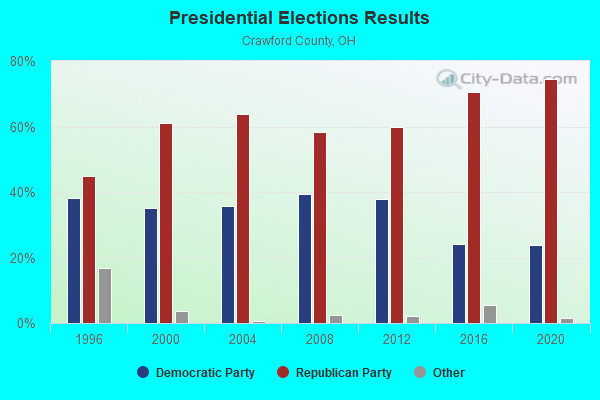
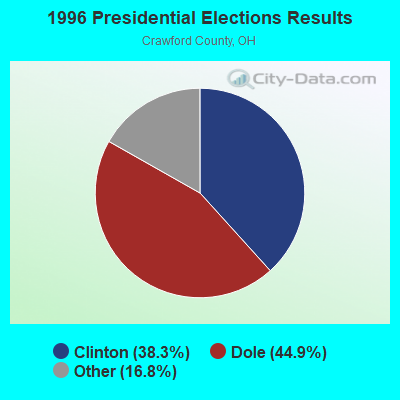
1996 Presidential Elections Results (%) - Democratic Party (Clinton)
1996 Presidential Elections Results (%) - Republican Party (Dole)
1996 Presidential Elections Results (%) - Other
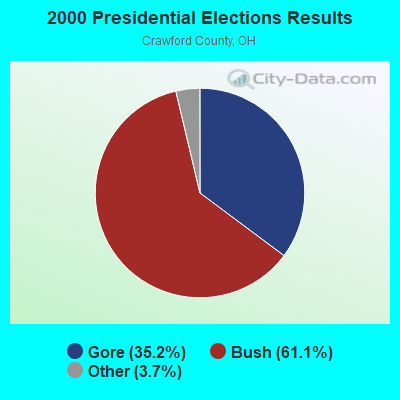
2000 Presidential Elections Results (%) - Democratic Party (Gore)
2000 Presidential Elections Results (%) - Republican Party (Bush)
2000 Presidential Elections Results (%) - Other
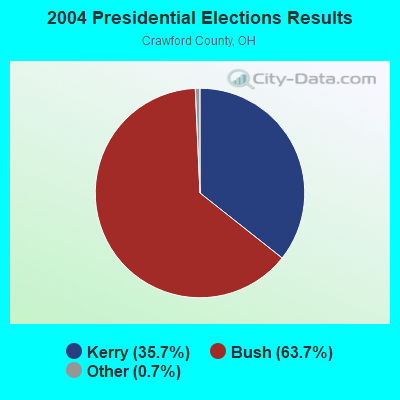
2004 Presidential Elections Results (%) - Democratic Party (Kerry)
2004 Presidential Elections Results (%) - Republican Party (Bush)
2004 Presidential Elections Results (%) - Other
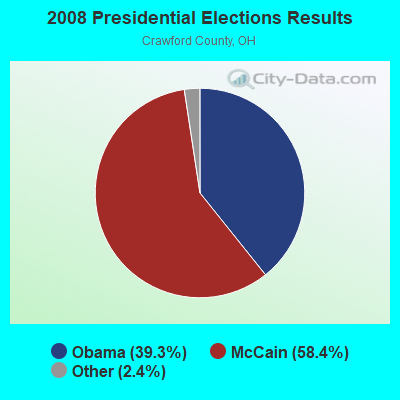
2008 Presidential Elections Results (%) - Democratic Party (Obama)
2008 Presidential Elections Results (%) - Republican Party (McCain)
2008 Presidential Elections Results (%) - Other
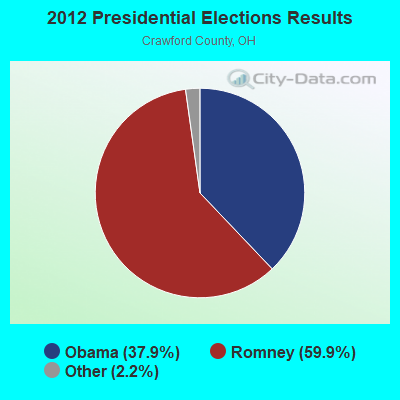
2012 Presidential Elections Results (%) - Democratic Party (Obama)
2012 Presidential Elections Results (%) - Republican Party (Romney)
2012 Presidential Elections Results (%) - Other
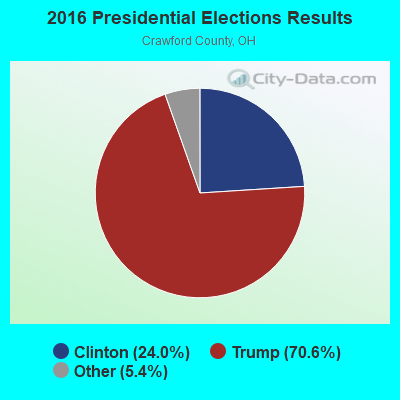
2016 Presidential Elections Results (%) - Democratic Party (Clinton)
2016 Presidential Elections Results (%) - Republican Party (Trump)
2016 Presidential Elections Results (%) - Other
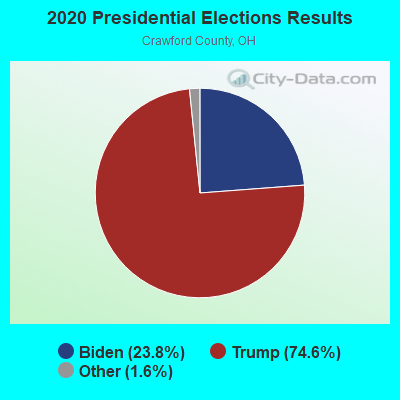
2020 Presidential Elections Results (%) - Democratic Party (Biden)
2020 Presidential Elections Results (%) - Republican Party (Trump)
2020 Presidential Elections Results (%) - Other
Ancestries Reported - Arab (%)
Ancestries Reported - Czech (%)
Ancestries Reported - Danish (%)
Ancestries Reported - Dutch (%)
Ancestries Reported - English (%)
Ancestries Reported - French (%)
Ancestries Reported - French Canadian (%)
Ancestries Reported - German (%)
Ancestries Reported - Greek (%)
Ancestries Reported - Hungarian (%)
Ancestries Reported - Irish (%)
Ancestries Reported - Italian (%)
Ancestries Reported - Lithuanian (%)
Ancestries Reported - Norwegian (%)
Ancestries Reported - Polish (%)
Ancestries Reported - Portuguese (%)
Ancestries Reported - Russian (%)
Ancestries Reported - Scotch-Irish (%)
Ancestries Reported - Scottish (%)
Ancestries Reported - Slovak (%)
Ancestries Reported - Subsaharan African (%)
Ancestries Reported - Swedish (%)
Ancestries Reported - Swiss (%)
Ancestries Reported - Ukrainian (%)
Ancestries Reported - United States (%)
Ancestries Reported - Welsh (%)
Ancestries Reported - West Indian (%)
Ancestries Reported - Other (%)
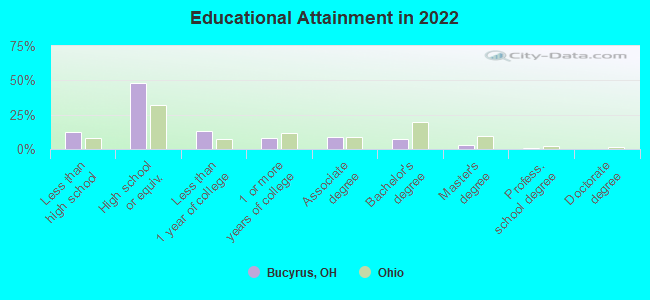
Educational Attainment - No schooling completed (%)
Educational Attainment - Less than high school (%)
Educational Attainment - High school or equivalent (%)
Educational Attainment - Less than 1 year of college (%)
Educational Attainment - 1 or more years of college (%)
Educational Attainment - Associate degree (%)
Educational Attainment - Bachelor's degree (%)
Educational Attainment - Master's degree (%)
Educational Attainment - Professional school degree (%)
Educational Attainment - Doctorate degree (%)
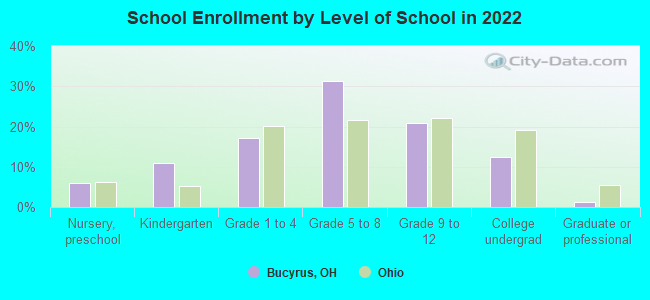
School Enrollment - Nursery, preschool (%)
School Enrollment - Kindergarten (%)
School Enrollment - Grade 1 to 4 (%)
School Enrollment - Grade 5 to 8 (%)
School Enrollment - Grade 9 to 12 (%)
School Enrollment - College undergrad (%)
School Enrollment - Graduate or professional (%)
School Enrollment - Not enrolled in school (%)
School enrollment - Public schools (%)
School enrollment - Private schools (%)
School enrollment - Not enrolled (%)
Median number of rooms in houses and condos
Median number of rooms in apartments
Housing units lacking complete plumbing facilities (%)
Housing units lacking complete kitchen facilities (%)
Density of houses
Urban houses (%)
Rural houses (%)
Households with people 60 years and over (%)
Households with people 65 years and over (%)
Households with people 75 years and over (%)
Households with one or more nonrelatives (%)
Households with no nonrelatives (%)
Population in households (%)
Family households (%)
Nonfamily households (%)
Population in families (%)
Family households with own children (%)
Median number of bedrooms in owner occupied houses
Mean number of bedrooms in owner occupied houses
Median number of bedrooms in renter occupied houses
Mean number of bedrooms in renter occupied houses
Median number of vehichles in owner occupied houses
Mean number of vehichles in owner occupied houses
Median number of vehichles in renter occupied houses
Mean number of vehichles in renter occupied houses
Mortgage status - with mortgage (%)
Mortgage status - with second mortgage (%)
Mortgage status - with home equity loan (%)
Mortgage status - with both second mortgage and home equity loan (%)
Mortgage status - without a mortgage (%)
Average family size
Average family size - White
Average family size - Black or African American
Average family size - Asian
Average family size - Hispanic or Latino
Average family size - American Indian and Alaska Native
Average family size - Multirace
Average family size - Other Race
Geographical mobility - Same house 1 year ago (%)
Geographical mobility - Moved within same county (%)
Geographical mobility - Moved from different county within same state (%)
Geographical mobility - Moved from different state (%)
Geographical mobility - Moved from abroad (%)
Place of birth - Born in state of residence (%)
Place of birth - Born in other state (%)
Place of birth - Native, outside of US (%)
Place of birth - Foreign born (%)
Housing units in structures - 1, detached (%)
Housing units in structures - 1, attached (%)
Housing units in structures - 2 (%)
Housing units in structures - 3 or 4 (%)
Housing units in structures - 5 to 9 (%)
Housing units in structures - 10 to 19 (%)
Housing units in structures - 20 to 49 (%)
Housing units in structures - 50 or more (%)
Housing units in structures - Mobile home (%)
Housing units in structures - Boat, RV, van, etc. (%)
House/condo owner moved in on average (years ago)
Renter moved in on average (years ago)
Year householder moved into unit - Moved in 1999 to March 2000 (%)
Year householder moved into unit - Moved in 1995 to 1998 (%)
Year householder moved into unit - Moved in 1990 to 1994 (%)
Year householder moved into unit - Moved in 1980 to 1989 (%)
Year householder moved into unit - Moved in 1970 to 1979 (%)
Year householder moved into unit - Moved in 1969 or earlier (%)
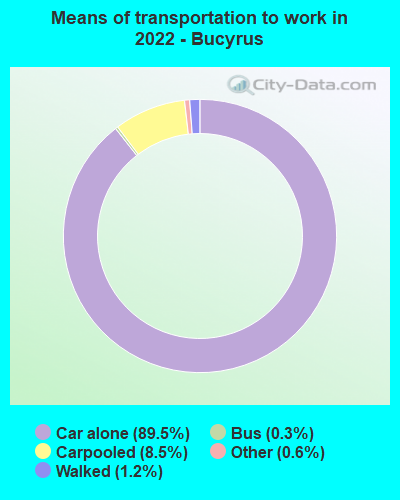
Means of transportation to work - Drove car alone (%)
Means of transportation to work - Carpooled (%)
Means of transportation to work - Public transportation (%)
Means of transportation to work - Bus or trolley bus (%)
Means of transportation to work - Streetcar or trolley car (%)
Means of transportation to work - Subway or elevated (%)
Means of transportation to work - Railroad (%)
Means of transportation to work - Ferryboat (%)
Means of transportation to work - Taxicab (%)
Means of transportation to work - Motorcycle (%)
Means of transportation to work - Bicycle (%)
Means of transportation to work - Walked (%)
Means of transportation to work - Other means (%)
Working at home (%)
Industry diversity
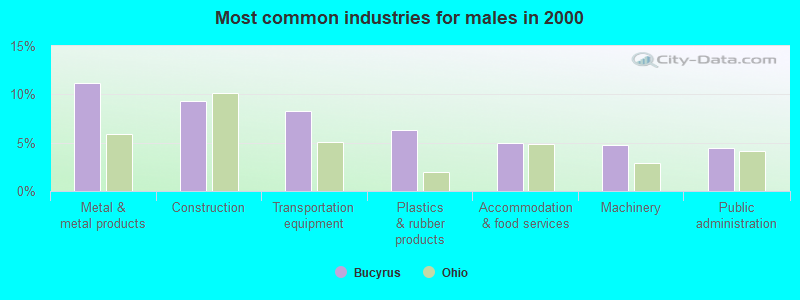
Most Common Industries - Agriculture, forestry, fishing and hunting, and mining (%)
Most Common Industries - Agriculture, forestry, fishing and hunting (%)
Most Common Industries - Mining, quarrying, and oil and gas extraction (%)
Most Common Industries - Construction (%)
Most Common Industries - Manufacturing (%)
Most Common Industries - Wholesale trade (%)
Most Common Industries - Retail trade (%)
Most Common Industries - Transportation and warehousing, and utilities (%)
Most Common Industries - Transportation and warehousing (%)
Most Common Industries - Utilities (%)
Most Common Industries - Information (%)
Most Common Industries - Finance and insurance, and real estate and rental and leasing (%)
Most Common Industries - Finance and insurance (%)
Most Common Industries - Real estate and rental and leasing (%)
Most Common Industries - Professional, scientific, and management, and administrative and waste management services (%)
Most Common Industries - Professional, scientific, and technical services (%)
Most Common Industries - Management of companies and enterprises (%)
Most Common Industries - Administrative and support and waste management services (%)
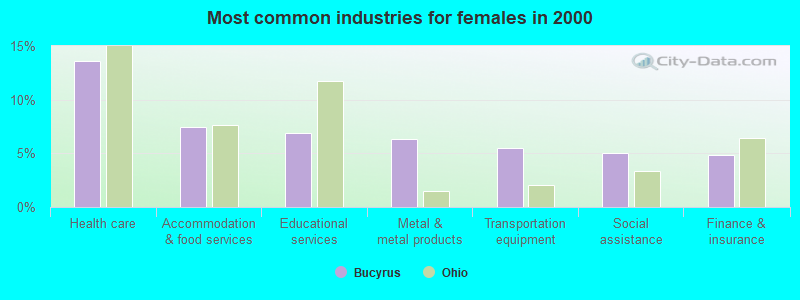
Most Common Industries - Educational services, and health care and social assistance (%)
Most Common Industries - Educational services (%)
Most Common Industries - Health care and social assistance (%)
Most Common Industries - Arts, entertainment, and recreation, and accommodation and food services (%)
Most Common Industries - Arts, entertainment, and recreation (%)
Most Common Industries - Accommodation and food services (%)
Most Common Industries - Other services, except public administration (%)
Most Common Industries - Public administration (%)
Occupation diversity
Most Common Occupations - Management, business, science, and arts occupations (%)
Most Common Occupations - Management, business, and financial occupations (%)
Most Common Occupations - Management occupations (%)
Most Common Occupations - Business and financial operations occupations (%)
Most Common Occupations - Computer, engineering, and science occupations (%)
Most Common Occupations - Computer and mathematical occupations (%)
Most Common Occupations - Architecture and engineering occupations (%)
Most Common Occupations - Life, physical, and social science occupations (%)
Most Common Occupations - Education, legal, community service, arts, and media occupations (%)
Most Common Occupations - Community and social service occupations (%)
Most Common Occupations - Legal occupations (%)
Most Common Occupations - Education, training, and library occupations (%)
Most Common Occupations - Arts, design, entertainment, sports, and media occupations (%)
Most Common Occupations - Healthcare practitioners and technical occupations (%)
Most Common Occupations - Health diagnosing and treating practitioners and other technical occupations (%)
Most Common Occupations - Health technologists and technicians (%)
Most Common Occupations - Service occupations (%)
Most Common Occupations - Healthcare support occupations (%)
Most Common Occupations - Protective service occupations (%)
Most Common Occupations - Fire fighting and prevention, and other protective service workers including supervisors (%)
Most Common Occupations - Law enforcement workers including supervisors (%)
Most Common Occupations - Food preparation and serving related occupations (%)
Most Common Occupations - Building and grounds cleaning and maintenance occupations (%)
Most Common Occupations - Personal care and service occupations (%)
Most Common Occupations - Sales and office occupations (%)
Most Common Occupations - Sales and related occupations (%)
Most Common Occupations - Office and administrative support occupations (%)
Most Common Occupations - Natural resources, construction, and maintenance occupations (%)
Most Common Occupations - Farming, fishing, and forestry occupations (%)
Most Common Occupations - Construction and extraction occupations (%)
Most Common Occupations - Installation, maintenance, and repair occupations (%)
Most Common Occupations - Production, transportation, and material moving occupations (%)
Most Common Occupations - Production occupations (%)
Most Common Occupations - Transportation occupations (%)
Most Common Occupations - Material moving occupations (%)
People in Group quarters - Institutionalized population (%)
People in Group quarters - Correctional institutions (%)
People in Group quarters - Federal prisons and detention centers (%)
People in Group quarters - Halfway houses (%)
People in Group quarters - Local jails and other confinement facilities (including police lockups) (%)
People in Group quarters - Military disciplinary barracks (%)
People in Group quarters - State prisons (%)
People in Group quarters - Other types of correctional institutions (%)
People in Group quarters - Nursing homes (%)
People in Group quarters - Hospitals/wards, hospices, and schools for the handicapped (%)
People in Group quarters - Hospitals/wards and hospices for chronically ill (%)
People in Group quarters - Hospices or homes for chronically ill (%)
People in Group quarters - Military hospitals or wards for chronically ill (%)
People in Group quarters - Other hospitals or wards for chronically ill (%)
People in Group quarters - Hospitals or wards for drug/alcohol abuse (%)
People in Group quarters - Mental (Psychiatric) hospitals or wards (%)
People in Group quarters - Schools, hospitals, or wards for the mentally retarded (%)
People in Group quarters - Schools, hospitals, or wards for the physically handicapped (%)
People in Group quarters - Institutions for the deaf (%)
People in Group quarters - Institutions for the blind (%)
People in Group quarters - Orthopedic wards and institutions for the physically handicapped (%)
People in Group quarters - Wards in general hospitals for patients who have no usual home elsewhere (%)
People in Group quarters - Wards in military hospitals for patients who have no usual home elsewhere (%)
People in Group quarters - Juvenile institutions (%)
People in Group quarters - Long-term care (%)
People in Group quarters - Homes for abused, dependent, and neglected children (%)
People in Group quarters - Residential treatment centers for emotionally disturbed children (%)
People in Group quarters - Training schools for juvenile delinquents (%)
People in Group quarters - Short-term care, detention or diagnostic centers for delinquent children (%)
People in Group quarters - Type of juvenile institution unknown (%)
People in Group quarters - Noninstitutionalized population (%)
People in Group quarters - College dormitories (includes college quarters off campus) (%)
People in Group quarters - Military quarters (%)
People in Group quarters - On base (%)
People in Group quarters - Barracks, unaccompanied personnel housing (UPH), (Enlisted/Officer), ;and similar group living quarters for military personnel (%)
People in Group quarters - Transient quarters for temporary residents (%)
People in Group quarters - Military ships (%)
People in Group quarters - Group homes (%)
People in Group quarters - Homes or halfway houses for drug/alcohol abuse (%)
People in Group quarters - Homes for the mentally ill (%)
People in Group quarters - Homes for the mentally retarded (%)
People in Group quarters - Homes for the physically handicapped (%)
People in Group quarters - Other group homes (%)
People in Group quarters - Religious group quarters (%)
People in Group quarters - Dormitories (%)
People in Group quarters - Agriculture workers' dormitories on farms (%)
People in Group quarters - Job Corps and vocational training facilities (%)
People in Group quarters - Other workers' dormitories (%)
People in Group quarters - Crews of maritime vessels (%)
People in Group quarters - Other nonhousehold living situations (%)
People in Group quarters - Other noninstitutional group quarters (%)
Residents speaking English at home (%)
Residents speaking English at home - Born in the United States (%)
Residents speaking English at home - Native, born elsewhere (%)
Residents speaking English at home - Foreign born (%)
Residents speaking Spanish at home (%)
Residents speaking Spanish at home - Born in the United States (%)
Residents speaking Spanish at home - Native, born elsewhere (%)
Residents speaking Spanish at home - Foreign born (%)
Residents speaking other language at home (%)
Residents speaking other language at home - Born in the United States (%)
Residents speaking other language at home - Native, born elsewhere (%)
Residents speaking other language at home - Foreign born (%)
Class of Workers - Employee of private company (%)
Class of Workers - Self-employed in own incorporated business (%)
Class of Workers - Private not-for-profit wage and salary workers (%)
Class of Workers - Local government workers (%)
Class of Workers - State government workers (%)
Class of Workers - Federal government workers (%)
Class of Workers - Self-employed workers in own not incorporated business and Unpaid family workers (%)
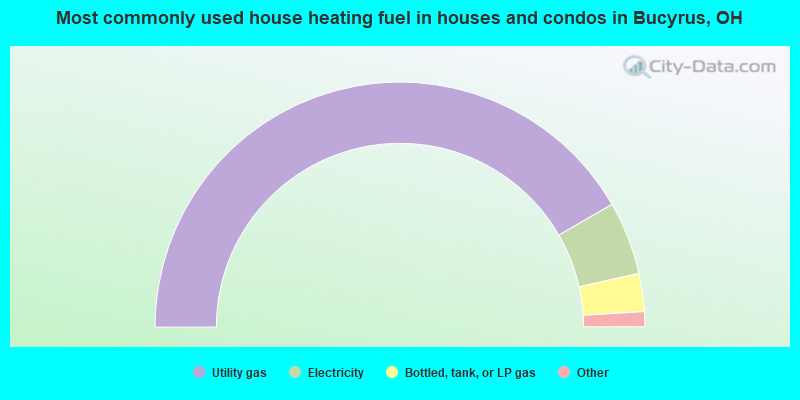
House heating fuel used in houses and condos - Utility gas (%)
House heating fuel used in houses and condos - Bottled, tank, or LP gas (%)
House heating fuel used in houses and condos - Electricity (%)
House heating fuel used in houses and condos - Fuel oil, kerosene, etc. (%)
House heating fuel used in houses and condos - Coal or coke (%)
House heating fuel used in houses and condos - Wood (%)
House heating fuel used in houses and condos - Solar energy (%)
House heating fuel used in houses and condos - Other fuel (%)
House heating fuel used in houses and condos - No fuel used (%)
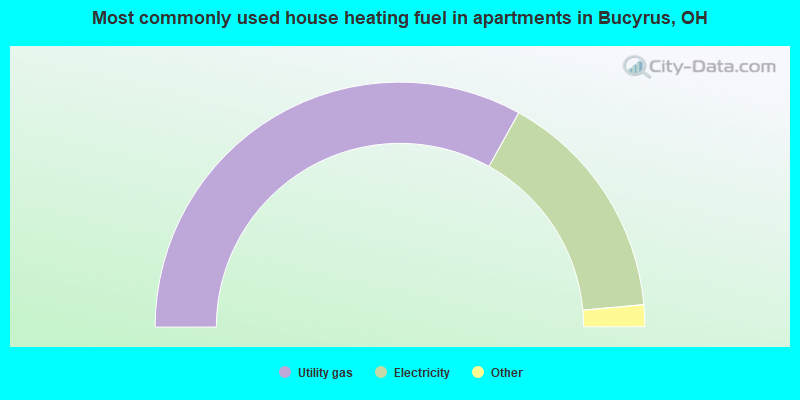
House heating fuel used in apartments - Utility gas (%)
House heating fuel used in apartments - Bottled, tank, or LP gas (%)
House heating fuel used in apartments - Electricity (%)
House heating fuel used in apartments - Fuel oil, kerosene, etc. (%)
House heating fuel used in apartments - Coal or coke (%)
House heating fuel used in apartments - Wood (%)
House heating fuel used in apartments - Solar energy (%)
House heating fuel used in apartments - Other fuel (%)
House heating fuel used in apartments - No fuel used (%)
Armed forces status - In Armed Forces (%)
Armed forces status - Civilian (%)
Armed forces status - Civilian - Veteran (%)
Armed forces status - Civilian - Nonveteran (%)
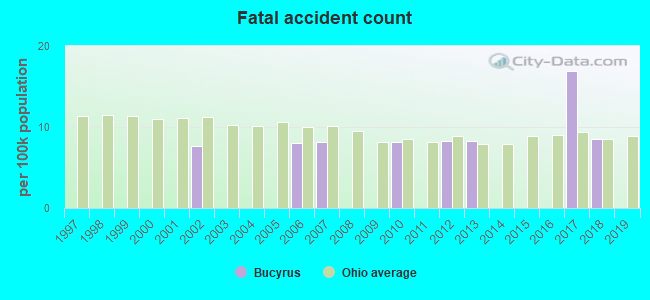
Fatal accidents locations in years 2005-2021
Fatal accidents locations in 2005
Fatal accidents locations in 2006
Fatal accidents locations in 2007
Fatal accidents locations in 2008
Fatal accidents locations in 2009
Fatal accidents locations in 2010
Fatal accidents locations in 2011
Fatal accidents locations in 2012
Fatal accidents locations in 2013
Fatal accidents locations in 2014
Fatal accidents locations in 2015
Fatal accidents locations in 2016
Fatal accidents locations in 2017
Fatal accidents locations in 2018
Fatal accidents locations in 2019
Fatal accidents locations in 2020
Fatal accidents locations in 2021
Alcohol use - People drinking some alcohol every month (%)
Alcohol use - People not drinking at all (%)
Alcohol use - Average days/month drinking alcohol
Alcohol use - Average drinks/week
Alcohol use - Average days/year people drink much
Audiometry - Average condition of hearing (%)
Audiometry - People that can hear a whisper from across a quiet room (%)
Audiometry - People that can hear normal voice from across a quiet room (%)
Audiometry - Ears ringing, roaring, buzzing (%)
Audiometry - Had a job exposure to loud noise (%)
Audiometry - Had off-work exposure to loud noise (%)
Blood Pressure & Cholesterol - Has high blood pressure (%)
Blood Pressure & Cholesterol - Checking blood pressure at home (%)
Blood Pressure & Cholesterol - Frequently checking blood cholesterol (%)
Blood Pressure & Cholesterol - Has high cholesterol level (%)
Consumer Behavior - Money monthly spent on food at supermarket/grocery store
Consumer Behavior - Money monthly spent on food at other stores
Consumer Behavior - Money monthly spent on eating out
Consumer Behavior - Money monthly spent on carryout/delivered foods
Consumer Behavior - Income spent on food at supermarket/grocery store (%)
Consumer Behavior - Income spent on food at other stores (%)
Consumer Behavior - Income spent on eating out (%)
Consumer Behavior - Income spent on carryout/delivered foods (%)
Current Health Status - General health condition (%)
Current Health Status - Blood donors (%)
Current Health Status - Has blood ever tested for HIV virus (%)
Current Health Status - Left-handed people (%)
Dermatology - People using sunscreen (%)
Diabetes - Diabetics (%)
Diabetes - Had a blood test for high blood sugar (%)
Diabetes - People taking insulin (%)
Diet Behavior & Nutrition - Diet health (%)
Diet Behavior & Nutrition - Milk product consumption (# of products/month)
Diet Behavior & Nutrition - Meals not home prepared (#/week)
Diet Behavior & Nutrition - Meals from fast food or pizza place (#/week)
Diet Behavior & Nutrition - Ready-to-eat foods (#/month)
Diet Behavior & Nutrition - Frozen meals/pizza (#/month)
Drug Use - People that ever used marijuana or hashish (%)
Drug Use - Ever used hard drugs (%)
Drug Use - Ever used any form of cocaine (%)
Drug Use - Ever used heroin (%)
Drug Use - Ever used methamphetamine (%)
Health Insurance - People covered by health insurance (%)
Kidney Conditions-Urology - Avg. # of times urinating at night
Medical Conditions - People with asthma (%)
Medical Conditions - People with anemia (%)
Medical Conditions - People with psoriasis (%)
Medical Conditions - People with overweight (%)
Medical Conditions - Elderly people having difficulties in thinking or remembering (%)
Medical Conditions - People who ever received blood transfusion (%)
Medical Conditions - People having trouble seeing even with glass/contacts (%)
Medical Conditions - People with arthritis (%)
Medical Conditions - People with gout (%)
Medical Conditions - People with congestive heart failure (%)
Medical Conditions - People with coronary heart disease (%)
Medical Conditions - People with angina pectoris (%)
Medical Conditions - People who ever had heart attack (%)
Medical Conditions - People who ever had stroke (%)
Medical Conditions - People with emphysema (%)
Medical Conditions - People with thyroid problem (%)
Medical Conditions - People with chronic bronchitis (%)
Medical Conditions - People with any liver condition (%)
Medical Conditions - People who ever had cancer or malignancy (%)
Mental Health - People who have little interest in doing things (%)
Mental Health - People feeling down, depressed, or hopeless (%)
Mental Health - People who have trouble sleeping or sleeping too much (%)
Mental Health - People feeling tired or having little energy (%)
Mental Health - People with poor appetite or overeating (%)
Mental Health - People feeling bad about themself (%)
Mental Health - People who have trouble concentrating on things (%)
Mental Health - People moving or speaking slowly or too fast (%)
Mental Health - People having thoughts they would be better off dead (%)
Oral Health - Average years since last visit a dentist
Oral Health - People embarrassed because of mouth (%)
Oral Health - People with gum disease (%)
Oral Health - General health of teeth and gums (%)
Oral Health - Average days a week using dental floss/device
Oral Health - Average days a week using mouthwash for dental problem
Oral Health - Average number of teeth
Pesticide Use - Households using pesticides to control insects (%)
Pesticide Use - Households using pesticides to kill weeds (%)
Physical Activity - People doing vigorous-intensity work activities (%)
Physical Activity - People doing moderate-intensity work activities (%)
Physical Activity - People walking or bicycling (%)
Physical Activity - People doing vigorous-intensity recreational activities (%)
Physical Activity - People doing moderate-intensity recreational activities (%)
Physical Activity - Average hours a day doing sedentary activities
Physical Activity - Average hours a day watching TV or videos
Physical Activity - Average hours a day using computer
Physical Functioning - People having limitations keeping them from working (%)
Physical Functioning - People limited in amount of work they can do (%)
Physical Functioning - People that need special equipment to walk (%)
Physical Functioning - People experiencing confusion/memory problems (%)
Physical Functioning - People requiring special healthcare equipment (%)
Prescription Medications - Average number of prescription medicines taking
Preventive Aspirin Use - Adults 40+ taking low-dose aspirin (%)
Reproductive Health - Vaginal deliveries (%)
Reproductive Health - Cesarean deliveries (%)
Reproductive Health - Deliveries resulted in a live birth (%)
Reproductive Health - Pregnancies resulted in a delivery (%)
Reproductive Health - Women breastfeeding newborns (%)
Reproductive Health - Women that had a hysterectomy (%)
Reproductive Health - Women that had both ovaries removed (%)
Reproductive Health - Women that have ever taken birth control pills (%)
Reproductive Health - Women taking birth control pills (%)
Reproductive Health - Women that have ever used Depo-Provera or injectables (%)
Reproductive Health - Women that have ever used female hormones (%)
Sexual Behavior - People 18+ that ever had sex (vaginal, anal, or oral) (%)
Sexual Behavior - Males 18+ that ever had vaginal sex with a woman (%)
Sexual Behavior - Males 18+ that ever performed oral sex on a woman (%)
Sexual Behavior - Males 18+ that ever had anal sex with a woman (%)
Sexual Behavior - Males 18+ that ever had any sex with a man (%)
Sexual Behavior - Females 18+ that ever had vaginal sex with a man (%)
Sexual Behavior - Females 18+ that ever performed oral sex on a man (%)
Sexual Behavior - Females 18+ that ever had anal sex with a man (%)
Sexual Behavior - Females 18+ that ever had any kind of sex with a woman (%)
Sexual Behavior - Average age people first had sex
Sexual Behavior - Average number of female sex partners in lifetime (males 18+)
Sexual Behavior - Average number of female vaginal sex partners in lifetime (males 18+)
Sexual Behavior - Average age people first performed oral sex on a woman (18+)
Sexual Behavior - Average number of woman performed oral sex on in lifetime (18+)
Sexual Behavior - Average number of male sex partners in lifetime (males 18+)
Sexual Behavior - Average number of male anal sex partners in lifetime (males 18+)
Sexual Behavior - Average age people first performed oral sex on a man (18+)
Sexual Behavior - Average number of male oral sex partners in lifetime (18+)
Sexual Behavior - People using protection when performing oral sex (%)
Sexual Behavior - Average number of times people have vaginal or anal sex a year
Sexual Behavior - People having sex without condom (%)
Sexual Behavior - Average number of male sex partners in lifetime (females 18+)
Sexual Behavior - Average number of male vaginal sex partners in lifetime (females 18+)
Sexual Behavior - Average number of female sex partners in lifetime (females 18+)
Sexual Behavior - Circumcised males 18+ (%)
Sleep Disorders - Average hours sleeping at night
Sleep Disorders - People that has trouble sleeping (%)
Smoking-Cigarette Use - People smoking cigarettes (%)
Taste & Smell - People 40+ having problems with smell (%)
Taste & Smell - People 40+ having problems with taste (%)
Taste & Smell - People 40+ that ever had wisdom teeth removed (%)
Taste & Smell - People 40+ that ever had tonsils teeth removed (%)
Taste & Smell - People 40+ that ever had a loss of consciousness because of a head injury (%)
Taste & Smell - People 40+ that ever had a broken nose or other serious injury to face or skull (%)
Taste & Smell - People 40+ that ever had two or more sinus infections (%)
Weight - Average height (inches)
Weight - Average weight (pounds)
Weight - Average BMI
Weight - People that are obese (%)
Weight - People that ever were obese (%)
Weight - People trying to lose weight (%)
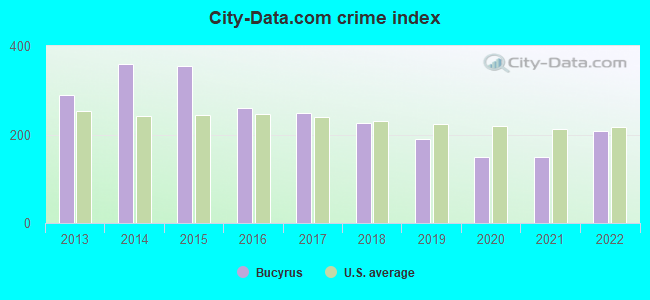
Officers per 1,000 residents here:
1.77Ohio average:
2.00
Latest news from Bucyrus, OH collected exclusively by city-data.com from local newspapers, TV, and radio stations
Ancestries: German (30.4%), American (15.5%), Irish (11.5%), English (6.9%), Scottish (1.7%), European (1.4%).
Current Local Time:
Land area: 7.30 square miles.
Population density: 1,581 people per square mile (low).
270 residents are foreign born (1.7% Asia , 0.4% Latin America ).
Median real estate property taxes paid for housing units with mortgages in 2022: $1,395 (1.0%)Median real estate property taxes paid for housing units with no mortgage in 2022: $1,352 (1.3%)
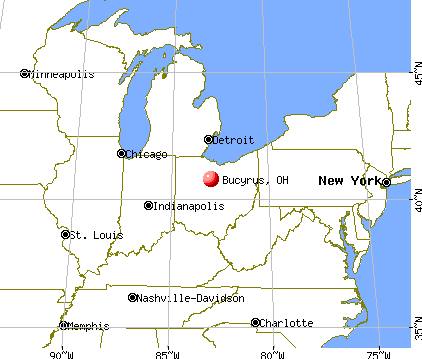
Nearest city with pop. 50,000+: Columbus, OH
Nearest city with pop. 1,000,000+: Chicago, IL
Nearest cities:
Oceola, OH (2.6 miles),
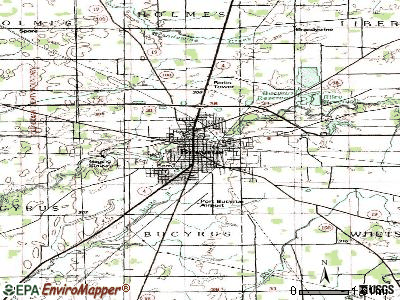
Latitude: 40.81 N, Longitude: 82.97 W
Nickname or alias (official or unofficial): Bratwurst Capital of the World
Daytime population change due to commuting: +573 (+4.9%)Workers who live and work in this city: 2,329 (46.2%)
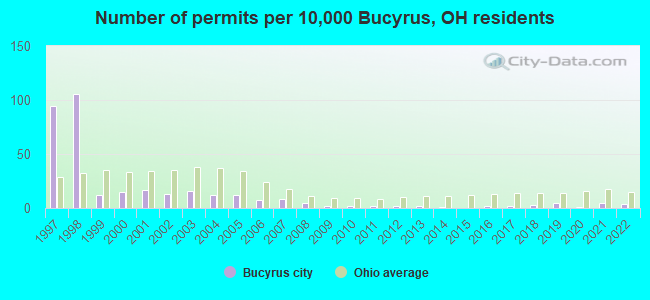
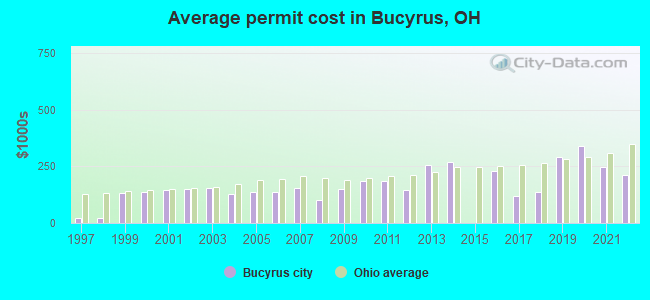
Single-family new house construction building permits:
2022: 5 buildings , average cost: $210,8002021: 7 buildings , average cost: $246,4002020: 1 building , cost: $340,0002019: 6 buildings , average cost: $291,0002018: 4 buildings , average cost: $135,0002017: 2 buildings , average cost: $120,0002016: 2 buildings , average cost: $230,0002014: 1 building , cost: $270,0002013: 2 buildings , average cost: $255,0002012: 2 buildings , average cost: $145,0002011: 2 buildings , average cost: $183,5002010: 2 buildings , average cost: $183,5002009: 3 buildings , average cost: $148,7002008: 6 buildings , average cost: $103,2002007: 11 buildings , average cost: $152,8002006: 9 buildings , average cost: $136,7002005: 16 buildings , average cost: $138,1002004: 16 buildings , average cost: $129,6002003: 21 buildings , average cost: $155,6002002: 17 buildings , average cost: $151,5002001: 23 buildings , average cost: $145,9002000: 20 buildings , average cost: $137,8001999: 16 buildings , average cost: $131,5001998: 140 buildings , average cost: $22,7001997: 124 buildings , average cost: $22,700Unemployment in December 2023:
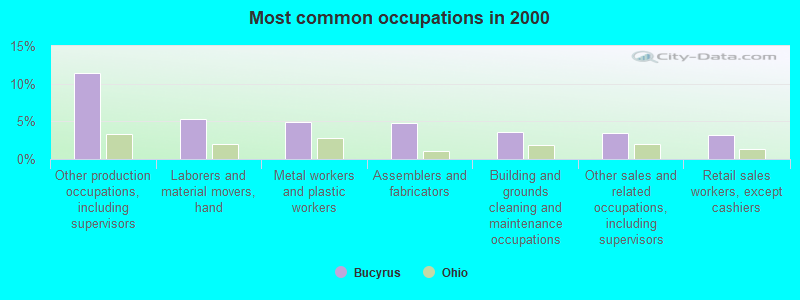
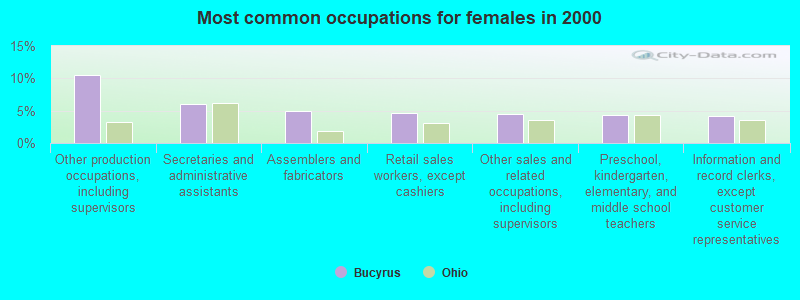
Most common occupations in Bucyrus, OH (%)
Both Males Females
Other production occupations, including supervisors (11.4%)
Laborers and material movers, hand (5.4%)
Metal workers and plastic workers (4.9%)
Assemblers and fabricators (4.8%)
Building and grounds cleaning and maintenance occupations (3.5%)
Other sales and related occupations, including supervisors (3.5%)
Retail sales workers, except cashiers (3.1%)
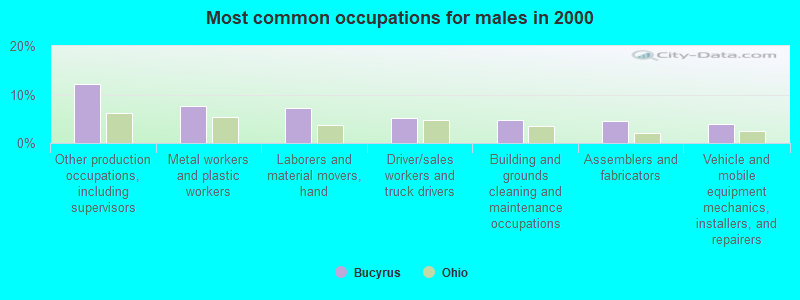
Other production occupations, including supervisors (12.2%)
Metal workers and plastic workers (7.6%)
Laborers and material movers, hand (7.3%)
Driver/sales workers and truck drivers (5.2%)
Building and grounds cleaning and maintenance occupations (4.7%)
Assemblers and fabricators (4.6%)
Vehicle and mobile equipment mechanics, installers, and repairers (3.8%)
Other production occupations, including supervisors (10.6%)
Secretaries and administrative assistants (6.0%)
Assemblers and fabricators (4.9%)
Retail sales workers, except cashiers (4.6%)
Other sales and related occupations, including supervisors (4.4%)
Preschool, kindergarten, elementary, and middle school teachers (4.4%)
Information and record clerks, except customer service representatives (4.2%)
Tornado activity:
Bucyrus-area historical tornado activity is near Ohio state average. It is 31% greater than the overall U.S. average.
On 4/11/1965, a category F4 (max. wind speeds 207-260 mph) tornado 34.3 miles away from the Bucyrus city center killed 13 people and injured 104 people and caused between $500,000 and $5,000,000 in damages.
On 6/2/1971, a category F3 (max. wind speeds 158-206 mph) tornado 18.8 miles away from the city center caused between $500,000 and $5,000,000 in damages.
Earthquake activity:
Bucyrus-area historical earthquake activity is significantly above Ohio state average. It is 29% smaller than the overall U.S. average. On 9/25/1998 at 19:52:52, a magnitude 5.2 (4.8 MB, 4.3 MS, 5.2 LG, 4.5 MW, Depth: 3.1 mi, Class: Moderate, Intensity: VI - VII) earthquake occurred 142.3 miles away from Bucyrus center On 1/31/1986 at 16:46:43, a magnitude 5.0 (5.0 MB) earthquake occurred 109.2 miles away from the city center On 7/27/1980 at 18:52:21, a magnitude 5.2 (5.1 MB, 4.7 MS, 5.0 UK, 5.2 UK) earthquake occurred 187.2 miles away from Bucyrus center On 7/12/1986 at 08:19:37, a magnitude 4.5 (4.5 MB, Class: Light, Intensity: IV - V) earthquake occurred 75.7 miles away from Bucyrus center On 8/23/2011 at 17:51:04, a magnitude 5.8 (5.8 MW, Depth: 3.7 mi) earthquake occurred 335.6 miles away from the city center On 4/18/2008 at 09:36:59, a magnitude 5.4 (5.1 MB, 4.8 MS, 5.4 MW, 5.2 MW) earthquake occurred 308.2 miles away from Bucyrus center Magnitude types: regional Lg-wave magnitude (LG), body-wave magnitude (MB), surface-wave magnitude (MS), moment magnitude (MW) Natural disasters: The number of natural disasters in Crawford County (11) is smaller than the US average (15).Major Disasters (Presidential) Declared: 5Emergencies Declared: 5Floods: 5, Storms: 4, Snows: 2, Snowstorms: 2, Blizzard: 1, Hurricane: 1, Mudslide: 1, Tornado: 1, Winter Storm: 1, Other: 1 (Note: some incidents may be assigned to more than one category). Hospitals and medical centers in Bucyrus: BUCYRUS COMMUNITY HOSPITAL (Voluntary non-profit - Other, provides emergency services, 629 NORTH SANDUSKY AVENUE) ALTERCARE OF BUCYRUS CENTER FO (1929 WHETSTONE STREET)
HEARTLAND OF BUCYRUS (1170 W MANSFIELD STREET)
FMC - CRAWFORD COUNTY KIDNEY CENTER (701 TIFFIN STREET)
Colleges/universities with over 2000 students nearest to Bucyrus:
Tiffin University (about 25 miles; Tiffin, OH ; Full-time enrollment: 4,927)
Ashland University (about 35 miles; Ashland, OH ; FT enrollment: 5,151)
Terra State Community College (about 40 miles; Fremont, OH ; FT enrollment: 2,119)
The University of Findlay (about 40 miles; Findlay, OH ; FT enrollment: 3,649)
Ohio Northern University (about 45 miles; Ada, OH ; FT enrollment: 2,474)
Otterbein University (about 48 miles; Westerville, OH ; FT enrollment: 2,933)
Oberlin College (about 52 miles; Oberlin, OH ; FT enrollment: 2,795)
Public high schools in Bucyrus:
Private high school in Bucyrus: WAYSIDE CHRISTIAN SCHOOL Students: 82, Location: 2345 KERSTETTER RD, Grades: KG-12)
Public elementary/middle schools in Bucyrus:
Private elementary/middle school in Bucyrus: HOLY TRINITY SCHOOL Students: 67, Location: 740 TIFFIN ST, Grades: PK-8)
See full list of schools located in Bucyrus Library in Bucyrus: BUCYRUS PUBLIC LIBRARY Operating income: $731,157; Location: 200 E. MANSFIELD; 54,472 books ; 1,008 audio materials ; 2,874 video materials ; 6 local licensed databases ; 266 state licensed databases ; 242 print serial subscriptions ; 6 electronic serial subscriptions )
Notable locations in Bucyrus: (A) , Crawford County Fairgrounds (B) , Bucyrus Water Treatment Plant (C) , Lifestar Emergency Medical Services (D) , Medcorp Emergency Medical Services (E) , Bucyrus Fire Department (F) , Crawford County Jail (G) , Crawford County Courthouse (H) , Bucyrus Public Library (I) . Display/hide their locations on the map
Shopping Center: (1) . Display/hide its location on the map
Churches in Bucyrus include: (A) , Second Baptist Church (B) , First United Brethren Church (C) , First Freewill Baptist Church (D) , First Church of Christ Scientist (E) , Church of the Nazarene (F) , Church of Christ (G) , Assembly of God Church (H) , Bucyrus Evangelistic Center (I) . Display/hide their locations on the map
Cemeteries: (1) , Holy Trinity Cemetery (2) , Tiffin Road Cemetery (3) . Display/hide their locations on the map
Parks in Bucyrus include: (1) , Washington Square (2) , Harmon Field (3) , Bucyrus Commercial Historical District (4) . Display/hide their locations on the map
Tourist attraction:
Hotels:
Birthplace of: Harry L. Martin - Marine Corps Medal of Honor recipient, Mary Lucier - Contemporary artist, Cecil Souders - Football player, Fred Trautman - Baseball player, Gloria LeRoy - Actor, L. L. Marshall - Politician, Bob Monnett - Football player.
Crawford County has a predicted average indoor radon screening level greater than 4 pCi/L (pico curies per liter) - Highest Potential Drinking water stations with addresses in Bucyrus and their reported violations in the past:
BUCYRUS CITY (Population served: 12,362, Surface water):
Past monitoring violations:
Monitoring, Turbidity (Enhanced SWTR) - In FEB-2009, Contaminant: IESWTR. Follow-up actions: St Public Notif requested (FEB-20-2009), St Violation/Reminder Notice (FEB-20-2009), St Compliance achieved (MAR-31-2009), St Public Notif received (APR-15-2009)
Population served: 1,034, Purch surface water):
Past monitoring violations:
One routine major monitoring violation
Population served: 120, Groundwater):
Past health violations:
MCL, Monthly (TCR) - Between APR-2010 and JUN-2010, Contaminant: Coliform. Follow-up actions: St Public Notif requested (APR-23-2010), St Violation/Reminder Notice (APR-23-2010), St Public Notif received (APR-30-2010), St Compliance achieved (OCT-04-2010)
Population served: 75, Groundwater):
Past monitoring violations:
2 routine major monitoring violations
One regular monitoring violation
Drinking water stations with addresses in Bucyrus that have no violations reported:
SUNSET SPRINGS CAMPGROUND-N WELL (Population served: 73, Primary Water Source Type: Groundwater)
Average household size: This city:
2.3 peopleOhio:
2.4 people
Percentage of family households: This city:
60.5%Whole state:
65.0%
Percentage of households with unmarried partners: This city:
8.0%Whole state:
6.8%
Likely homosexual households (counted as self-reported same-sex unmarried-partner households)
Lesbian couples: 0.2% of all households Gay men: 0.2% of all households
People in group quarters in Bucyrus in 2010:
169 people in nursing facilities/skilled-nursing facilities
115 people in local jails and other municipal confinement facilities
33 people in other noninstitutional facilities
12 people in group homes intended for adults
10 people in emergency and transitional shelters (with sleeping facilities) for people experiencing homelessness
People in group quarters in Bucyrus in 2000:
178 people in nursing homes
44 people in homes for the physically handicapped
28 people in other noninstitutional group quarters
8 people in homes for the mentally retarded
4 people in other group homes
Banks with branches in Bucyrus (2011 data):
First Federal Community Bank of Bucyrus: 875 S Sandusky Ave Branch, 2020 E. Mansfied St., First Federal Community Bank Of Bucy. Info updated 2011/07/21: Bank assets: $128.8 mil, Deposits: $102.5 mil, local headquarters , positive income , Mortgage Lending Specialization, 5 total offices
Peoples Savings and Loan Company: 1530 North Sandusky Avenue at 1530 North Sandusky Avenue, branch established on 2005/06/30; Peoples Savings And Loan Company at 300 South Walnut Street, branch established on 1888/01/01. Info updated 2011/07/21: Bank assets: $140.7 mil, Deposits: $117.5 mil, local headquarters , positive income , 2 total offices
The Farmers Citizens Bank: at 105 Washington Square, branch established on 1908/01/06; South Branch at 1605 Marion Road, branch established on 1990/09/17. Info updated 2010/06/11: Bank assets: $356.8 mil, Deposits: $312.8 mil, local headquarters , positive income , Commercial Lending Specialization, 7 total offices , Holding Company: Fc Banc Corp
Firstmerit Bank, National Association: Bucyrus Branch at 101 South Sandusky Avenue, branch established on 1877/01/01. Info updated 2010/05/17: Bank assets: $14,420.6 mil, Deposits: $11,497.6 mil, headquarters in Akron, OH, positive income , Commercial Lending Specialization, 213 total offices , Holding Company: Firstmerit Corporation
The Park National Bank: 1804 United Bank Na Branch at 401 South Sandusky Avenue, branch established on 1859/07/30. Info updated 2008/09/29: Bank assets: $6,281.7 mil, Deposits: $4,611.6 mil, headquarters in Newark, OH, positive income , Commercial Lending Specialization, 123 total offices , Holding Company: Park National Corporation
For population 15 years and over in Bucyrus:
Never married: 26.5%Now married: 44.9%Separated: 1.7%Widowed: 8.5%Divorced: 18.4% For population 25 years and over in Bucyrus:
High school or higher: 87.2%Bachelor's degree or higher: 10.0%Graduate or professional degree: 3.2%Unemployed: 6.8%Mean travel time to work (commute): 18.7 minutes
Education Gini index (Inequality in education) Here:
8.1Ohio average:
11.0
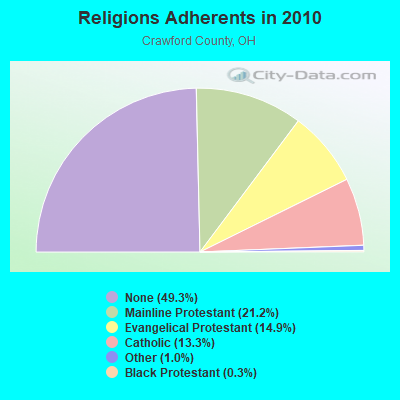
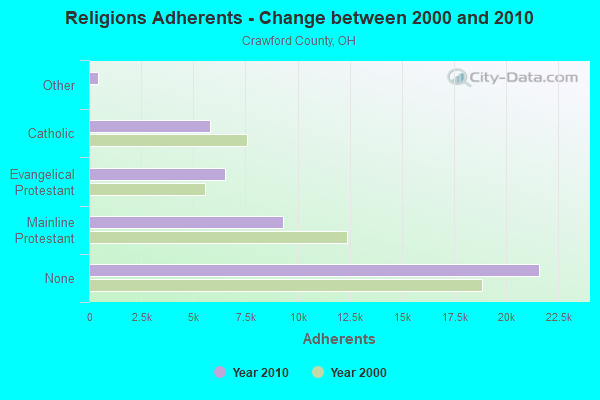
Religion statistics for Bucyrus, OH (based on Crawford County data)
Religion Adherents Congregations Mainline Protestant 9,303 34 Evangelical Protestant 6,514 54 Catholic 5,812 4 Other 442 3 Black Protestant 121 1 Orthodox 3 1 None 21,589 -
Source: Clifford Grammich, Kirk Hadaway, Richard Houseal, Dale E.Jones, Alexei Krindatch, Richie Stanley and Richard H.Taylor. 2012. 2010 U.S.Religion Census: Religious Congregations & Membership Study. Association of Statisticians of American Religious Bodies. Jones, Dale E., et al. 2002. Congregations and Membership in the United States 2000. Nashville, TN: Glenmary Research Center. Graphs represent county-level data
Food Environment Statistics: Number of grocery stores : 6This county :
1.36 / 10,000 pop.Ohio :
1.89 / 10,000 pop.
Number of supercenters and club stores : 1Crawford County :
0.23 / 10,000 pop.Ohio :
0.13 / 10,000 pop.
Number of convenience stores (no gas) : 3Crawford County :
0.68 / 10,000 pop.Ohio :
1.25 / 10,000 pop.
Number of convenience stores (with gas) : 19Crawford County :
4.31 / 10,000 pop.Ohio :
2.93 / 10,000 pop.
Number of full-service restaurants : 21Crawford County :
4.76 / 10,000 pop.State :
6.25 / 10,000 pop.
Adult diabetes rate : This county :
11.1%Ohio :
10.3%
Adult obesity rate : This county :
29.2%State :
29.1%
Low-income preschool obesity rate : This county :
14.6%Ohio :
11.9%
Health and Nutrition:
Average overall health of teeth and gums : People feeling badly about themselves : People not drinking alcohol at all : Average hours sleeping at night : Overweight people : This city:
35.9%Ohio:
34.3%
General health condition : Average condition of hearing : More about Health and Nutrition of Bucyrus, OH Residents
Local government employment and payroll (March 2022)
Function
Full-time employees
Monthly full-time payroll
Average yearly full-time wage
Part-time employees
Monthly part-time payroll
Police Protection - Officers
19 $99,297 $62,714 0 $0 Firefighters
19 $127,512 $80,534 0 $0 Water Supply
11 $56,480 $61,615 0 $0 Streets and Highways
8 $35,942 $53,913 0 $0 Sewerage
7 $31,751 $54,430 0 $0 Solid Waste Management
6 $24,641 $49,282 0 $0 Other Government Administration
6 $27,265 $54,530 13 $12,954 Police - Other
6 $21,833 $43,666 0 $0 Financial Administration
5 $21,275 $51,060 1 $683 Judicial and Legal
3 $15,504 $62,016 0 $0 Other and Unallocable
2 $7,354 $44,124 0 $0 Parks and Recreation
1 $3,986 $47,832 0 $0
Totals for Government
93 $472,839 $61,011 14 $13,636
Bucyrus government finances - Expenditure in 2017 (per resident):
Current Operations - Police Protection: $1,970,000 ($170.74)
Water Utilities: $1,759,000 ($152.45)Sewerage: $1,552,000 ($134.51)Local Fire Protection: $1,411,000 ($122.29)Solid Waste Management: $906,000 ($78.52)Regular Highways: $784,000 ($67.95)General - Other: $660,000 ($57.20)Housing and Community Development: $493,000 ($42.73)Air Transportation: $272,000 ($23.57)Judicial and Legal Services: $228,000 ($19.76)Financial Administration: $206,000 ($17.85)Health - Other: $193,000 ($16.73)Parks and Recreation: $166,000 ($14.39)Central Staff Services: $148,000 ($12.83)General Public Buildings: $138,000 ($11.96)Miscellaneous Commercial Activities - Other: $48,000 ($4.16)General - Interest on Debt: $314,000 ($27.21)
Intergovernmental to State - Sewerage: $1,785,000 ($154.71)
General - Other: $78,000 ($6.76)Other Capital Outlay - Regular Highways: $3,054,000 ($264.69)
Sewerage: $1,907,000 ($165.28)Solid Waste Management: $298,000 ($25.83)Water Utilities: $285,000 ($24.70)General - Other: $245,000 ($21.23)Air Transportation: $107,000 ($9.27)Police Protection: $82,000 ($7.11)Housing and Community Development: $73,000 ($6.33)Parks and Recreation: $31,000 ($2.69)General Public Building: $21,000 ($1.82)Local Fire Protection: $17,000 ($1.47)Financial Administration: $13,000 ($1.13)Judicial and Legal Services: $2,000 ($0.17)Central Staff Services: $2,000 ($0.17)Total Salaries and Wages: $5,806,000 ($503.21)
Water Utilities - Interest on Debt: $93,000 ($8.06)
Bucyrus government finances - Revenue in 2017 (per resident):
Charges - Sewerage: $2,546,000 ($220.66)
Solid Waste Management: $903,000 ($78.26)Other: $371,000 ($32.15)Parks and Recreation: $27,000 ($2.34)Regular Highways: $5,000 ($0.43)Federal Intergovernmental - Air Transportation: $177,000 ($15.34)
Miscellaneous - General Revenue - Other: $354,000 ($30.68)
Interest Earnings: $353,000 ($30.59)Fines and Forfeits: $35,000 ($3.03)Special Assessments: $13,000 ($1.13)Sale of Property: $3,000 ($0.26)Revenue - Water Utilities: $2,104,000 ($182.35)
State Intergovernmental - Other: $600,000 ($52.00)
General Local Government Support: $530,000 ($45.94)Highways: $423,000 ($36.66)Housing and Community Development: $325,000 ($28.17)Tax - Individual Income: $4,419,000 ($383.00)
Property: $741,000 ($64.22)Other License: $159,000 ($13.78)Death and Gift: $76,000 ($6.59)Motor Vehicle License: $59,000 ($5.11)Other Selective Sales: $33,000 ($2.86)
Bucyrus government finances - Cash and Securities in 2017 (per resident):
Bond Funds - Cash and Securities: $487,000 ($42.21)
Other Funds - Cash and Securities: $6,260,000 ($542.56)
Sinking Funds - Cash and Securities: $72,000 ($6.24)
Businesses in Bucyrus, OH
Name Count Name Count
Arby's 1 Little Caesars Pizza 1 AutoZone 1 Long John Silver's 1 Burger King 1 MasterBrand Cabinets 2 CVS 1 McDonald's 1 Chevrolet 1 New Balance 1 Circle K 2 Nike 2 Curves 1 Pizza Hut 1 FedEx 2 Sears 1 GNC 1 Subway 1 H&R Block 1 Taco Bell 1 Hardee's 1 True Value 1 Holiday Inn 1 U-Haul 1 Jones New York 1 UPS 2 KFC 1 Walmart 1 Knights Inn 1 Wendy's 1 Kroger 1 YMCA 1
Strongest AM radio stations in Bucyrus:
WBCO (1540 AM; daytime; 0 kW; BUCYRUS, OH; Owner: ANCHOR BROADCASTING COMPANY)
WTVN (610 AM; 50 kW; COLUMBUS, OH; Owner: CITICASTERS LICENSES, L.P.)
WKNR (850 AM; 50 kW; CLEVELAND, OH; Owner: CARON BROADCASTING, INC.)
WTAM (1100 AM; 50 kW; CLEVELAND, OH; Owner: JACOR BROADCASTING CORPORATION)
WHK (1220 AM; 50 kW; CLEVELAND, OH; Owner: CARON BROADCASTING, INC.)
WRFD (880 AM; daytime; 23 kW; COLUMBUS-WORTHINGTON, OH; Owner: SALEM MEDIA OF OHIO, INC.)
WJR (760 AM; 50 kW; DETROIT, MI; Owner: ABC, INC.)
WFDF (910 AM; 50 kW; FLINT, MI; Owner: ABC, INC.)
WDFN (1130 AM; 50 kW; DETROIT, MI; Owner: AMFM RADIO LICENSES, L.L.C.)
WCHB (1200 AM; 50 kW; TAYLOR, MI; Owner: RADIO ONE OF DETROIT, LLC)
WLW (700 AM; 50 kW; CINCINNATI, OH; Owner: JACOR BROADCASTING CORPORATION)
WWJ (950 AM; 50 kW; DETROIT, MI; Owner: INFINITY BROADCASTING OPERATIONS, INC.)
WWVA (1170 AM; 53 kW; WHEELING, WV; Owner: CAPSTAR TX LIMITED PARTNERSHIP)
Strongest FM radio stations in Bucyrus:
WQEL (92.7 FM; BUCYRUS, OH; Owner: ANCHOR BROADCASTING COMPANY)
WFXN-FM (102.3 FM; GALION, OH; Owner: CAPSTAR TX LIMITED PARTNERSHIP)
WYXZ (98.7 FM; CRESTLINE, OH; Owner: ELYRIA-LORAIN BROADCASTING COMPANY)
WVNO-FM (106.1 FM; MANSFIELD, OH; Owner: JOHNNY APPLESEED BROADCASTING CO.)
WXML (90.1 FM; UPPER SANDUSKY, OH; Owner: KAYSER B/CAST MINISTRIES, INC.)
WMRN-FM (106.9 FM; MARION, OH; Owner: CITICASTERS LICENSES, L.P.)
WYNT (95.9 FM; UPPER SANDUSKY, OH; Owner: CLEAR CHANNEL BROADCASTING LICENSES, INC.)
WVXG (95.1 FM; MOUNT GILEAD, OH; Owner: XAVIER UNIVERSITY)
WOSB (91.1 FM; MARION, OH; Owner: THE OHIO STATE UNIVERSITY)
WSWR (100.1 FM; SHELBY, OH; Owner: CAPSTAR TX LIMITED PARTNERSHIP)
WOSV (91.7 FM; MANSFIELD, OH; Owner: THE OHIO STATE UNIVERSITY)
WYHT (105.3 FM; MANSFIELD, OH; Owner: CAPSTAR TX LIMITED PARTNERSHIP)
WDIF (94.3 FM; MARION, OH; Owner: CITICASTERS LICENSES, L.P.)
WLRD (96.9 FM; WILLARD, OH; Owner: CHRISTIAN FAITH BROADCAST, INC.)
WCKY-FM (103.7 FM; TIFFIN, OH; Owner: CITICASTERS LICENSES, L.P.)
W257AB (99.3 FM; MARION, OH; Owner: GAP, INC.)
TV broadcast stations around Bucyrus:
W54AF (Channel 54; BUCYRUS, OH; Owner: CRAWFORD BROADCASTING. COMPANY, INC.)
WMFD-TV (Channel 68; MANSFIELD, OH; Owner: MID-STATE TELEVISION,INC.)
WBKA-LP (Channel 22; BUCYRUS, OH; Owner: CRAWFORD BROADCASTING CO., INC.)
WOHZ-LP (Channel 57; MANSFIELD, OH; Owner: MID-STATE TELEVISION, INC.)
WOSU-TV (Channel 34; COLUMBUS, OH; Owner: THE OHIO STATE UNIVERSITY)
WOCB-LP (Channel 39; MARION, OH; Owner: CENTRAL OHIO ASSOCIATION OF CHRISTIAN BROADCASTERS)
W32AR (Channel 32; LEXINGTON, OH; Owner: TRINITY BROADCASTING NETWORK)
Medal of Honor Recipients
Medal of Honor Recipient born in Bucyrus: Harry Linn Martin.
National Bridge Inventory (NBI) Statistics 62 Number of bridges689ft / 210m Total length $281,767,000 Total costs232,035 Total average daily traffic56,156 Total average daily truck traffic
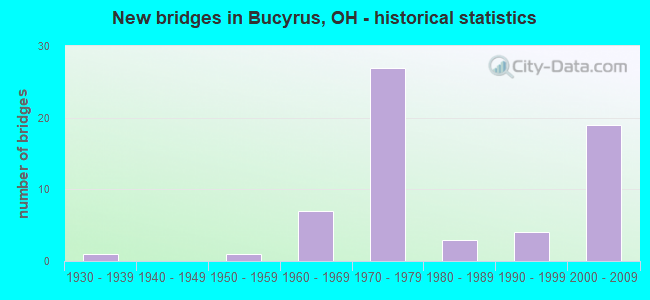
New bridges - historical statistics
1 1930-1939 1 1950-1959 7 1960-1969 27 1970-1979 3 1980-1989 4 1990-1999 19 2000-2009
See full National Bridge Inventory statistics for Bucyrus, OH
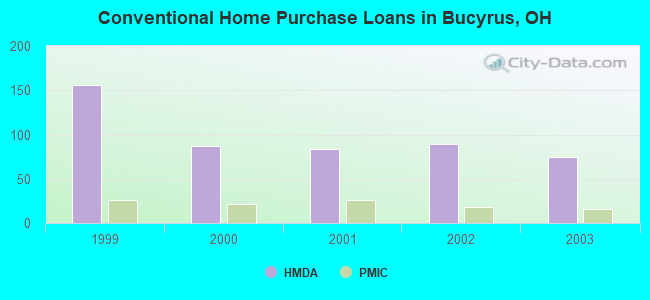
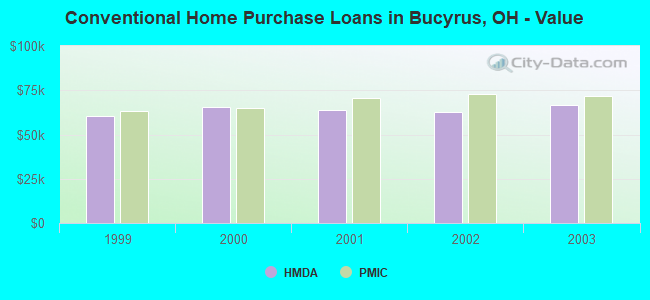
Home Mortgage Disclosure Act Aggregated Statistics For Year 2003(Based on 1 full and 3 partial tracts) A) FHA, FSA/RHS & VA B) Conventional C) Refinancings D) Home Improvement Loans E) Loans on Dwellings For 5+ Families F) Non-occupant Loans on Number Average Value Number Average Value Number Average Value Number Average Value Number Average Value Number Average Value
LOANS ORIGINATED 12 $80,962 75 $66,832 229 $67,146 41 $40,122 2 $164,000 45 $53,175 APPLICATIONS APPROVED, NOT ACCEPTED 0 $0 10 $64,714 33 $76,446 5 $34,080 0 $0 5 $70,048 APPLICATIONS DENIED 2 $64,645 14 $53,932 154 $77,160 14 $19,088 0 $0 20 $67,037 APPLICATIONS WITHDRAWN 1 $61,300 6 $47,717 58 $81,508 3 $20,970 0 $0 2 $112,000 FILES CLOSED FOR INCOMPLETENESS 0 $0 2 $104,175 10 $74,563 0 $0 0 $0 1 $40,630
Aggregated Statistics For Year 2002(Based on 1 full and 3 partial tracts) A) FHA, FSA/RHS & VA B) Conventional C) Refinancings D) Home Improvement Loans E) Loans on Dwellings For 5+ Families F) Non-occupant Loans on Number Average Value Number Average Value Number Average Value Number Average Value Number Average Value Number Average Value
LOANS ORIGINATED 15 $74,257 89 $62,699 233 $67,470 39 $30,405 1 $273,020 34 $51,657 APPLICATIONS APPROVED, NOT ACCEPTED 0 $0 5 $71,600 40 $75,644 2 $9,670 0 $0 2 $49,405 APPLICATIONS DENIED 1 $80,000 18 $59,810 120 $76,500 12 $18,553 0 $0 4 $79,062 APPLICATIONS WITHDRAWN 0 $0 2 $73,545 107 $80,586 2 $39,020 0 $0 1 $81,000 FILES CLOSED FOR INCOMPLETENESS 1 $53,400 1 $78,000 14 $85,395 1 $20,000 0 $0 0 $0
Aggregated Statistics For Year 2001(Based on 1 full and 3 partial tracts) A) FHA, FSA/RHS & VA B) Conventional C) Refinancings D) Home Improvement Loans F) Non-occupant Loans on Number Average Value Number Average Value Number Average Value Number Average Value Number Average Value
LOANS ORIGINATED 11 $78,964 84 $63,917 241 $63,588 33 $23,355 31 $69,325 APPLICATIONS APPROVED, NOT ACCEPTED 1 $98,520 8 $51,796 34 $67,044 7 $9,141 0 $0 APPLICATIONS DENIED 3 $67,523 30 $47,012 109 $63,267 23 $11,621 5 $35,422 APPLICATIONS WITHDRAWN 1 $50,800 10 $65,165 81 $65,753 2 $22,695 1 $28,000 FILES CLOSED FOR INCOMPLETENESS 0 $0 1 $37,620 12 $71,083 0 $0 0 $0
Aggregated Statistics For Year 2000(Based on 1 full and 3 partial tracts) A) FHA, FSA/RHS & VA B) Conventional C) Refinancings D) Home Improvement Loans F) Non-occupant Loans on Number Average Value Number Average Value Number Average Value Number Average Value Number Average Value
LOANS ORIGINATED 6 $68,203 87 $65,647 111 $54,951 64 $15,708 31 $56,205 APPLICATIONS APPROVED, NOT ACCEPTED 3 $66,073 7 $67,643 26 $58,695 16 $11,547 3 $27,750 APPLICATIONS DENIED 3 $58,057 39 $41,605 87 $51,900 19 $12,534 3 $14,067 APPLICATIONS WITHDRAWN 2 $33,400 11 $56,966 33 $51,936 4 $24,820 1 $70,890 FILES CLOSED FOR INCOMPLETENESS 0 $0 0 $0 3 $68,003 0 $0 0 $0
Aggregated Statistics For Year 1999(Based on 1 full and 3 partial tracts) A) FHA, FSA/RHS & VA B) Conventional C) Refinancings D) Home Improvement Loans F) Non-occupant Loans on Number Average Value Number Average Value Number Average Value Number Average Value Number Average Value
LOANS ORIGINATED 10 $67,238 156 $60,202 207 $52,417 38 $28,858 52 $61,466 APPLICATIONS APPROVED, NOT ACCEPTED 1 $97,140 13 $58,308 41 $59,489 8 $18,851 1 $58,480 APPLICATIONS DENIED 4 $48,970 35 $48,516 85 $58,890 21 $14,828 10 $52,043 APPLICATIONS WITHDRAWN 2 $66,445 7 $53,326 52 $61,163 4 $17,958 4 $66,750 FILES CLOSED FOR INCOMPLETENESS 0 $0 0 $0 7 $58,487 0 $0 0 $0
Detailed HMDA statistics for the following Tracts:
9743.00
, 9744.00 , 9745.00 , 9746.00
Private Mortgage Insurance Companies Aggregated Statistics For Year 2003(Based on 1 full and 3 partial tracts) A) Conventional B) Refinancings C) Non-occupant Loans on Number Average Value Number Average Value Number Average Value
LOANS ORIGINATED 16 $71,873 21 $89,559 0 $0 APPLICATIONS APPROVED, NOT ACCEPTED 7 $59,970 8 $121,359 0 $0 APPLICATIONS DENIED 0 $0 0 $0 0 $0 APPLICATIONS WITHDRAWN 1 $38,730 1 $127,870 1 $72,000 FILES CLOSED FOR INCOMPLETENESS 0 $0 0 $0 0 $0
Aggregated Statistics For Year 2002(Based on 1 full and 3 partial tracts) A) Conventional B) Refinancings C) Non-occupant Loans on Number Average Value Number Average Value Number Average Value
LOANS ORIGINATED 18 $72,912 18 $85,226 2 $56,330 APPLICATIONS APPROVED, NOT ACCEPTED 2 $47,145 3 $79,387 1 $65,000 APPLICATIONS DENIED 0 $0 1 $143,730 0 $0 APPLICATIONS WITHDRAWN 0 $0 3 $102,333 1 $74,000 FILES CLOSED FOR INCOMPLETENESS 0 $0 2 $76,000 1 $72,000
Aggregated Statistics For Year 2001(Based on 1 full and 3 partial tracts) A) Conventional B) Refinancings C) Non-occupant Loans on Number Average Value Number Average Value Number Average Value
LOANS ORIGINATED 26 $70,880 24 $79,140 4 $81,000 APPLICATIONS APPROVED, NOT ACCEPTED 2 $44,960 6 $79,918 0 $0 APPLICATIONS DENIED 2 $59,145 1 $37,050 1 $51,630 APPLICATIONS WITHDRAWN 0 $0 1 $144,510 0 $0 FILES CLOSED FOR INCOMPLETENESS 0 $0 0 $0 0 $0
Aggregated Statistics For Year 2000(Based on 1 full and 3 partial tracts) A) Conventional B) Refinancings C) Non-occupant Loans on Number Average Value Number Average Value Number Average Value
LOANS ORIGINATED 21 $65,245 3 $74,673 2 $43,500 APPLICATIONS APPROVED, NOT ACCEPTED 3 $71,047 2 $55,790 0 $0 APPLICATIONS DENIED 0 $0 0 $0 0 $0 APPLICATIONS WITHDRAWN 1 $59,000 0 $0 0 $0 FILES CLOSED FOR INCOMPLETENESS 0 $0 0 $0 0 $0
Aggregated Statistics For Year 1999(Based on 1 full and 3 partial tracts) A) Conventional B) Refinancings Number Average Value Number Average Value
LOANS ORIGINATED 26 $63,119 5 $65,160 APPLICATIONS APPROVED, NOT ACCEPTED 2 $54,040 0 $0 APPLICATIONS DENIED 2 $44,450 0 $0 APPLICATIONS WITHDRAWN 0 $0 0 $0 FILES CLOSED FOR INCOMPLETENESS 0 $0 0 $0
Detailed PMIC statistics for the following Tracts:
9743.00
, 9744.00 , 9745.00 , 9746.00
Most common first names in Bucyrus, OH among deceased individuals Name Count Lived (average)
Mary 183 80.8 years Robert 168 71.9 years John 132 74.3 years James 128 69.5 years William 118 73.2 years Charles 109 75.2 years Helen 97 82.3 years George 78 75.4 years Richard 75 71.9 years Ruth 73 81.6 years
Most common last names in Bucyrus, OH among deceased individuals Last name Count Lived (average)
Smith 76 76.8 years Miller 52 75.8 years Brown 51 75.9 years Wilson 40 75.5 years Myers 35 77.8 years Ulmer 29 77.7 years Campbell 28 81.3 years Clark 26 70.7 years Johnson 26 72.8 years Linn 25 76.7 years
Bucyrus compared to Ohio state average:
Median house value below state average. Unemployed percentage below state average. Black race population percentage significantly below state average. Foreign-born population percentage significantly below state average. Length of stay since moving in above state average. Number of college students below state average. Percentage of population with a bachelor's degree or higher below state average.
#55 on the list of "Top 101 cities with the largest percentage of people in homes for the physically handicapped (population 1,000+)"
#89 on the list of "Top 101 cities with the highest percentage of English-only speaking households, population 5,000+"
#4 on the list of "Top 101 counties with the lowest ground withdrawal of fresh water for public supply"
Top Patent Applicants
James J. Collene (5)
James Collene (5)
Robert R. Powers (1)
Matthew Pry (1)
David T. Delaney (1)
Total of 14 patent applications in 2008-2024.


 Recent articles from our blog. Our writers, many of them Ph.D. graduates or candidates, create easy-to-read articles on a wide variety of topics.

 (56.5 miles
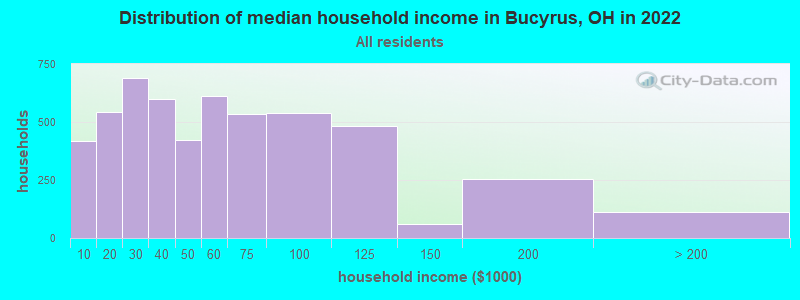


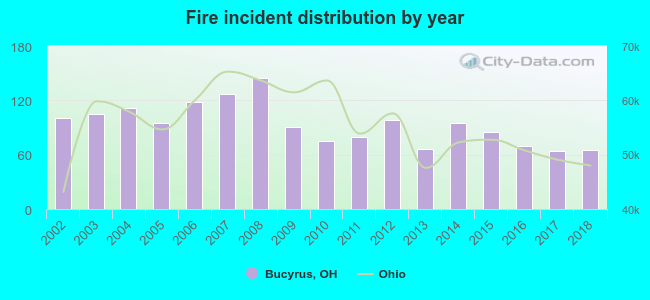 According to the data from the years 2002 - 2018 the average number of fire incidents per year is 94. The highest number of reported fire incidents - 145 took place in 2008, and the least - 64 in 2017. The data has a declining trend.
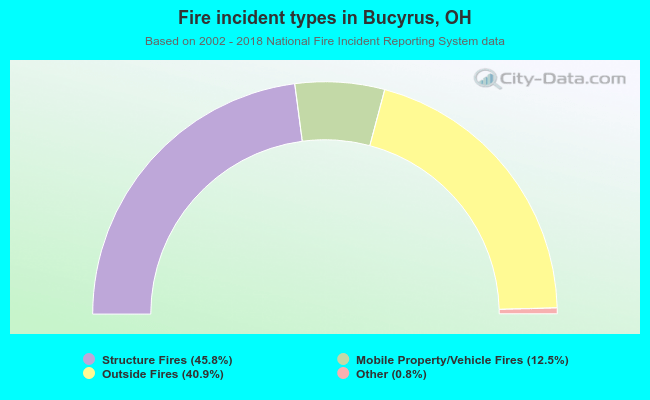 When looking into fire subcategories, the most reports belonged to: Structure Fires (45.8%), and Outside Fires (40.9%).