Estimated zip code population in 2022: 1,452 Zip code population in 2010: 1,541 Zip code population in 2000: 1,543
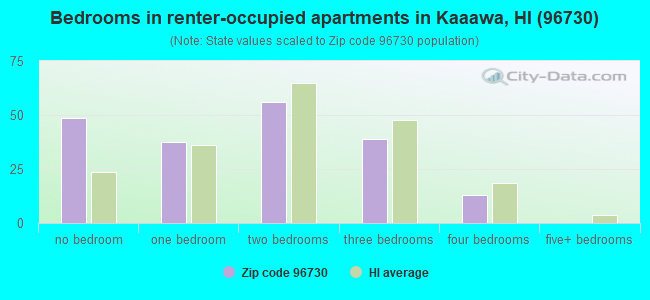
Houses and condos: 677 Renter-occupied apartments: 191
% of renters here:
35%
State:
37%
March 2022 cost of living index in zip code 96730: 132.5 (high, U.S. average is 100)
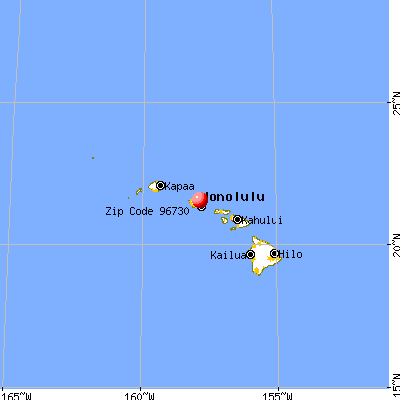
Land area: 1.1 sq. mi. Water area: 0.7 sq. mi.
Population density: 1,373 people per square mile
(low).
OSM Map
General Map
Google Map
MSN Map
OSM Map
General Map
Google Map
MSN Map
OSM Map
General Map
Google Map
MSN Map
OSM Map
General Map
Google Map
MSN Map
Please wait while loading the map...
Real estate property taxes paid for housing units in 2022:
This zip code:
0.2% ($2,376)
Hawaii:
0.3% ($2,092)
Median real estate property taxes paid for housing units with mortgages in 2022: $2,370 (0.2%) Median real estate property taxes paid for housing units with no mortgage in 2022: $2,531 (0.3%)
Business Search- 14 Million verified businesses
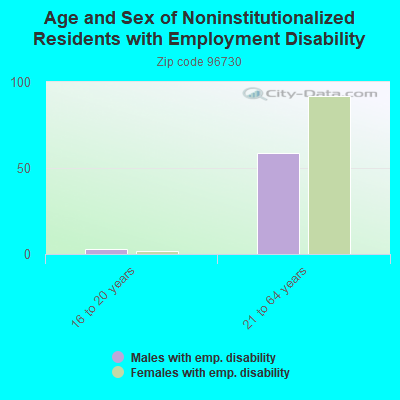
Males: 707
(48.7%)
Females: 745
(51.3%)
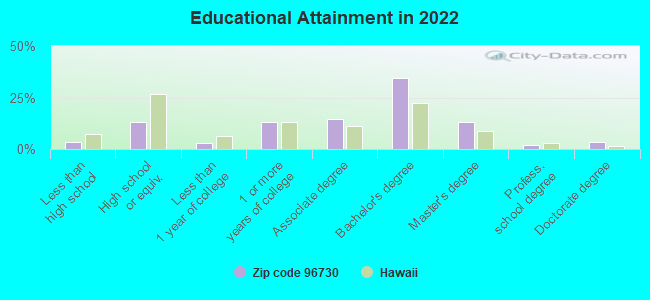
For population 25 years and over in 96730:
High school or higher: 96.4%
Bachelor's degree or higher: 52.6%
Graduate or professional degree: 18.6%
Unemployed: 3.9%
Mean travel time to work (commute): 36.6 minutes
For population 15 years and over in 96730:
Never married: 19.5%
Now married: 68.3%
Separated: 0.7%
Widowed: 4.2%
Divorced: 7.2%
Zip code 96730 compared to state average:
Black race population percentage significantly below state average.
Foreign-born population percentage significantly below state average.
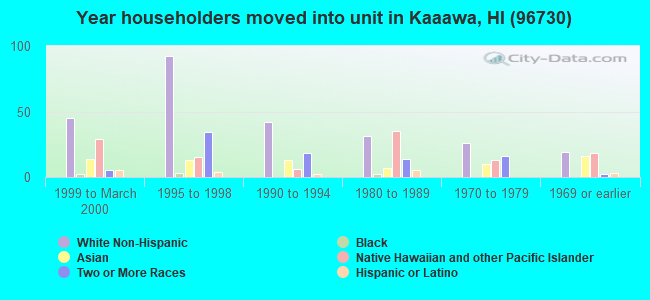
Length of stay since moving in significantly below state average.
Percentage of population with a bachelor's degree or higher above state average.
58040.0%Two or more races
39327.1%White
20013.8%Hispanic or Latino
18112.5%Native Hawaiian and Other Pacific Islander
Averages for the 2020 tax year for zip code 96730, filed in 2021:
Average Adjusted Gross Income (AGI) in 2020: $77,682 (Individual Income Tax Returns)
Here:
$77,682
State:
$72,945
Salary/wage: $66,923 (reported on 76.7% of returns)
Here:
$66,923
State:
$57,697
(% of AGI for various income ranges: 1015.0% for AGIs below $25k, 3501.8% for AGIs $25k-50k, 6911.7% for AGIs $50k-75k, 9086.7% for AGIs $75k-100k, 17063.3% for AGIs $100k-200k)
Taxable interest for individuals: $464 (reported on 34.2% of returns)
This zip code:
$464
Hawaii:
$1,356
(% of AGI for various income ranges: 5.0% for AGIs below $25k, 26.4% for AGIs $25k-50k, 36.7% for AGIs $50k-75k, 8.3% for AGIs $75k-100k, 34.4% for AGIs $100k-200k)
Ordinary dividends: $3,907 (reported on 19.2% of returns)
Here:
$3,907
State:
$6,387
(% of AGI for various income ranges: 212.7% for AGIs $25k-50k, 45.0% for AGIs $75k-100k, 317.8% for AGIs $100k-200k)
Net capital gain/loss in AGI: +$10,383 (reported on 16.4% of returns)
Here:
+$10,383
State:
+$23,240
(% of AGI for various income ranges: 80.0% for AGIs below $25k, 365.0% for AGIs $50k-75k, 84.4% for AGIs $100k-200k)
Profit/loss from business: +$11,180 (reported on 20.5% of returns)
Here:
+$11,180
State:
+$15,381
(% of AGI for various income ranges: 100.0% for AGIs below $25k, 355.5% for AGIs $25k-50k, 653.3% for AGIs $50k-75k, 860.0% for AGIs $100k-200k)
Taxable individual retirement arrangement distribution: $15,050 (reported on 5.5% of returns)
96730:
$15,050
Hawaii:
$19,883
(% of AGI for various income ranges: 1003.3% for AGIs $75k-100k)
Total itemized deductions: $29,654 (reported on 17.8% of returns)
Here:
$29,654
State:
$33,097
(% of AGI for various income ranges: 1666.7% for AGIs $50k-75k, 2006.7% for AGIs $100k-200k)
Charity contributions: $3,700 (reported on 13.7% of returns)
Here:
$3,700
State:
$7,368
(% of AGI for various income ranges: 63.3% for AGIs $50k-75k, 246.7% for AGIs $100k-200k)
Taxes paid: $8,283 (reported on 16.4% of returns)
96730:
$8,283
State:
$7,601
(% of AGI for various income ranges: 373.3% for AGIs $50k-75k, 543.3% for AGIs $100k-200k)
Earned income credit: $1,900 (reported on 11.0% of returns)
Here:
$1,900
State:
$2,008
(% of AGI for various income ranges: 75.0% for AGIs below $25k, 56.4% for AGIs $25k-50k)
Percentage of individuals using paid preparers for their 2020 taxes: 90.4%
Here:
90%
State:
89%
(% for various income ranges: 84.2% for AGIs below $25k, 93.3% for AGIs $25k-50k, 90.9% for AGIs $50k-75k, 88.9% for AGIs $75k-100k, 93.3% for AGIs $100k-200k, 100.0% for AGIs over 200k)
Averages for the 2012 tax year for zip code 96730, filed in 2013:
Average Adjusted Gross Income (AGI) in 2012: $57,409 (Individual Income Tax Returns)
Here:
$57,409
State:
$57,303
Salary/wage: $54,066 (reported on 81.3% of returns)
Here:
$54,066
State:
$47,500
(% of AGI for various income ranges: 70.8% for AGIs below $25k, 78.0% for AGIs $25k-50k, 78.2% for AGIs $50k-75k, 81.1% for AGIs $75k-100k, 74.8% for AGIs $100k-200k)
Taxable interest for individuals: $619 (reported on 34.7% of returns)
This zip code:
$619
Hawaii:
$1,212
(% of AGI for various income ranges: 0.3% for AGIs below $25k, 0.1% for AGIs $25k-50k, 0.7% for AGIs $50k-75k, 0.4% for AGIs $100k-200k)
Ordinary dividends: $4,431 (reported on 17.3% of returns)
Here:
$4,431
State:
$5,430
(% of AGI for various income ranges: 2.5% for AGIs below $25k, 2.3% for AGIs $50k-75k, 1.8% for AGIs $100k-200k)
Net capital gain/loss in AGI: +$467 (reported on 12.0% of returns)
Here:
+$467
State:
+$13,910
(% of AGI for various income ranges: 0.6% for AGIs $25k-50k, 0.2% for AGIs $100k-200k)
Profit/loss from business: +$6,615 (reported on 17.3% of returns)
Here:
+$6,615
State:
+$15,881
(% of AGI for various income ranges: 20.1% for AGIs below $25k, 2.4% for AGIs $50k-75k, 0.5% for AGIs $100k-200k)
Taxable individual retirement arrangement distribution: $22,375 (reported on 5.3% of returns)
96730:
$22,375
Hawaii:
$15,720
Total itemized deductions: $24,648 (26% of AGI, reported on 36.0% of returns)
Here:
$24,648
State:
$25,496
Here:
25.5% of AGI
State:
23.1% of AGI
(% of AGI for various income ranges: 8.7% for AGIs below $25k, 7.5% for AGIs $25k-50k, 12.7% for AGIs $50k-75k, 17.8% for AGIs $75k-100k, 19.3% for AGIs $100k-200k)
Charity contributions: $3,558 (reported on 25.3% of returns)
Here:
$3,558
State:
$3,353
(% of AGI for various income ranges: 0.9% for AGIs $25k-50k, 1.6% for AGIs $50k-75k, 2.4% for AGIs $75k-100k, 1.7% for AGIs $100k-200k)
Taxes paid: $6,881 (reported on 36.0% of returns)
96730:
$6,881
State:
$8,029
(% of AGI for various income ranges: 1.8% for AGIs $25k-50k, 3.2% for AGIs $50k-75k, 4.5% for AGIs $75k-100k, 6.1% for AGIs $100k-200k)
Earned income credit: $2,167 (reported on 12.0% of returns)
Here:
$2,167
State:
$2,113
(% of AGI for various income ranges: 4.7% for AGIs below $25k, 0.9% for AGIs $25k-50k)
Percentage of individuals using paid preparers for their 2012 taxes: 52.0%
Here:
52%
State:
53%
(% for various income ranges: 50.0% for AGIs below $25k, 44.4% for AGIs $25k-50k, 58.3% for AGIs $50k-75k, 50.0% for AGIs $75k-100k, 61.5% for AGIs $100k-200k)
Averages for the 2004 tax year for zip code 96730, filed in 2005:
Average Adjusted Gross Income (AGI) in 2004: $42,356 (Individual Income Tax Returns)
Here:
$42,356
State:
$46,564
Salary/wage: $39,760 (reported on 85.1% of returns)
Here:
$39,760
State:
$39,831
(% of AGI for various income ranges: 108.8% for AGIs below $10k, 76.4% for AGIs $10k-25k, 80.1% for AGIs $25k-50k, 90.8% for AGIs $50k-75k, 86.3% for AGIs $75k-100k, 67.2% for AGIs over 100k)
Taxable interest for individuals: $519 (reported on 45.0% of returns)
This zip code:
$519
Hawaii:
$1,263
(% of AGI for various income ranges: 1.7% for AGIs below $10k, 0.4% for AGIs $10k-25k, 0.9% for AGIs $25k-50k, 0.3% for AGIs $50k-75k, 0.3% for AGIs $75k-100k, 0.5% for AGIs over 100k)
Taxable dividends: $1,169 (reported on 18.3% of returns)
Here:
$1,169
State:
$3,145
(% of AGI for various income ranges: 4.9% for AGIs below $10k, 0.5% for AGIs $10k-25k, 0.6% for AGIs $25k-50k, 0.1% for AGIs $50k-75k, 0.3% for AGIs $75k-100k, 0.5% for AGIs over 100k)
Net capital gain/loss: +$3,841 (reported on 12.4% of returns)
Here:
+$3,841
State:
+$16,059
(% of AGI for various income ranges: -1.7% for AGIs below $10k, 0.2% for AGIs $25k-50k, 0.1% for AGIs $50k-75k, -0.2% for AGIs $75k-100k, 4.0% for AGIs over 100k)
Profit/loss from business: +$6,853 (reported on 15.3% of returns)
Here:
+$6,853
State:
+$13,847
(% of AGI for various income ranges: 15.1% for AGIs below $10k, 4.4% for AGIs $10k-25k, 2.5% for AGIs $25k-50k, 0.6% for AGIs $50k-75k, 3.7% for AGIs over 100k)
IRA payment deduction: $2,500 (reported on 2.0% of returns)
96730:
$2,500
Hawaii:
$2,867
Total itemized deductions: $19,407 (26% of AGI, reported on 33.2% of returns)
Here:
$19,407
State:
$20,647
Here:
25.7% of AGI
State:
23.5% of AGI
(% of AGI for various income ranges: 17.3% for AGIs below $10k, 6.2% for AGIs $10k-25k, 12.0% for AGIs $25k-50k, 17.4% for AGIs $50k-75k, 18.6% for AGIs $75k-100k, 17.3% for AGIs over 100k)
Charity contributions deductions: $2,109 (3% of AGI, reported on 28.3% of returns)
Here:
$2,109
State:
$2,966
Here:
2.8% of AGI
State:
3.3% of AGI
(% of AGI for various income ranges: 1.1% for AGIs $10k-25k, 1.2% for AGIs $25k-50k, 1.8% for AGIs $50k-75k, 2.0% for AGIs $75k-100k, 1.2% for AGIs over 100k)
Total tax: $5,420 (reported on 75.9% of returns)
96730:
$5,420
State:
$7,224
(% of AGI for various income ranges: 3.4% for AGIs below $10k, 4.7% for AGIs $10k-25k, 6.9% for AGIs $25k-50k, 8.3% for AGIs $50k-75k, 10.5% for AGIs $75k-100k, 14.9% for AGIs over 100k)
Earned income credit: $1,608 (reported on 14.3% of returns)
Here:
$1,608
State:
$1,536
Percentage of individuals using paid preparers for their 2004 taxes: 51.1%
Here:
51%
State:
58%
(% for various income ranges: 41.0% for AGIs below $10k, 47.1% for AGIs $10k-25k, 53.1% for AGIs $25k-50k, 60.0% for AGIs $50k-75k, 60.3% for AGIs $75k-100k, 54.7% for AGIs over 100k)
Household received Food Stamps/SNAP in the past 12 months: 65 Household did not receive Food Stamps/SNAP in the past 12 months: 482
Women who did not have a birth in the past 12 months: 354 (214 now married, 136 unmarried)
Housing units in zip code 96730 with a mortgage: 311 (38 second mortgage, 34 both second mortgage and home equity loan) Median monthly owner costs for units with a mortgage: $3,864 Median monthly owner costs for units without a mortgage: $540
Residents with income below the poverty level in 2022:
This zip code:
8.7%
Whole state:
10.2%
Residents with income below 50% of the poverty level in 2022:
This zip code:
7.1%
Whole state:
4.7%
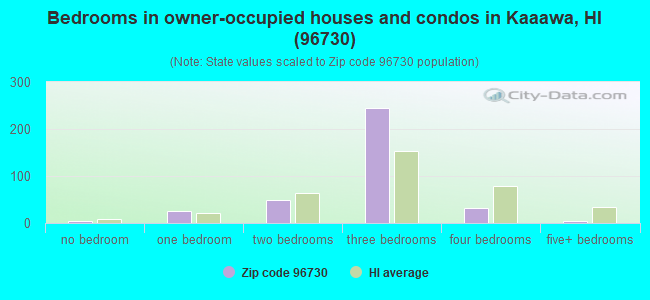
Median number of rooms in houses and condos:
Here:
4.7
State:
5.5
Median number of rooms in apartments:
Here:
4.0
State:
3.9
Notable locations in this zip code not listed on our city pages
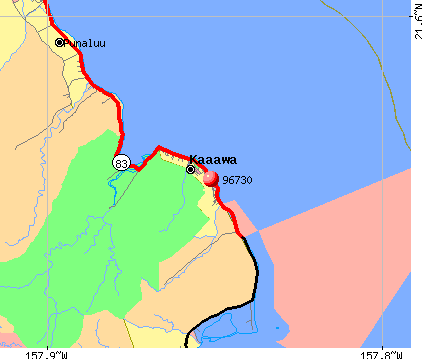
Notable locations in zip code 96730: Honolulu Fire Department Station 21 Kaaawa (A), Emergency Medical Services Unit Rapid Response District 2 (B). Display/hide their locations on the map
Parks in zip code 96730 include: Ka‘a‘awa Beach Park (1), Swanzy Beach Park (2), Kalae‘ō‘io Beach Park (3), Makaua Beach Park (4). Display/hide their locations on the map
Size of family households: 227 2-persons, 53 3-persons, 64 4-persons, 43 5-persons, 21 7-or-more-persons
Size of nonfamily households: 130 1-person, 5 2-persons, 3 3-persons
271 married couples with children.
60 single-parent households (10 men, 50 women).
83.9% of residents of 96730 zip code speak English at home.
2.3% of residents speak Spanish at home (100% very well).
0.7% of residents speak other Indo-European language at home (100% well).
10.8% of residents speak Asian or Pacific Island language at home (83% very well, 17% well).
2.1% of residents speak other language at home (76% very well, 24% well).
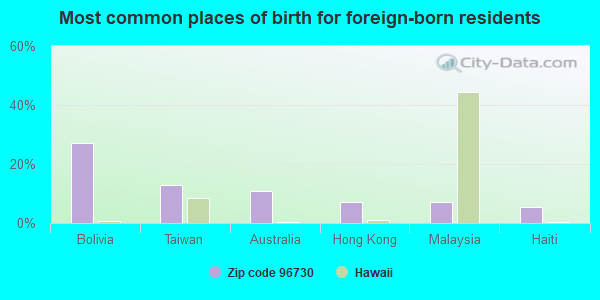
Foreign born population: 50 (3.5%) (42.4% of them are naturalized citizens)
This zip code:
3.5%
Whole state:
17.1%
27%Bolivia
13%Taiwan
11%Australia
7%Hong Kong
7%Malaysia
5%Haiti
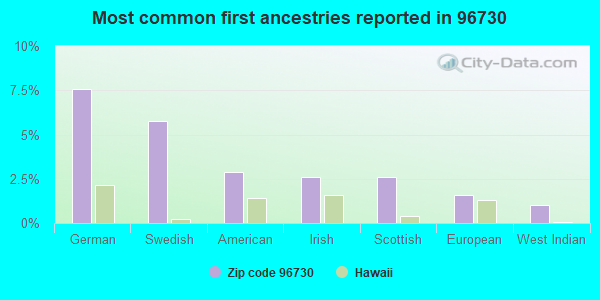
8%German
6%Swedish
3%American
3%Irish
3%Scottish
2%European
1%West Indian
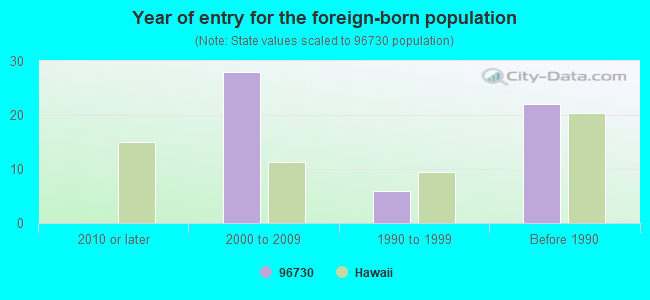
Year of entry for the foreign-born population
02010 or later
282000 to 2009
61990 to 1999
22Before 1990
Facilities with environmental interests located in this zip code:
KAAAWA ELEMENTARY SCHOOL (51-296 KAMEHAMEHA AVENUE in KAAAWA, HI)
(Geographic Names Information System) (National Center for Education Statistics) - STATE ID-4-305 Organizations: HAWAII DEPT OF EDUCATION (SCHOOL DISTRICT)
KAMEHAMEHA HIGHWAY (MILEPOST 2740 TO 3431 in KAAAWA, HI)
National Pollutant Discharge Elimination System NON-MAJOR (Tracking pollutant discharge elimination systems) - permit Business SIC classification: HIGHWAY AND STREET CONSTRUCTION, EXCEPT ELEVATED HIGHWAYS Organizations: STATE DEPT OF TRANSPORTATION80 (CONTACT/OWNER)
Alternative names: STATE DEPT OF TRANSPORTATION
Housing units lacking complete plumbing facilities: 0.9% Housing units lacking complete kitchen facilities: 1.9%
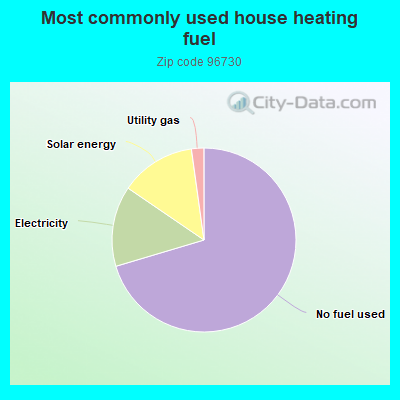
70.6%No fuel used
14.2%Electricity
13.3%Solar energy
2.2%Utility gas
Population in 1990: 2,305.
Place of birth for U.S.-born residents:
This state: 648
Northeast: 176
Midwest: 187
South: 110
West: 286
59% of the 96730 zip code residents lived in the same house 5 years ago. Out of people who lived in different houses, 77% lived in this county. Out of people who lived in different counties, 50% lived in Hawaii.
89% of the 96730 zip code residents lived in the same house 1 year ago. Out of people who lived in different houses, 50% moved from this county. Out of people who lived in different houses, 49% moved from different state.
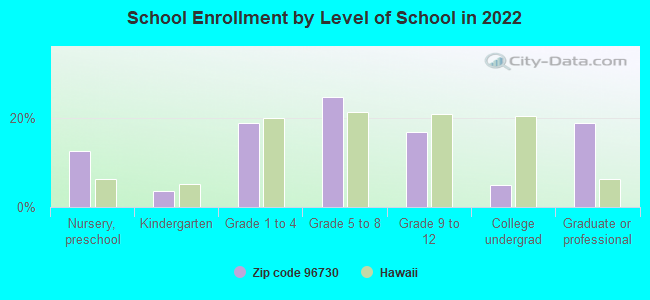
Private vs. public school enrollment:
Students in private schools in grades 1 to 8 (elementary and middle school): 60
Here:
31.8%
Hawaii:
21.6%
Students in private schools in grades 9 to 12 (high school):
Here:
0.0%
Hawaii:
21.5%
Students in private undergraduate colleges:
Here:
0.0%
Hawaii:
23.3%
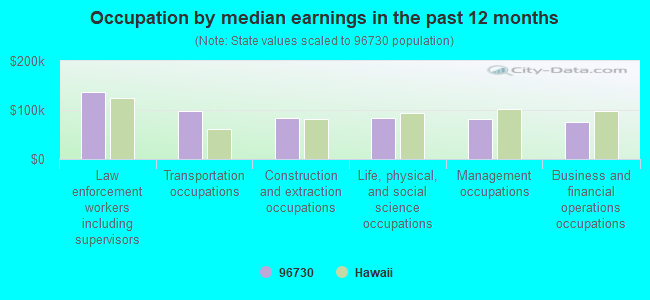
Occupation by median earnings in the past 12 months ($)
136,874Law enforcement workers including supervisors
98,477Transportation occupations
83,526Construction and extraction occupations
82,900Life, physical, and social science occupations
82,234Management occupations
75,474Business and financial operations occupations
Top industries in this zip code by the number of employees in 2005:
Accommodation and Food Services: Full-Service Restaurants (50-99 employees: 1 establishment)
Wholesale Trade: Other Electronic Parts and Equipment Merchant Wholesalers (10-19: 1)
Professional, Scientific, and Technical Services: Environmental Consulting Services (5-9: 1)
Construction: New Single-Family Housing Construction (except Operative Builders) (1-4: 1)
Construction: Drywall and Insulation Contractors (1-4: 1)
Construction: Commercial and Institutional Building Construction (1-4: 1)
Other Services (except Public Administration): Environment, Conservation and Wildlife Organizations (1-4: 1)
People in group quarters in 2010:
2 people in other noninstitutional facilities
Fatal accident statistics in 2014:
Fatal accident count: 3
Vehicles involved in fatal accidents: 3
Fatal accidents caused by drunken drivers: 2
Fatalities: 3
Persons involved in fatal accidents: 6
Pedestrians involved in fatal accidents: 1
Fatal accident statistics in 2012:
Fatal accident count: 1
Vehicles involved in fatal accidents: 2
Fatal accidents caused by drunken drivers: 1
Fatalities: 1
Persons involved in fatal accidents: 4
Pedestrians involved in fatal accidents: 0
Home Mortgage Disclosure Act Aggregated Statistics For Year 2009 (Based on 2 partial tracts)
A) FHA, FSA/RHS & VA Home Purchase Loans
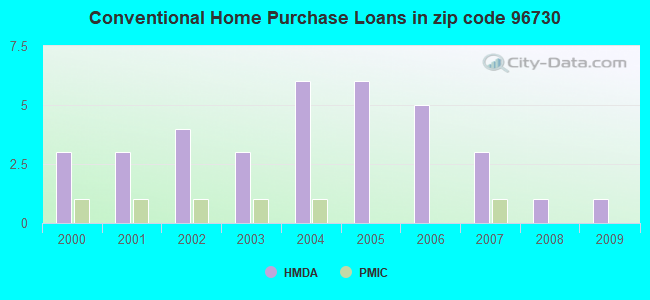
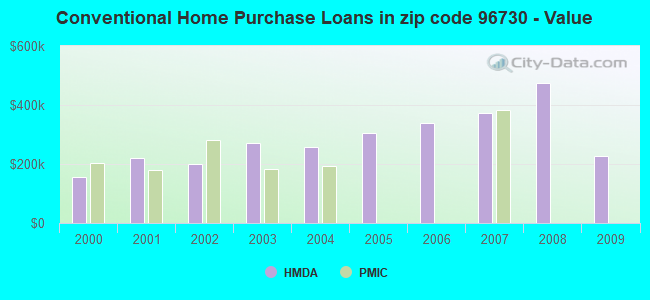
B) Conventional Home Purchase Loans
C) Refinancings
F) Non-occupant Loans on < 5 Family Dwellings (A B C & D)
Number
Average Value
Number
Average Value
Number
Average Value
Number
Average Value
LOANS ORIGINATED
1
$301,230
1
$228,100
6
$337,107
2
$251,435
APPLICATIONS APPROVED, NOT ACCEPTED
0
$0
0
$0
0
$0
0
$0
APPLICATIONS DENIED
0
$0
0
$0
3
$376,750
0
$0
APPLICATIONS WITHDRAWN
0
$0
0
$0
1
$651,020
0
$0
FILES CLOSED FOR INCOMPLETENESS
0
$0
0
$0
0
$0
0
$0
Aggregated Statistics For Year 2008 (Based on 2 partial tracts)
B) Conventional Home Purchase Loans
C) Refinancings
D) Home Improvement Loans
F) Non-occupant Loans on < 5 Family Dwellings (A B C & D)
Number
Average Value
Number
Average Value
Number
Average Value
Number
Average Value
LOANS ORIGINATED
1
$474,440
3
$378,653
1
$195,740
1
$381,600
APPLICATIONS APPROVED, NOT ACCEPTED
0
$0
1
$235,350
0
$0
0
$0
APPLICATIONS DENIED
1
$364,470
3
$392,713
1
$258,000
0
$0
APPLICATIONS WITHDRAWN
0
$0
1
$533,690
0
$0
0
$0
FILES CLOSED FOR INCOMPLETENESS
0
$0
0
$0
0
$0
0
$0
Aggregated Statistics For Year 2007 (Based on 2 partial tracts)
B) Conventional Home Purchase Loans
C) Refinancings
D) Home Improvement Loans
F) Non-occupant Loans on < 5 Family Dwellings (A B C & D)
Number
Average Value
Number
Average Value
Number
Average Value
Number
Average Value
LOANS ORIGINATED
3
$374,213
7
$348,673
1
$249,350
3
$257,573
APPLICATIONS APPROVED, NOT ACCEPTED
0
$0
2
$407,020
0
$0
1
$251,060
APPLICATIONS DENIED
1
$241,550
6
$422,105
0
$0
1
$344,330
APPLICATIONS WITHDRAWN
1
$323,150
2
$378,315
0
$0
1
$163,390
FILES CLOSED FOR INCOMPLETENESS
0
$0
0
$0
0
$0
0
$0
Aggregated Statistics For Year 2006 (Based on 2 partial tracts)
B) Conventional Home Purchase Loans
C) Refinancings
D) Home Improvement Loans
F) Non-occupant Loans on < 5 Family Dwellings (A B C & D)
Number
Average Value
Number
Average Value
Number
Average Value
Number
Average Value
LOANS ORIGINATED
5
$338,572
9
$326,376
2
$230,095
4
$303,652
APPLICATIONS APPROVED, NOT ACCEPTED
1
$184,630
1
$342,730
0
$0
0
$0
APPLICATIONS DENIED
2
$315,840
5
$337,294
1
$331,810
1
$294,230
APPLICATIONS WITHDRAWN
2
$275,810
3
$358,557
0
$0
1
$157,980
FILES CLOSED FOR INCOMPLETENESS
0
$0
1
$289,380
0
$0
0
$0
Aggregated Statistics For Year 2005 (Based on 2 partial tracts)
B) Conventional Home Purchase Loans
C) Refinancings
D) Home Improvement Loans
F) Non-occupant Loans on < 5 Family Dwellings (A B C & D)
Number
Average Value
Number
Average Value
Number
Average Value
Number
Average Value
LOANS ORIGINATED
6
$306,397
8
$338,499
1
$279,370
4
$329,365
APPLICATIONS APPROVED, NOT ACCEPTED
1
$322,350
1
$369,320
0
$0
1
$108,430
APPLICATIONS DENIED
2
$305,250
3
$313,367
1
$121,630
2
$239,155
APPLICATIONS WITHDRAWN
2
$228,255
4
$247,672
1
$225,030
1
$256,100
FILES CLOSED FOR INCOMPLETENESS
0
$0
1
$207,350
0
$0
0
$0
Aggregated Statistics For Year 2004 (Based on 2 partial tracts)
B) Conventional Home Purchase Loans
C) Refinancings
D) Home Improvement Loans
F) Non-occupant Loans on < 5 Family Dwellings (A B C & D)
Number
Average Value
Number
Average Value
Number
Average Value
Number
Average Value
LOANS ORIGINATED
6
$256,110
8
$255,892
1
$199,980
2
$318,880
APPLICATIONS APPROVED, NOT ACCEPTED
1
$397,140
1
$399,530
0
$0
0
$0
APPLICATIONS DENIED
1
$353,600
2
$217,695
0
$0
1
$186,840
APPLICATIONS WITHDRAWN
1
$414,510
4
$258,095
0
$0
1
$155,100
FILES CLOSED FOR INCOMPLETENESS
0
$0
1
$164,980
0
$0
0
$0
Aggregated Statistics For Year 2003 (Based on 2 partial tracts)
B) Conventional Home Purchase Loans
C) Refinancings
F) Non-occupant Loans on < 5 Family Dwellings (A B C & D)
Number
Average Value
Number
Average Value
Number
Average Value
LOANS ORIGINATED
3
$270,590
13
$208,722
3
$156,773
APPLICATIONS APPROVED, NOT ACCEPTED
0
$0
2
$164,060
0
$0
APPLICATIONS DENIED
0
$0
3
$190,380
1
$149,140
APPLICATIONS WITHDRAWN
1
$213,670
3
$220,180
1
$104,870
FILES CLOSED FOR INCOMPLETENESS
0
$0
1
$114,390
0
$0
Aggregated Statistics For Year 2002 (Based on 2 partial tracts)
B) Conventional Home Purchase Loans
C) Refinancings
F) Non-occupant Loans on < 5 Family Dwellings (A B C & D)
Number
Average Value
Number
Average Value
Number
Average Value
LOANS ORIGINATED
4
$201,422
8
$199,328
3
$169,873
APPLICATIONS APPROVED, NOT ACCEPTED
1
$163,450
1
$249,590
1
$138,700
APPLICATIONS DENIED
1
$195,560
1
$222,150
1
$142,820
APPLICATIONS WITHDRAWN
0
$0
2
$204,615
0
$0
FILES CLOSED FOR INCOMPLETENESS
0
$0
0
$0
0
$0
Aggregated Statistics For Year 2001 (Based on 2 partial tracts)
B) Conventional Home Purchase Loans
C) Refinancings
F) Non-occupant Loans on < 5 Family Dwellings (A B C & D)
Number
Average Value
Number
Average Value
Number
Average Value
LOANS ORIGINATED
3
$218,993
5
$174,180
2
$206,670
APPLICATIONS APPROVED, NOT ACCEPTED
0
$0
1
$107,020
0
$0
APPLICATIONS DENIED
1
$127,040
2
$138,060
0
$0
APPLICATIONS WITHDRAWN
0
$0
1
$227,550
0
$0
FILES CLOSED FOR INCOMPLETENESS
0
$0
1
$98,420
0
$0
Aggregated Statistics For Year 2000 (Based on 2 partial tracts)
B) Conventional Home Purchase Loans
C) Refinancings
F) Non-occupant Loans on < 5 Family Dwellings (A B C & D)
Detailed PMIC statistics for the following Tracts:0102.01
2003 - 2018 National Fire Incident Reporting System (NFIRS) incidents
According to the data from the years 2003 - 2018 the average number of fires per year is 7. The highest number of fires - 18 took place in 2018, and the least - 2 in 2012. The data has a rising trend.
When looking into fire subcategories, the most reports belonged to: Outside Fires (51.9%), and Mobile Property/Vehicle Fires (25.9%).
Fire incident types reported to NFIRS in Zip Code 96730


 Nearest zip codes: 96717, 96744, 96789, 96762, 96863, 96786.


 According to the data from the years 2003 - 2018 the average number of fires per year is 7. The highest number of fires - 18 took place in 2018, and the least - 2 in 2012. The data has a rising trend.
 When looking into fire subcategories, the most reports belonged to: Outside Fires (51.9%), and Mobile Property/Vehicle Fires (25.9%).