Estimated zip code population in 2022: 1,126 Zip code population in 2010: 1,567 Zip code population in 2000: 1,512
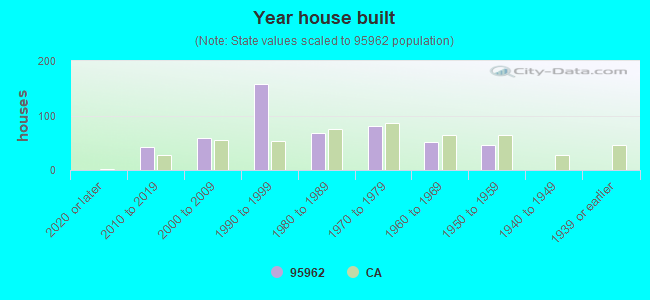
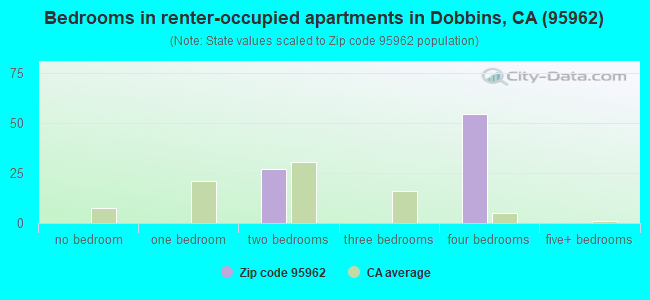
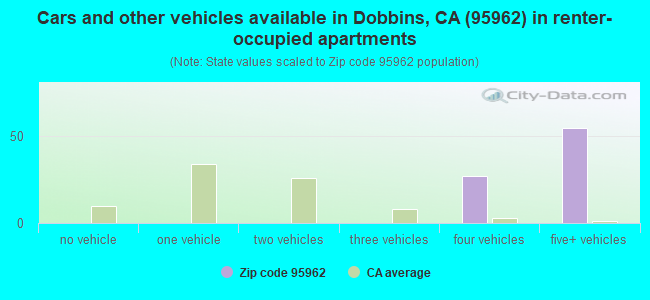
Houses and condos: 514 Renter-occupied apartments: 81
% of renters here:
17%
State:
44%
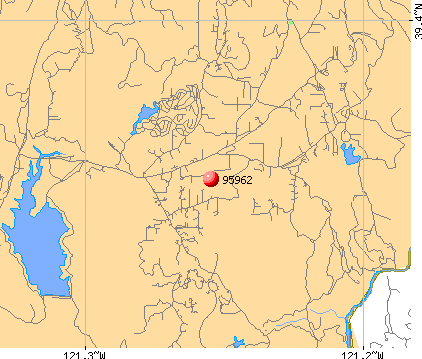
March 2022 cost of living index in zip code 95962: 94.1 (less than average, U.S. average is 100)
Land area: 29.7 sq. mi. Water area: 0.2 sq. mi.
Population density: 38 people per square mile
(very low).
OSM Map
General Map
Google Map
MSN Map
OSM Map
General Map
Google Map
MSN Map
OSM Map
General Map
Google Map
MSN Map
OSM Map
General Map
Google Map
MSN Map
Please wait while loading the map...
Real estate property taxes paid for housing units in 2022:
This zip code:
0.9% ($3,486)
California:
0.7% ($4,831)
Median real estate property taxes paid for housing units with mortgages in 2022: $4,380 (1.0%) Median real estate property taxes paid for housing units with no mortgage in 2022: $3,316 (0.8%)
Business Search- 14 Million verified businesses
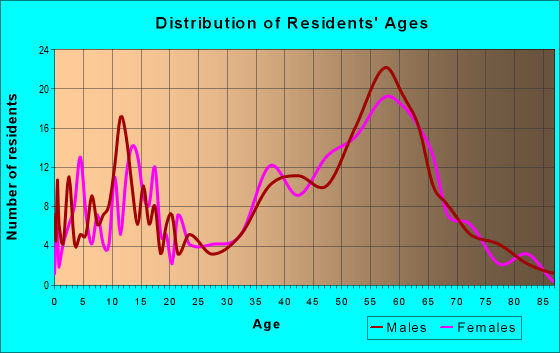
Males: 720
(64.0%)
Females: 405
(36.0%)
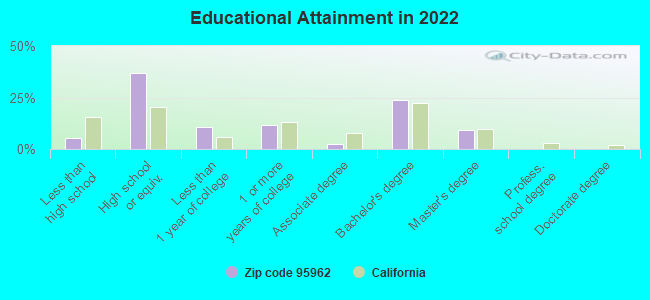
For population 25 years and over in 95962:
High school or higher: 94.2%
Bachelor's degree or higher: 32.8%
Graduate or professional degree: 9.3%
Mean travel time to work (commute): 38.0 minutes
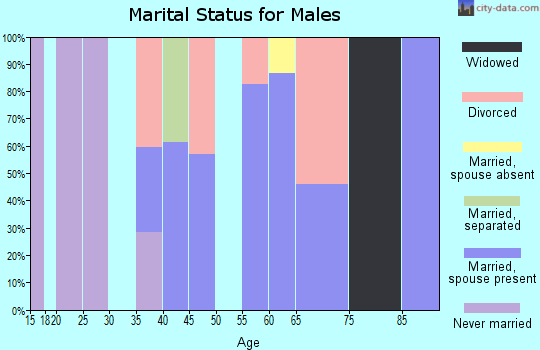
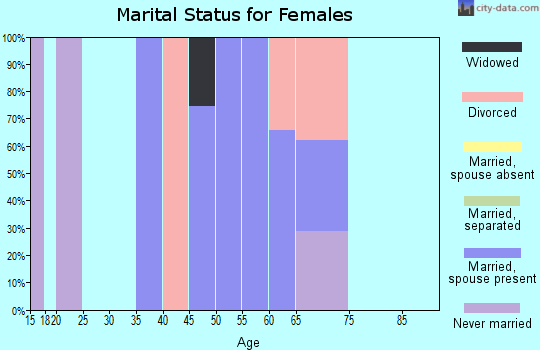
For population 15 years and over in 95962:
Never married: 11.4%
Now married: 65.8%
Separated: 0.0%
Widowed: 6.5%
Divorced: 16.3%
Zip code 95962 compared to state average:
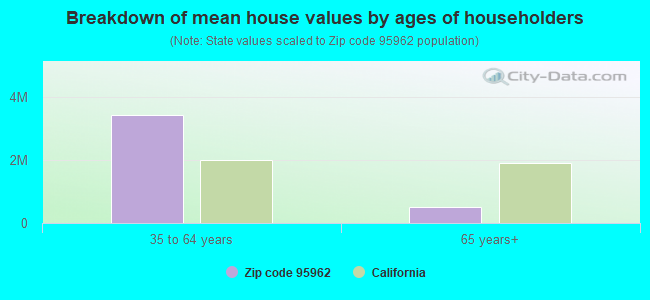
Median house value below state average.
Unemployed percentage significantly below state average.
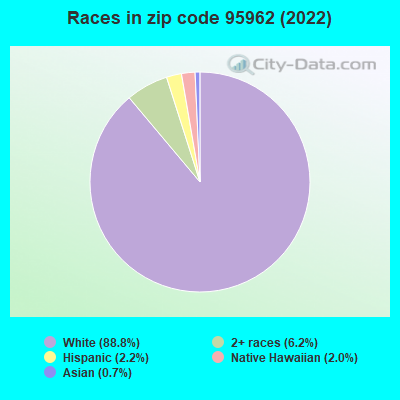
Black race population percentage significantly below state average.
Hispanic race population percentage significantly below state average.
Median age above state average.
Renting percentage significantly below state average.
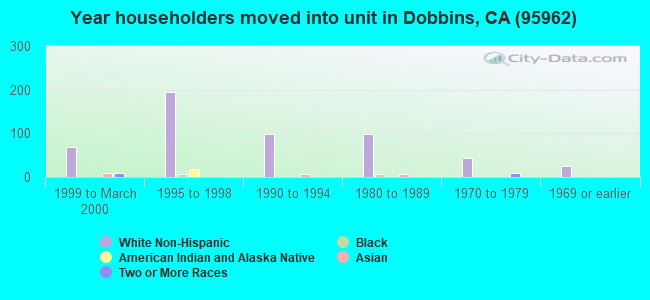
Length of stay since moving in significantly above state average.
Averages for the 2020 tax year for zip code 95962, filed in 2021:
Average Adjusted Gross Income (AGI) in 2020: $58,437 (Individual Income Tax Returns)
Here:
$58,437
State:
$95,910
Salary/wage: $55,593 (reported on 63.4% of returns)
Here:
$55,593
State:
$77,331
(% of AGI for various income ranges: 1218.6% for AGIs below $25k, 3111.4% for AGIs $25k-50k, 6194.0% for AGIs $50k-75k, 11390.0% for AGIs $75k-100k, 21995.0% for AGIs $100k-200k)
Taxable interest for individuals: $814 (reported on 39.4% of returns)
This zip code:
$814
California:
$2,294
(% of AGI for various income ranges: 19.3% for AGIs below $25k, 74.3% for AGIs $25k-50k, 52.0% for AGIs $50k-75k, 20.0% for AGIs $75k-100k, 92.5% for AGIs $100k-200k)
Ordinary dividends: $3,558 (reported on 16.9% of returns)
Here:
$3,558
State:
$10,949
(% of AGI for various income ranges: 33.6% for AGIs below $25k, 157.1% for AGIs $25k-50k, 328.0% for AGIs $50k-75k, 265.0% for AGIs $100k-200k)
Net capital gain/loss in AGI: +$8,600 (reported on 19.7% of returns)
Here:
+$8,600
State:
+$49,306
(% of AGI for various income ranges: 7.1% for AGIs below $25k, 118.6% for AGIs $25k-50k, 274.0% for AGIs $50k-75k, 2435.0% for AGIs $100k-200k)
Profit/loss from business: +$5,100 (reported on 32.4% of returns)
Here:
+$5,100
State:
+$15,671
(% of AGI for various income ranges: 334.3% for AGIs below $25k, 234.3% for AGIs $25k-50k, 246.0% for AGIs $50k-75k, 1045.0% for AGIs $100k-200k)
Taxable individual retirement arrangement distribution: $13,688 (reported on 11.3% of returns)
95962:
$13,688
California:
$23,505
(% of AGI for various income ranges: 935.7% for AGIs $25k-50k, 1466.7% for AGIs $75k-100k)
Total itemized deductions: $29,833 (reported on 12.7% of returns)
Here:
$29,833
State:
$39,517
(% of AGI for various income ranges: 2726.0% for AGIs $50k-75k, 3305.0% for AGIs $100k-200k)
Charity contributions: $11,567 (reported on 12.7% of returns)
Here:
$11,567
State:
$12,598
(% of AGI for various income ranges: 742.0% for AGIs $50k-75k, 1675.0% for AGIs $100k-200k)
Taxes paid: $6,756 (reported on 12.7% of returns)
95962:
$6,756
State:
$8,807
(% of AGI for various income ranges: 466.0% for AGIs $50k-75k, 937.5% for AGIs $100k-200k)
Earned income credit: $1,482 (reported on 15.5% of returns)
Here:
$1,482
State:
$2,074
(% of AGI for various income ranges: 116.4% for AGIs below $25k)
Percentage of individuals using paid preparers for their 2020 taxes: 93.0%
Here:
93%
State:
92%
(% for various income ranges: 90.3% for AGIs below $25k, 92.3% for AGIs $25k-50k, 88.9% for AGIs $50k-75k, 100.0% for AGIs $75k-100k, 100.0% for AGIs $100k-200k, 100.0% for AGIs over 200k)
Averages for the 2012 tax year for zip code 95962, filed in 2013:
Average Adjusted Gross Income (AGI) in 2012: $48,558 (Individual Income Tax Returns)
Here:
$48,558
State:
$72,726
Salary/wage: $47,436 (reported on 70.1% of returns)
Here:
$47,436
State:
$59,079
(% of AGI for various income ranges: 57.2% for AGIs below $25k, 66.2% for AGIs $25k-50k, 62.4% for AGIs $50k-75k, 74.1% for AGIs $75k-100k, 72.4% for AGIs $100k-200k)
Taxable interest for individuals: $580 (reported on 37.3% of returns)
This zip code:
$580
California:
$2,146
(% of AGI for various income ranges: 0.8% for AGIs below $25k, 0.1% for AGIs $25k-50k, 1.0% for AGIs $50k-75k, 0.4% for AGIs $100k-200k)
Ordinary dividends: $2,510 (reported on 14.9% of returns)
Here:
$2,510
State:
$9,308
(% of AGI for various income ranges: 2.4% for AGIs below $25k, 0.7% for AGIs $50k-75k, 1.0% for AGIs $100k-200k)
Profit/loss from business: +$6,214 (reported on 31.3% of returns)
Here:
+$6,214
State:
+$17,064
(% of AGI for various income ranges: 13.7% for AGIs below $25k, 7.3% for AGIs $25k-50k, 5.2% for AGIs $50k-75k, 1.6% for AGIs $100k-200k)
Taxable individual retirement arrangement distribution: $10,883 (reported on 9.0% of returns)
95962:
$10,883
California:
$19,557
Total itemized deductions: $25,758 (30% of AGI, reported on 38.8% of returns)
Here:
$25,758
State:
$34,004
Here:
29.9% of AGI
State:
22.7% of AGI
(% of AGI for various income ranges: 14.0% for AGIs below $25k, 19.3% for AGIs $25k-50k, 23.3% for AGIs $50k-75k, 19.6% for AGIs $75k-100k, 21.8% for AGIs $100k-200k)
Charity contributions: $8,400 (reported on 34.3% of returns)
Here:
$8,400
State:
$4,659
(% of AGI for various income ranges: 4.5% for AGIs $25k-50k, 6.0% for AGIs $50k-75k, 6.6% for AGIs $75k-100k, 7.6% for AGIs $100k-200k)
Taxes paid: $6,423 (reported on 38.8% of returns)
95962:
$6,423
State:
$14,448
(% of AGI for various income ranges: 2.1% for AGIs below $25k, 3.0% for AGIs $25k-50k, 3.7% for AGIs $50k-75k, 5.1% for AGIs $75k-100k, 7.2% for AGIs $100k-200k)
Earned income credit: $1,260 (reported on 22.4% of returns)
Here:
$1,260
State:
$2,286
(% of AGI for various income ranges: 5.0% for AGIs below $25k, 0.7% for AGIs $25k-50k)
Percentage of individuals using paid preparers for their 2012 taxes: 64.2%
Here:
64%
State:
64%
(% for various income ranges: 62.1% for AGIs below $25k, 64.3% for AGIs $25k-50k, 77.8% for AGIs $50k-75k, 50.0% for AGIs $75k-100k, 66.7% for AGIs $100k-200k)
Averages for the 2004 tax year for zip code 95962, filed in 2005:
Average Adjusted Gross Income (AGI) in 2004: $37,672 (Individual Income Tax Returns)
Here:
$37,672
State:
$58,600
Salary/wage: $34,280 (reported on 77.6% of returns)
Here:
$34,280
State:
$49,455
(% of AGI for various income ranges: 98.6% for AGIs below $10k, 60.6% for AGIs $10k-25k, 61.5% for AGIs $25k-50k, 73.4% for AGIs $50k-75k, 71.9% for AGIs $75k-100k, 74.5% for AGIs over 100k)
Taxable interest for individuals: $1,295 (reported on 43.5% of returns)
This zip code:
$1,295
California:
$2,365
(% of AGI for various income ranges: 2.2% for AGIs below $10k, 2.4% for AGIs $10k-25k, 2.7% for AGIs $25k-50k, 1.0% for AGIs $50k-75k, 1.1% for AGIs $75k-100k, 0.9% for AGIs over 100k)
Taxable dividends: $1,303 (reported on 16.6% of returns)
Here:
$1,303
State:
$4,746
(% of AGI for various income ranges: 1.7% for AGIs below $10k, 0.8% for AGIs $10k-25k, 0.9% for AGIs $25k-50k, 0.5% for AGIs $50k-75k, 0.2% for AGIs $75k-100k, 0.4% for AGIs over 100k)
Net capital gain/loss: +$3,597 (reported on 16.8% of returns)
Here:
+$3,597
State:
+$23,418
(% of AGI for various income ranges: -1.5% for AGIs below $10k, -0.4% for AGIs $10k-25k, 2.1% for AGIs $25k-50k, 3.3% for AGIs $50k-75k, 2.6% for AGIs $75k-100k, 0.5% for AGIs over 100k)
Profit/loss from business: +$12,993 (reported on 35.3% of returns)
Here:
+$12,993
State:
+$16,826
(% of AGI for various income ranges: 28.3% for AGIs below $10k, 19.1% for AGIs $10k-25k, 10.2% for AGIs $25k-50k, 6.5% for AGIs $50k-75k, 12.4% for AGIs $75k-100k, 13.5% for AGIs over 100k)
IRA payment deduction: $3,895 (reported on 2.4% of returns)
95962:
$3,895
California:
$3,192
Total itemized deductions: $23,017 (36% of AGI, reported on 45.1% of returns)
Here:
$23,017
State:
$28,113
Here:
36.3% of AGI
State:
25.3% of AGI
(% of AGI for various income ranges: 24.1% for AGIs $10k-25k, 30.4% for AGIs $25k-50k, 28.8% for AGIs $50k-75k, 25.1% for AGIs $75k-100k, 30.0% for AGIs over 100k)
Charity contributions deductions: $10,547 (16% of AGI, reported on 41.8% of returns)
Here:
$10,547
State:
$3,923
Here:
16.2% of AGI
State:
3.3% of AGI
(% of AGI for various income ranges: 8.1% for AGIs $10k-25k, 10.9% for AGIs $25k-50k, 10.8% for AGIs $50k-75k, 11.4% for AGIs $75k-100k, 15.4% for AGIs over 100k)
Total tax: $4,982 (reported on 71.4% of returns)
95962:
$4,982
State:
$10,761
(% of AGI for various income ranges: 4.7% for AGIs below $10k, 4.9% for AGIs $10k-25k, 6.3% for AGIs $25k-50k, 7.9% for AGIs $50k-75k, 10.9% for AGIs $75k-100k, 13.9% for AGIs over 100k)
Earned income credit: $947 (reported on 25.9% of returns)
Here:
$947
State:
$1,763
Percentage of individuals using paid preparers for their 2004 taxes: 58.5%
Here:
59%
State:
66%
(% for various income ranges: 47.9% for AGIs below $10k, 59.9% for AGIs $10k-25k, 62.6% for AGIs $25k-50k, 66.4% for AGIs $50k-75k, 61.5% for AGIs $75k-100k, 65.1% for AGIs over 100k)
Household received Food Stamps/SNAP in the past 12 months: 0 Household did not receive Food Stamps/SNAP in the past 12 months: 450
Women who had a birth in the past 12 months: 25 (25 now married, 0 unmarried) Women who did not have a birth in the past 12 months: 183 (118 now married, 63 unmarried)
Housing units in zip code 95962 with a mortgage: 100 (9 second mortgage) Median monthly owner costs for units with a mortgage: $2,162 Median monthly owner costs for units without a mortgage: $748
Residents with income below the poverty level in 2022:
This zip code:
0.7%
Whole state:
12.2%
Residents with income below 50% of the poverty level in 2022:
This zip code:
0.7%
Whole state:
6.2%
Median number of rooms in houses and condos:
Here:
6.1
State:
6.0
Notable locations in this zip code not listed on our city pages
Notable locations in zip code 95962: Thousand Trails Campground (A), Richards Ranch (B), Dobbins - Oregon House Fire Protection District (C). Display/hide their locations on the map
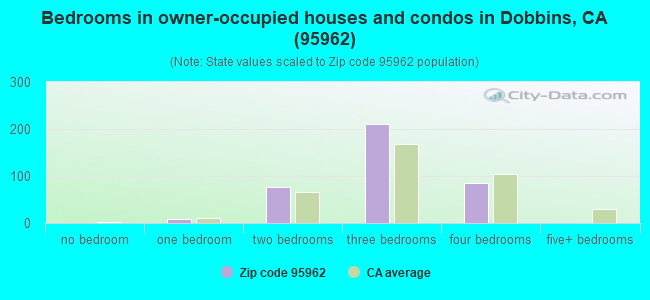
Size of family households: 147 2-persons, 54 3-persons, 63 4-persons
Size of nonfamily households: 87 1-person, 40 2-persons, 75 4-persons
126 married couples with children.
0 single-parent households ().
82.1% of residents of 95962 zip code speak English at home.
2.4% of residents speak Spanish at home (37% very well, 63% well).
12.4% of residents speak other Indo-European language at home (42% very well, 58% well).
2.1% of residents speak Asian or Pacific Island language at home (100% very well).
2.9% of residents speak other language at home (100% very well).
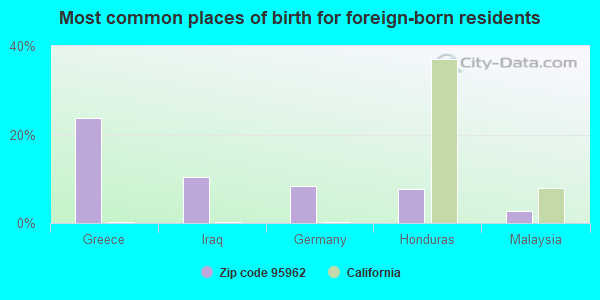
Foreign born population: 300 (26.7%) (88.8% of them are naturalized citizens)
This zip code:
26.7%
Whole state:
26.7%
24%Greece
10%Iraq
8%Germany
8%Honduras
3%Malaysia
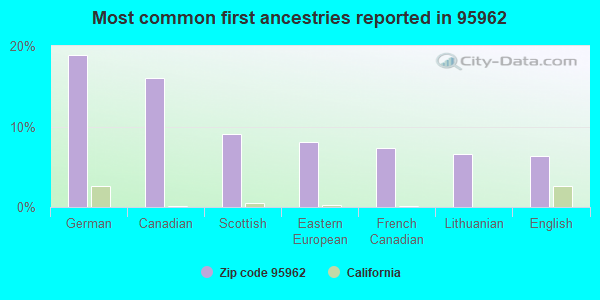
19%German
16%Canadian
9%Scottish
8%Eastern European
7%French Canadian
7%Lithuanian
6%English
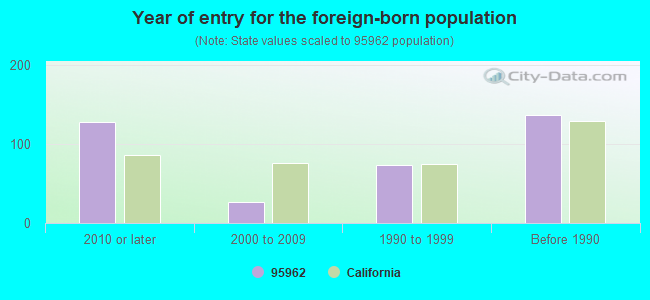
Year of entry for the foreign-born population
1282010 or later
272000 to 2009
741990 to 1999
137Before 1990
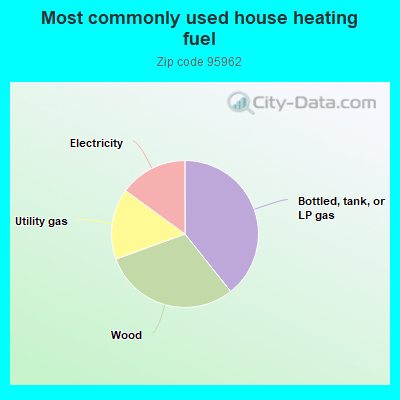
39.4%Bottled, tank, or LP gas
30.2%Wood
15.6%Utility gas
15.0%Electricity
Place of birth for U.S.-born residents:
This state: 533
Northeast: 100
Midwest: 45
South: 84
54% of the 95962 zip code residents lived in the same house 5 years ago. Out of people who lived in different houses, 45% lived in this county. Out of people who lived in different counties, 50% lived in California.
85% of the 95962 zip code residents lived in the same house 1 year ago. Out of people who lived in different houses, 56% moved from this county. Out of people who lived in different houses, 41% moved from different county within same state.
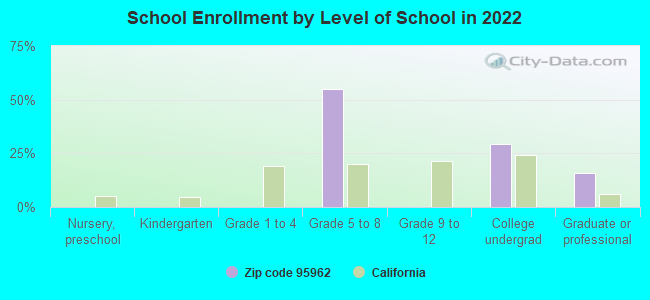
Private vs. public school enrollment:
Students in private schools in grades 1 to 8 (elementary and middle school): 28
Here:
25.7%
California:
10.5%
Students in private undergraduate colleges:
Here:
0.0%
California:
15.9%
Companies with federal contracts located in this zip code:
A & K TRANSPORTS (1264 PALMETTO AVE in OREGON HOUSE, CA; small business) 2 employees, $110000 revenue.
$53,000 with Forest Service (disused code: now 12C2) for Lease or Rental of Equipment -- Miscellaneous. Taking place in OR. Signed on 2002-09-15. Completion date: 2002-09-15.
Top industries in this zip code by the number of employees in 2005:
Other Services (except Public Administration): Religious Organizations (100-249 employees: 1 establishment)
Accommodation and Food Services: RV (Recreational Vehicle) Parks and Campgrounds (20-49: 1, 10-19: 1)
Educational Services: Elementary and Secondary Schools (20-49: 1)
Wholesale Trade: Piece Goods, Notions, and Other Dry Goods Merchant Wholesalers (10-19: 1)
Wholesale Trade: Computer and Computer Peripheral Equipment and Software Merchant Wholesalers (5-9: 1)
Professional, Scientific, and Technical Services: Other Scientific and Technical Consulting Services (1-4: 3)
Professional, Scientific, and Technical Services: Translation and Interpretation Services (1-4: 1)
Fatal accident statistics in 2014:
Fatal accident count: 2
Vehicles involved in fatal accidents: 2
Fatal accidents caused by drunken drivers: 0
Fatalities: 2
Persons involved in fatal accidents: 2
Pedestrians involved in fatal accidents: 0
Fatal accident statistics in 2013:
Fatal accident count: 1
Vehicles involved in fatal accidents: 1
Fatal accidents caused by drunken drivers: 1
Fatalities: 3
Persons involved in fatal accidents: 4
Pedestrians involved in fatal accidents: 0
Home Mortgage Disclosure Act Aggregated Statistics For Year 2009 (Based on 4 partial tracts)
A) FHA, FSA/RHS & VA Home Purchase Loans
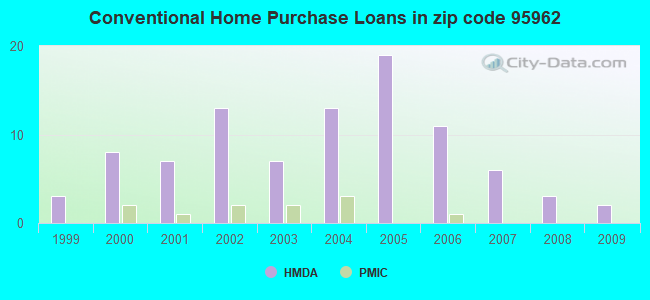
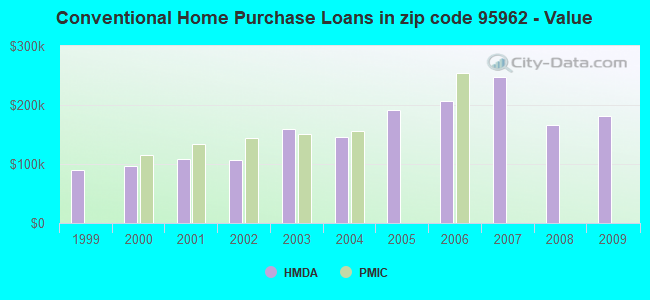
B) Conventional Home Purchase Loans
C) Refinancings
D) Home Improvement Loans
F) Non-occupant Loans on < 5 Family Dwellings (A B C & D)
G) Loans On Manufactured Home Dwelling (A B C & D)
Number
Average Value
Number
Average Value
Number
Average Value
Number
Average Value
Number
Average Value
Number
Average Value
LOANS ORIGINATED
3
$234,747
2
$181,155
10
$176,142
0
$0
3
$167,453
2
$200,590
APPLICATIONS APPROVED, NOT ACCEPTED
0
$0
0
$0
1
$206,100
0
$0
0
$0
0
$0
APPLICATIONS DENIED
1
$129,280
2
$143,800
11
$180,505
1
$47,310
1
$180,800
4
$155,860
APPLICATIONS WITHDRAWN
0
$0
0
$0
4
$174,538
0
$0
1
$102,110
1
$168,860
FILES CLOSED FOR INCOMPLETENESS
0
$0
0
$0
0
$0
0
$0
0
$0
0
$0
Aggregated Statistics For Year 2008 (Based on 4 partial tracts)
A) FHA, FSA/RHS & VA Home Purchase Loans
B) Conventional Home Purchase Loans
C) Refinancings
D) Home Improvement Loans
F) Non-occupant Loans on < 5 Family Dwellings (A B C & D)
G) Loans On Manufactured Home Dwelling (A B C & D)
Number
Average Value
Number
Average Value
Number
Average Value
Number
Average Value
Number
Average Value
Number
Average Value
LOANS ORIGINATED
2
$209,490
3
$165,580
11
$199,006
1
$144,740
3
$153,637
6
$179,163
APPLICATIONS APPROVED, NOT ACCEPTED
0
$0
0
$0
3
$203,050
0
$0
1
$232,090
1
$281,270
APPLICATIONS DENIED
0
$0
2
$175,180
11
$187,744
3
$142,003
1
$77,050
3
$169,170
APPLICATIONS WITHDRAWN
0
$0
0
$0
5
$211,858
0
$0
0
$0
1
$212,890
FILES CLOSED FOR INCOMPLETENESS
0
$0
0
$0
1
$316,640
0
$0
0
$0
0
$0
Aggregated Statistics For Year 2007 (Based on 4 partial tracts)
B) Conventional Home Purchase Loans
C) Refinancings
D) Home Improvement Loans
F) Non-occupant Loans on < 5 Family Dwellings (A B C & D)
G) Loans On Manufactured Home Dwelling (A B C & D)
Number
Average Value
Number
Average Value
Number
Average Value
Number
Average Value
Number
Average Value
LOANS ORIGINATED
6
$247,432
19
$209,301
5
$133,588
4
$210,898
7
$158,520
APPLICATIONS APPROVED, NOT ACCEPTED
1
$237,950
5
$286,098
0
$0
0
$0
2
$167,455
APPLICATIONS DENIED
3
$185,487
17
$241,129
3
$112,650
0
$0
5
$168,764
APPLICATIONS WITHDRAWN
1
$308,680
6
$278,385
1
$185,490
0
$0
1
$207,500
FILES CLOSED FOR INCOMPLETENESS
0
$0
3
$258,010
0
$0
0
$0
0
$0
Aggregated Statistics For Year 2006 (Based on 4 partial tracts)
A) FHA, FSA/RHS & VA Home Purchase Loans
B) Conventional Home Purchase Loans
C) Refinancings
D) Home Improvement Loans
F) Non-occupant Loans on < 5 Family Dwellings (A B C & D)
G) Loans On Manufactured Home Dwelling (A B C & D)
Number
Average Value
Number
Average Value
Number
Average Value
Number
Average Value
Number
Average Value
Number
Average Value
LOANS ORIGINATED
1
$305,400
11
$207,267
25
$211,192
4
$117,628
3
$230,687
8
$183,086
APPLICATIONS APPROVED, NOT ACCEPTED
0
$0
3
$154,027
7
$224,230
0
$0
1
$153,400
1
$193,220
APPLICATIONS DENIED
0
$0
8
$185,750
26
$241,460
5
$131,480
2
$161,130
7
$179,230
APPLICATIONS WITHDRAWN
0
$0
5
$160,520
14
$242,648
2
$75,295
0
$0
2
$172,725
FILES CLOSED FOR INCOMPLETENESS
0
$0
0
$0
4
$208,908
0
$0
0
$0
1
$141,460
Aggregated Statistics For Year 2005 (Based on 4 partial tracts)
B) Conventional Home Purchase Loans
C) Refinancings
D) Home Improvement Loans
F) Non-occupant Loans on < 5 Family Dwellings (A B C & D)
G) Loans On Manufactured Home Dwelling (A B C & D)
Number
Average Value
Number
Average Value
Number
Average Value
Number
Average Value
Number
Average Value
LOANS ORIGINATED
19
$191,785
31
$184,565
6
$116,943
4
$190,462
10
$166,493
APPLICATIONS APPROVED, NOT ACCEPTED
3
$225,847
7
$167,219
0
$0
1
$250,830
3
$126,860
APPLICATIONS DENIED
6
$191,225
19
$174,122
4
$110,132
1
$236,780
7
$110,441
APPLICATIONS WITHDRAWN
5
$152,464
13
$147,564
0
$0
0
$0
5
$117,756
FILES CLOSED FOR INCOMPLETENESS
1
$132,090
5
$185,440
0
$0
0
$0
2
$126,235
Aggregated Statistics For Year 2004 (Based on 4 partial tracts)
B) Conventional Home Purchase Loans
C) Refinancings
D) Home Improvement Loans
F) Non-occupant Loans on < 5 Family Dwellings (A B C & D)
G) Loans On Manufactured Home Dwelling (A B C & D)
Number
Average Value
Number
Average Value
Number
Average Value
Number
Average Value
Number
Average Value
LOANS ORIGINATED
13
$145,276
30
$152,269
5
$121,784
5
$138,880
8
$131,884
APPLICATIONS APPROVED, NOT ACCEPTED
1
$175,180
9
$136,200
0
$0
1
$57,380
2
$108,200
APPLICATIONS DENIED
8
$149,156
25
$155,115
4
$86,888
1
$155,980
10
$151,504
APPLICATIONS WITHDRAWN
4
$133,378
12
$142,569
1
$48,710
1
$199,770
2
$94,735
FILES CLOSED FOR INCOMPLETENESS
0
$0
3
$133,573
0
$0
0
$0
0
$0
Aggregated Statistics For Year 2003 (Based on 4 partial tracts)
A) FHA, FSA/RHS & VA Home Purchase Loans
B) Conventional Home Purchase Loans
C) Refinancings
D) Home Improvement Loans
F) Non-occupant Loans on < 5 Family Dwellings (A B C & D)
Number
Average Value
Number
Average Value
Number
Average Value
Number
Average Value
Number
Average Value
LOANS ORIGINATED
1
$94,150
7
$159,926
35
$130,603
1
$54,330
4
$111,128
APPLICATIONS APPROVED, NOT ACCEPTED
0
$0
2
$108,550
6
$136,343
1
$46,840
1
$132,790
APPLICATIONS DENIED
0
$0
3
$144,347
15
$137,038
2
$31,385
1
$95,320
APPLICATIONS WITHDRAWN
0
$0
1
$189,230
10
$130,285
0
$0
0
$0
FILES CLOSED FOR INCOMPLETENESS
0
$0
0
$0
3
$94,773
0
$0
0
$0
Aggregated Statistics For Year 2002 (Based on 4 partial tracts)
A) FHA, FSA/RHS & VA Home Purchase Loans
B) Conventional Home Purchase Loans
C) Refinancings
F) Non-occupant Loans on < 5 Family Dwellings (A B C & D)
Number
Average Value
Number
Average Value
Number
Average Value
Number
Average Value
LOANS ORIGINATED
1
$187,360
13
$106,777
22
$124,456
3
$83,297
APPLICATIONS APPROVED, NOT ACCEPTED
0
$0
1
$89,460
3
$108,357
0
$0
APPLICATIONS DENIED
0
$0
3
$78,847
11
$101,665
1
$105,620
APPLICATIONS WITHDRAWN
0
$0
2
$118,620
9
$115,591
1
$163,000
FILES CLOSED FOR INCOMPLETENESS
0
$0
0
$0
1
$183,380
0
$0
Aggregated Statistics For Year 2001 (Based on 4 partial tracts)
A) FHA, FSA/RHS & VA Home Purchase Loans
B) Conventional Home Purchase Loans
C) Refinancings
D) Home Improvement Loans
F) Non-occupant Loans on < 5 Family Dwellings (A B C & D)
Number
Average Value
Number
Average Value
Number
Average Value
Number
Average Value
Number
Average Value
LOANS ORIGINATED
1
$168,390
7
$108,501
18
$104,961
0
$0
3
$118,193
APPLICATIONS APPROVED, NOT ACCEPTED
0
$0
1
$112,420
2
$95,555
0
$0
0
$0
APPLICATIONS DENIED
0
$0
2
$97,075
9
$126,130
1
$42,620
1
$39,350
APPLICATIONS WITHDRAWN
0
$0
1
$57,610
4
$108,142
0
$0
0
$0
FILES CLOSED FOR INCOMPLETENESS
0
$0
0
$0
0
$0
0
$0
0
$0
Aggregated Statistics For Year 2000 (Based on 4 partial tracts)
A) FHA, FSA/RHS & VA Home Purchase Loans
B) Conventional Home Purchase Loans
C) Refinancings
D) Home Improvement Loans
F) Non-occupant Loans on < 5 Family Dwellings (A B C & D)
Number
Average Value
Number
Average Value
Number
Average Value
Number
Average Value
Number
Average Value
LOANS ORIGINATED
3
$78,223
8
$97,251
6
$103,087
1
$30,210
2
$65,810
APPLICATIONS APPROVED, NOT ACCEPTED
0
$0
1
$140,290
2
$79,275
1
$77,290
0
$0
APPLICATIONS DENIED
0
$0
4
$86,245
7
$115,527
2
$20,960
0
$0
APPLICATIONS WITHDRAWN
0
$0
1
$178,930
3
$111,637
0
$0
0
$0
FILES CLOSED FOR INCOMPLETENESS
0
$0
0
$0
0
$0
0
$0
0
$0
Aggregated Statistics For Year 1999 (Based on 2 partial tracts)
A) FHA, FSA/RHS & VA Home Purchase Loans
B) Conventional Home Purchase Loans
C) Refinancings
D) Home Improvement Loans
F) Non-occupant Loans on < 5 Family Dwellings (A B C & D)
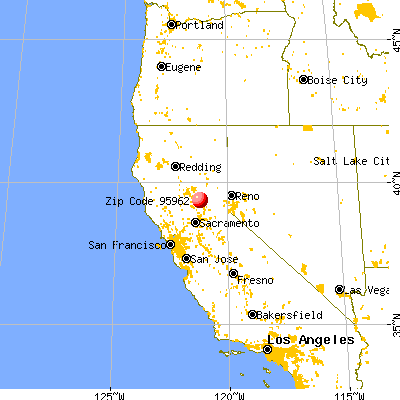


 Nearest zip codes: 95935, 95918, 95919, 95914, 95946, 95925.