Estimated zip code population in 2022: 5,796 Zip code population in 2010: 5,975 Zip code population in 2000: 6,178
Houses and condos: 2,032 Renter-occupied apartments: 383
% of renters here:
20%
State:
44%
March 2022 cost of living index in zip code 95626: 100.7 (near average, U.S. average is 100)
Land area: 23.3 sq. mi. Water area: 0.0 sq. mi.
Population density: 249 people per square mile
(very low).
OSM Map
General Map
Google Map
MSN Map
OSM Map
General Map
Google Map
MSN Map
OSM Map
General Map
Google Map
MSN Map
OSM Map
General Map
Google Map
MSN Map
Please wait while loading the map...
Real estate property taxes paid for housing units in 2022:
This zip code:
0.6% ($2,752)
California:
0.7% ($4,831)
Median real estate property taxes paid for housing units with mortgages in 2022: $2,950 (0.6%) Median real estate property taxes paid for housing units with no mortgage in 2022: $2,064 (0.5%)
Business Search- 14 Million verified businesses
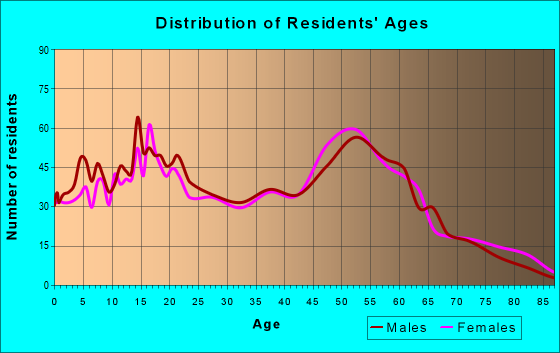
Males: 2,966
(51.2%)
Females: 2,829
(48.8%)
For population 25 years and over in 95626:
High school or higher: 90.7%
Bachelor's degree or higher: 13.6%
Graduate or professional degree: 3.7%
Unemployed: 3.1%
Mean travel time to work (commute): 29.9 minutes
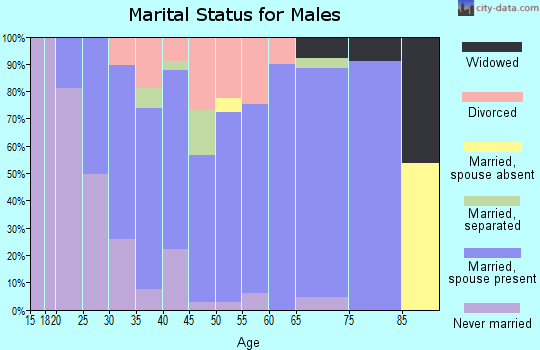
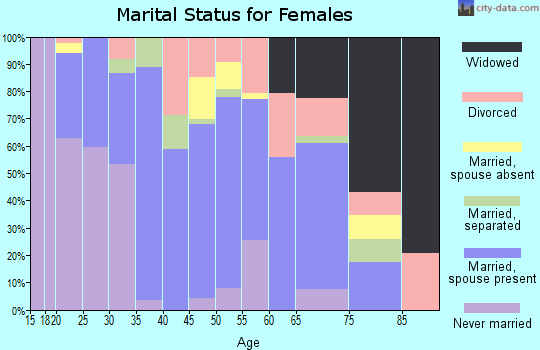
For population 15 years and over in 95626:
Never married: 29.1%
Now married: 51.4%
Separated: 2.7%
Widowed: 3.9%
Divorced: 13.0%
Zip code 95626 compared to state average:
Unemployed percentage below state average.
Hispanic race population percentage below state average.
Median age above state average.
Foreign-born population percentage significantly below state average.
Renting percentage below state average.
Length of stay since moving in significantly above state average.
Percentage of population with a bachelor's degree or higher significantly below state average.
Estimated median house/condo value in 2022: $493,084
95626:
$493,084
California:
$715,900
According to our research of California and other state lists, there were 8 registered sex offenders living in 95626 zip code as of July 04, 2024. The ratio of all residents to sex offenders in zip code 95626 is 744 to 1. The ratio of registered sex offenders to all residents in this zip code is near the state average.
Median resident age:
This zip code:
45.3 years
California median age:
37.9 years
Average household size:
This zip code:
3.0 people
California:
2.8 people
Averages for the 2020 tax year for zip code 95626, filed in 2021:
Average Adjusted Gross Income (AGI) in 2020: $64,459 (Individual Income Tax Returns)
Here:
$64,459
State:
$95,910
Salary/wage: $55,432 (reported on 77.5% of returns)
Here:
$55,432
State:
$77,331
(% of AGI for various income ranges: 1240.4% for AGIs below $25k, 3627.1% for AGIs $25k-50k, 6194.7% for AGIs $50k-75k, 10535.0% for AGIs $75k-100k, 17419.6% for AGIs $100k-200k, 69740.0% for AGIs over 200k)
Taxable interest for individuals: $723 (reported on 40.4% of returns)
This zip code:
$723
California:
$2,294
(% of AGI for various income ranges: 14.2% for AGIs below $25k, 20.0% for AGIs $25k-50k, 54.7% for AGIs $50k-75k, 60.0% for AGIs $75k-100k, 91.9% for AGIs $100k-200k, 660.0% for AGIs over 200k)
Ordinary dividends: $3,138 (reported on 13.7% of returns)
Here:
$3,138
State:
$10,949
(% of AGI for various income ranges: 25.4% for AGIs below $25k, 25.8% for AGIs $25k-50k, 60.0% for AGIs $50k-75k, 82.2% for AGIs $75k-100k, 135.0% for AGIs $100k-200k, 1320.0% for AGIs over 200k)
Net capital gain/loss in AGI: +$12,024 (reported on 13.3% of returns)
Here:
+$12,024
State:
+$49,306
(% of AGI for various income ranges: 3.2% for AGIs below $25k, 15.6% for AGIs $25k-50k, 93.8% for AGIs $50k-75k, 121.7% for AGIs $75k-100k, 432.7% for AGIs $100k-200k, 14160.0% for AGIs over 200k)
Profit/loss from business: +$12,194 (reported on 16.8% of returns)
Here:
+$12,194
State:
+$15,671
(% of AGI for various income ranges: 145.6% for AGIs below $25k, 218.3% for AGIs $25k-50k, 365.6% for AGIs $50k-75k, 476.1% for AGIs $75k-100k, 749.2% for AGIs $100k-200k)
Taxable individual retirement arrangement distribution: $16,700 (reported on 6.7% of returns)
95626:
$16,700
California:
$23,505
(% of AGI for various income ranges: 48.1% for AGIs below $25k, 55.4% for AGIs $25k-50k, 187.8% for AGIs $50k-75k, 253.3% for AGIs $75k-100k, 606.2% for AGIs $100k-200k)
Total itemized deductions: $29,786 (reported on 13.0% of returns)
Here:
$29,786
State:
$39,517
(% of AGI for various income ranges: 272.7% for AGIs $25k-50k, 458.1% for AGIs $50k-75k, 996.1% for AGIs $75k-100k, 1670.0% for AGIs $100k-200k, 10555.0% for AGIs over 200k)
Charity contributions: $6,026 (reported on 9.5% of returns)
Here:
$6,026
State:
$12,598
(% of AGI for various income ranges: 15.4% for AGIs $25k-50k, 40.0% for AGIs $50k-75k, 150.0% for AGIs $75k-100k, 300.4% for AGIs $100k-200k, 1870.0% for AGIs over 200k)
Taxes paid: $7,828 (reported on 12.6% of returns)
95626:
$7,828
State:
$8,807
(% of AGI for various income ranges: 48.5% for AGIs $25k-50k, 120.9% for AGIs $50k-75k, 286.7% for AGIs $75k-100k, 498.1% for AGIs $100k-200k, 1935.0% for AGIs over 200k)
Earned income credit: $2,027 (reported on 14.4% of returns)
Here:
$2,027
State:
$2,074
(% of AGI for various income ranges: 80.9% for AGIs below $25k, 77.1% for AGIs $25k-50k)
Percentage of individuals using paid preparers for their 2020 taxes: 91.9%
Here:
92%
State:
92%
(% for various income ranges: 91.8% for AGIs below $25k, 92.4% for AGIs $25k-50k, 91.5% for AGIs $50k-75k, 90.3% for AGIs $75k-100k, 91.7% for AGIs $100k-200k, 100.0% for AGIs over 200k)
Averages for the 2012 tax year for zip code 95626, filed in 2013:
Average Adjusted Gross Income (AGI) in 2012: $50,589 (Individual Income Tax Returns)
Here:
$50,589
State:
$72,726
Salary/wage: $44,359 (reported on 80.5% of returns)
Here:
$44,359
State:
$59,079
(% of AGI for various income ranges: 66.0% for AGIs below $25k, 71.7% for AGIs $25k-50k, 72.9% for AGIs $50k-75k, 77.5% for AGIs $75k-100k, 74.0% for AGIs $100k-200k, 41.2% for AGIs over 200k)
Taxable interest for individuals: $835 (reported on 39.1% of returns)
This zip code:
$835
California:
$2,146
(% of AGI for various income ranges: 1.3% for AGIs below $25k, 0.5% for AGIs $25k-50k, 0.3% for AGIs $50k-75k, 0.3% for AGIs $75k-100k, 1.2% for AGIs $100k-200k)
Ordinary dividends: $2,191 (reported on 13.7% of returns)
Here:
$2,191
State:
$9,308
(% of AGI for various income ranges: 0.6% for AGIs below $25k, 0.7% for AGIs $25k-50k, 0.7% for AGIs $50k-75k, 0.3% for AGIs $75k-100k, 0.8% for AGIs $100k-200k)
Net capital gain/loss in AGI: +$10,417 (reported on 9.0% of returns)
Here:
+$10,417
State:
+$30,460
(% of AGI for various income ranges: 6.3% for AGIs $100k-200k)
Profit/loss from business: +$10,756 (reported on 17.6% of returns)
Here:
+$10,756
State:
+$17,064
(% of AGI for various income ranges: 14.0% for AGIs below $25k, 5.8% for AGIs $25k-50k, 1.3% for AGIs $50k-75k, 1.5% for AGIs $75k-100k, 2.8% for AGIs $100k-200k)
Taxable individual retirement arrangement distribution: $13,390 (reported on 8.2% of returns)
95626:
$13,390
California:
$19,557
(% of AGI for various income ranges: 2.4% for AGIs below $25k, 1.9% for AGIs $25k-50k, 2.6% for AGIs $50k-75k, 1.4% for AGIs $75k-100k, 3.0% for AGIs $100k-200k)
Total itemized deductions: $21,593 (25% of AGI, reported on 35.2% of returns)
Here:
$21,593
State:
$34,004
Here:
25.1% of AGI
State:
22.7% of AGI
(% of AGI for various income ranges: 10.4% for AGIs below $25k, 11.8% for AGIs $25k-50k, 15.3% for AGIs $50k-75k, 15.1% for AGIs $75k-100k, 19.3% for AGIs $100k-200k, 11.0% for AGIs over 200k)
Charity contributions: $2,839 (reported on 28.9% of returns)
Here:
$2,839
State:
$4,659
(% of AGI for various income ranges: 0.6% for AGIs below $25k, 1.3% for AGIs $25k-50k, 1.6% for AGIs $50k-75k, 1.6% for AGIs $75k-100k, 2.6% for AGIs $100k-200k)
Taxes paid: $6,333 (reported on 34.8% of returns)
95626:
$6,333
State:
$14,448
(% of AGI for various income ranges: 1.4% for AGIs below $25k, 2.3% for AGIs $25k-50k, 3.6% for AGIs $50k-75k, 4.6% for AGIs $75k-100k, 6.6% for AGIs $100k-200k, 5.5% for AGIs over 200k)
Earned income credit: $2,298 (reported on 19.9% of returns)
Here:
$2,298
State:
$2,286
(% of AGI for various income ranges: 6.8% for AGIs below $25k, 1.3% for AGIs $25k-50k)
Percentage of individuals using paid preparers for their 2012 taxes: 54.3%
Here:
54%
State:
64%
(% for various income ranges: 48.5% for AGIs below $25k, 55.4% for AGIs $25k-50k, 61.5% for AGIs $50k-75k, 54.2% for AGIs $75k-100k, 58.6% for AGIs $100k-200k, 100.0% for AGIs over 200k)
Averages for the 2004 tax year for zip code 95626, filed in 2005:
Average Adjusted Gross Income (AGI) in 2004: $44,920 (Individual Income Tax Returns)
Here:
$44,920
State:
$58,600
Salary/wage: $40,371 (reported on 86.0% of returns)
Here:
$40,371
State:
$49,455
(% of AGI for various income ranges: 106.4% for AGIs below $10k, 75.1% for AGIs $10k-25k, 81.5% for AGIs $25k-50k, 81.3% for AGIs $50k-75k, 83.3% for AGIs $75k-100k, 66.1% for AGIs over 100k)
Taxable interest for individuals: $1,050 (reported on 48.9% of returns)
This zip code:
$1,050
California:
$2,365
(% of AGI for various income ranges: 1.8% for AGIs below $10k, 1.7% for AGIs $10k-25k, 1.2% for AGIs $25k-50k, 0.6% for AGIs $50k-75k, 1.0% for AGIs $75k-100k, 1.4% for AGIs over 100k)
Taxable dividends: $1,156 (reported on 15.3% of returns)
Here:
$1,156
State:
$4,746
(% of AGI for various income ranges: 0.6% for AGIs below $10k, 0.9% for AGIs $10k-25k, 0.4% for AGIs $25k-50k, 0.5% for AGIs $50k-75k, 0.1% for AGIs $75k-100k, 0.3% for AGIs over 100k)
Net capital gain/loss: +$10,065 (reported on 13.1% of returns)
Here:
+$10,065
State:
+$23,418
(% of AGI for various income ranges: -1.3% for AGIs below $10k, -0.1% for AGIs $10k-25k, -0.1% for AGIs $25k-50k, -0.2% for AGIs $50k-75k, 1.7% for AGIs $75k-100k, 9.8% for AGIs over 100k)
Profit/loss from business: +$12,186 (reported on 17.0% of returns)
Here:
+$12,186
State:
+$16,826
(% of AGI for various income ranges: 4.1% for AGIs below $10k, 8.2% for AGIs $10k-25k, 4.1% for AGIs $25k-50k, 2.8% for AGIs $50k-75k, 2.1% for AGIs $75k-100k, 7.0% for AGIs over 100k)
IRA payment deduction: $3,255 (reported on 2.1% of returns)
95626:
$3,255
California:
$3,192
Self-employed pension: $5,750 (reported on 0.5% of returns)
Here:
$5,750
California:
$17,688
Total itemized deductions: $19,750 (28% of AGI, reported on 42.8% of returns)
Here:
$19,750
State:
$28,113
Here:
27.5% of AGI
State:
25.3% of AGI
(% of AGI for various income ranges: 15.2% for AGIs below $10k, 17.1% for AGIs $10k-25k, 17.6% for AGIs $25k-50k, 19.6% for AGIs $50k-75k, 22.1% for AGIs $75k-100k, 17.6% for AGIs over 100k)
Charity contributions deductions: $2,720 (4% of AGI, reported on 37.2% of returns)
Here:
$2,720
State:
$3,923
Here:
3.6% of AGI
State:
3.3% of AGI
(% of AGI for various income ranges: 0.8% for AGIs below $10k, 1.4% for AGIs $10k-25k, 1.9% for AGIs $25k-50k, 2.2% for AGIs $50k-75k, 2.6% for AGIs $75k-100k, 2.7% for AGIs over 100k)
Total tax: $5,608 (reported on 77.0% of returns)
95626:
$5,608
State:
$10,761
(% of AGI for various income ranges: 3.5% for AGIs below $10k, 4.8% for AGIs $10k-25k, 6.4% for AGIs $25k-50k, 8.0% for AGIs $50k-75k, 9.5% for AGIs $75k-100k, 15.2% for AGIs over 100k)
Earned income credit: $1,709 (reported on 15.1% of returns)
Here:
$1,709
State:
$1,763
Percentage of individuals using paid preparers for their 2004 taxes: 58.5%
Here:
59%
State:
66%
(% for various income ranges: 46.0% for AGIs below $10k, 60.7% for AGIs $10k-25k, 63.2% for AGIs $25k-50k, 57.2% for AGIs $50k-75k, 61.5% for AGIs $75k-100k, 61.0% for AGIs over 100k)
Household received Food Stamps/SNAP in the past 12 months: 245 Household did not receive Food Stamps/SNAP in the past 12 months: 1,698
Women who had a birth in the past 12 months: 48 (41 now married, 7 unmarried) Women who did not have a birth in the past 12 months: 1,100 (474 now married, 623 unmarried)
Housing units in zip code 95626 with a mortgage: 1,142 (44 second mortgage, 4 home equity loan, 37 both second mortgage and home equity loan) Houses without a mortgage: 9
Median monthly owner costs for units with a mortgage: $2,382 Median monthly owner costs for units without a mortgage: $583
Residents with income below the poverty level in 2022:
This zip code:
10.2%
Whole state:
12.2%
Residents with income below 50% of the poverty level in 2022:
This zip code:
4.2%
Whole state:
6.2%
Median number of rooms in houses and condos:
Here:
5.8
State:
6.0
Median number of rooms in apartments:
Here:
5.0
State:
3.9
Notable locations in this zip code not listed on our city pages
Notable locations in zip code 95626: Elverta Switchyard (A), Cherry Island Golf Course (B), Sacramento Metropolitan Fire District Station 117 (C), Sacramento Metropolitan Fire District Station 116 (D). Display/hide their locations on the map
Churches in zip code 95626 include: Apostolic Faith Church (A), Elverta United Methodist Church (B), Family Gospel Center (C). Display/hide their locations on the map
In group quarters: 55 (-1 institutionalized population)
Size of family households: 616 2-persons, 359 3-persons, 272 4-persons, 212 5-persons, 32 6-persons, 71 7-or-more-persons
Size of nonfamily households: 292 1-person, 80 2-persons
740 married couples with children.
164 single-parent households (107 men, 57 women).
84.7% of residents of 95626 zip code speak English at home.
4.6% of residents speak Spanish at home (55% very well, 29% well, 6% not well, 11% not at all).
5.3% of residents speak other Indo-European language at home (43% very well, 38% well, 20% not well).
4.6% of residents speak Asian or Pacific Island language at home (88% very well, 3% well, 9% not well).
0.1% of residents speak other language at home (57% very well, 43% well).
Foreign born population: 467 (8.1%) (81.2% of them are naturalized citizens)
This zip code:
8.1%
Whole state:
26.7%
27%Honduras
25%Romania
12%Serbia
8%Italy
8%Portugal
6%Indonesia
5%Albania
8%American
6%English
4%German
3%Italian
3%Russian
2%European
2%Irish
Year of entry for the foreign-born population
312010 or later
2362000 to 2009
971990 to 1999
142Before 1990
Facilities with environmental interests located in this zip code:
ALPHA TECHNOLOGY (8920 ELWYN AVE. in ELVERTA, CA)
(National Center for Education Statistics) - STATE ID-6033120 Organizations: ELVERTA JOINT ELEMENTARY (SCHOOL DISTRICT)
ELVERTA ELEMENTARY (7900 ELOISE AVE. in ELVERTA, CA)
(National Center for Education Statistics) - STATE ID-6033138 Organizations: ELVERTA JOINT ELEMENTARY (SCHOOL DISTRICT)
MCI TELECOMMUNICATIONS (3387 RIEGO RD in ELVERTA, CA)
Small Quantity Generators, between 100 kg and 1000 kg of hazardous waste/month (Resource Conservation and Recovery Act (tracking hazardous waste)) - notification Organizations: MCIT COMMUNICATIONS (CONTACT/OWNER)
MONROE'S LANDFILL (8784 N PALLADAY RD in ELVERTA, CA)
CRITERIA AND HAZARDOUS AIR POLLUTANT INVENTORY (Inventory of air pollution sources) Business SIC classification: REFUSE SYSTEMS Business NAICS classification: SOLID WASTE LANDFILL.
Housing units lacking complete plumbing facilities: 0.7% Housing units lacking complete kitchen facilities: 0.7%
50.1%Electricity
34.1%Utility gas
6.7%Bottled, tank, or LP gas
4.9%Solar energy
2.7%Wood
1.4%Fuel oil, kerosene, etc.
Population in 1990: 6,154. Population change in the 1990s: +24 (+0.4%).
Place of birth for U.S.-born residents:
This state: 4,199
Northeast: 121
Midwest: 288
South: 340
West: 310
65% of the 95626 zip code residents lived in the same house 5 years ago. Out of people who lived in different houses, 62% lived in this county. Out of people who lived in different counties, 50% lived in California.
98% of the 95626 zip code residents lived in the same house 1 year ago. Out of people who lived in different houses, 89% moved from this county. Out of people who lived in different houses, 25% moved from different county within same state.
Private vs. public school enrollment:
Students in private schools in grades 1 to 8 (elementary and middle school): 9
Here:
1.7%
California:
10.5%
Students in private schools in grades 9 to 12 (high school): 3
Here:
1.1%
California:
8.5%
Students in private undergraduate colleges: 66
Here:
26.4%
California:
15.9%
Occupation by median earnings in the past 12 months ($)
133,025Health diagnosing and treating practitioners and other technical occupations
115,796Law enforcement workers including supervisors
107,482Fire fighting and prevention, and other protective service workers including supervisors
93,442Installation, maintenance, and repair occupations
77,395Management occupations
70,112Production occupations
Companies with federal contracts located in this zip code:
ATLANTIC PACIFIC ENVIRONM (8846 PALLADAY RD in ELVERTA, CA; small business) : $15,005 in 4 contractsfrom 2005 to 2006
$9,141 with Army for Other Professional Services. Signed on 2006-03-24. Completion date: 2006-04-10.
$5,721 with Army for Laboratory Testing Services. Signed on 2005-07-16. Completion date: 2005-07-30.
$150, same as above.Signed on 2005-10-24. Completion date: 2005-10-31.
-$7 with Army for Other Professional Services. Signed on 2006-06-13. Completion date: 2006-05-15.
Top industries in this zip code by the number of employees in 2005:
Construction: Poured Concrete Foundation and Structure Contractors (20-49 employees: 1 establishment, 1-4 employees: 2 establishments)
Construction: Electrical Contractors (20-49: 1)
Construction: Painting and Wall Covering Contractors (20-49: 1)
Construction: Drywall and Insulation Contractors (10-19: 1)
Construction: Highway, Street, and Bridge Construction (10-19: 1)
Construction: All Other Specialty Trade Contractors (10-19: 1)
Construction: Framing Contractors (10-19: 1)
Other Services (except Public Administration): Commercial and Industrial Machinery and Equipment (except Automotive and Electronic) Repair and Maintenance (5-9: 1, 1-4: 1)
People in group quarters in 2010:
22 people in workers' group living quarters and job corps centers
People in group quarters in 2000:
12 people in other nonhousehold living situations
5 people in homes for the mentally retarded
Fatal accident statistics in 2014:
Fatal accident count: 2
Vehicles involved in fatal accidents: 3
Fatal accidents caused by drunken drivers: 0
Fatalities: 2
Persons involved in fatal accidents: 4
Pedestrians involved in fatal accidents: 1
Fatal accident statistics in 2012:
Fatal accident count: 2
Vehicles involved in fatal accidents: 3
Fatal accidents caused by drunken drivers: 1
Fatalities: 2
Persons involved in fatal accidents: 4
Pedestrians involved in fatal accidents: 1
Home Mortgage Disclosure Act Aggregated Statistics For Year 2009 (Based on 6 partial tracts)
A) FHA, FSA/RHS & VA Home Purchase Loans
B) Conventional Home Purchase Loans
C) Refinancings
D) Home Improvement Loans
F) Non-occupant Loans on < 5 Family Dwellings (A B C & D)
G) Loans On Manufactured Home Dwelling (A B C & D)
Number
Average Value
Number
Average Value
Number
Average Value
Number
Average Value
Number
Average Value
Number
Average Value
LOANS ORIGINATED
182
$201,775
153
$175,171
313
$210,104
7
$55,433
54
$150,691
6
$272,475
APPLICATIONS APPROVED, NOT ACCEPTED
19
$173,259
20
$199,538
43
$231,436
2
$25,830
6
$197,407
1
$255,480
APPLICATIONS DENIED
30
$215,492
44
$204,092
146
$244,356
14
$46,651
19
$238,795
0
$0
APPLICATIONS WITHDRAWN
22
$241,608
23
$179,550
109
$229,010
5
$97,410
10
$147,062
0
$0
FILES CLOSED FOR INCOMPLETENESS
3
$192,720
7
$191,346
14
$253,720
0
$0
1
$261,580
2
$247,450
Aggregated Statistics For Year 2008 (Based on 6 partial tracts)
A) FHA, FSA/RHS & VA Home Purchase Loans
B) Conventional Home Purchase Loans
C) Refinancings
D) Home Improvement Loans
E) Loans on Dwellings For 5+ Families
F) Non-occupant Loans on < 5 Family Dwellings (A B C & D)
G) Loans On Manufactured Home Dwelling (A B C & D)
Number
Average Value
Number
Average Value
Number
Average Value
Number
Average Value
Number
Average Value
Number
Average Value
Number
Average Value
LOANS ORIGINATED
154
$232,330
224
$201,094
205
$212,862
34
$117,570
0
$0
56
$174,554
3
$137,163
APPLICATIONS APPROVED, NOT ACCEPTED
14
$232,796
39
$221,618
48
$217,502
4
$140,588
0
$0
11
$191,749
0
$0
APPLICATIONS DENIED
38
$221,327
81
$225,639
270
$273,288
45
$96,115
1
$266,380
31
$181,560
4
$367,522
APPLICATIONS WITHDRAWN
28
$254,352
41
$227,534
97
$243,377
12
$164,481
0
$0
9
$218,592
2
$153,400
FILES CLOSED FOR INCOMPLETENESS
6
$210,025
11
$252,275
20
$242,307
2
$386,770
0
$0
2
$162,135
0
$0
Aggregated Statistics For Year 2007 (Based on 6 partial tracts)
A) FHA, FSA/RHS & VA Home Purchase Loans
B) Conventional Home Purchase Loans
C) Refinancings
D) Home Improvement Loans
F) Non-occupant Loans on < 5 Family Dwellings (A B C & D)
G) Loans On Manufactured Home Dwelling (A B C & D)
Number
Average Value
Number
Average Value
Number
Average Value
Number
Average Value
Number
Average Value
Number
Average Value
LOANS ORIGINATED
12
$280,462
352
$235,412
547
$245,802
80
$147,950
85
$237,706
3
$46,323
APPLICATIONS APPROVED, NOT ACCEPTED
3
$326,007
71
$233,472
142
$268,588
19
$123,957
22
$241,981
0
$0
APPLICATIONS DENIED
5
$299,648
183
$245,249
475
$288,118
96
$146,410
42
$248,297
3
$211,210
APPLICATIONS WITHDRAWN
4
$275,148
76
$244,591
214
$269,535
27
$167,145
15
$218,257
5
$147,556
FILES CLOSED FOR INCOMPLETENESS
0
$0
24
$233,660
55
$301,625
3
$127,557
4
$235,470
0
$0
Aggregated Statistics For Year 2006 (Based on 6 partial tracts)
A) FHA, FSA/RHS & VA Home Purchase Loans
B) Conventional Home Purchase Loans
C) Refinancings
D) Home Improvement Loans
F) Non-occupant Loans on < 5 Family Dwellings (A B C & D)
G) Loans On Manufactured Home Dwelling (A B C & D)
Number
Average Value
Number
Average Value
Number
Average Value
Number
Average Value
Number
Average Value
Number
Average Value
LOANS ORIGINATED
4
$313,355
682
$238,534
933
$255,470
165
$159,484
121
$243,879
9
$321,043
APPLICATIONS APPROVED, NOT ACCEPTED
1
$320,860
136
$256,205
215
$264,813
36
$153,658
33
$239,758
2
$356,110
APPLICATIONS DENIED
0
$0
275
$270,181
507
$281,165
124
$160,747
58
$246,193
8
$187,860
APPLICATIONS WITHDRAWN
0
$0
143
$266,330
329
$276,528
38
$170,844
26
$240,107
1
$226,350
FILES CLOSED FOR INCOMPLETENESS
1
$320,860
48
$280,481
79
$309,550
5
$244,716
5
$311,580
1
$273,640
Aggregated Statistics For Year 2005 (Based on 6 partial tracts)
A) FHA, FSA/RHS & VA Home Purchase Loans
B) Conventional Home Purchase Loans
C) Refinancings
D) Home Improvement Loans
E) Loans on Dwellings For 5+ Families
F) Non-occupant Loans on < 5 Family Dwellings (A B C & D)
G) Loans On Manufactured Home Dwelling (A B C & D)
Number
Average Value
Number
Average Value
Number
Average Value
Number
Average Value
Number
Average Value
Number
Average Value
Number
Average Value
LOANS ORIGINATED
2
$298,860
1,197
$243,804
1,316
$259,447
198
$176,068
1
$554,550
167
$252,238
23
$257,776
APPLICATIONS APPROVED, NOT ACCEPTED
0
$0
199
$245,641
198
$283,538
34
$146,407
0
$0
32
$214,673
4
$152,102
APPLICATIONS DENIED
2
$233,235
295
$256,657
512
$277,704
103
$137,762
0
$0
54
$261,931
21
$259,839
APPLICATIONS WITHDRAWN
1
$206,330
242
$244,591
410
$251,849
52
$184,907
0
$0
38
$234,814
4
$248,218
FILES CLOSED FOR INCOMPLETENESS
0
$0
45
$266,065
142
$275,435
7
$128,621
0
$0
8
$334,535
5
$212,570
Aggregated Statistics For Year 2004 (Based on 6 partial tracts)
A) FHA, FSA/RHS & VA Home Purchase Loans
B) Conventional Home Purchase Loans
C) Refinancings
D) Home Improvement Loans
E) Loans on Dwellings For 5+ Families
F) Non-occupant Loans on < 5 Family Dwellings (A B C & D)
G) Loans On Manufactured Home Dwelling (A B C & D)
Number
Average Value
Number
Average Value
Number
Average Value
Number
Average Value
Number
Average Value
Number
Average Value
Number
Average Value
LOANS ORIGINATED
13
$239,775
951
$226,774
1,222
$216,889
163
$128,004
0
$0
168
$209,225
17
$170,985
APPLICATIONS APPROVED, NOT ACCEPTED
3
$179,907
160
$233,556
203
$215,810
20
$72,388
1
$496,430
21
$230,441
7
$196,773
APPLICATIONS DENIED
7
$218,234
228
$227,063
463
$216,752
87
$84,099
0
$0
41
$212,768
9
$164,349
APPLICATIONS WITHDRAWN
1
$236,600
182
$235,008
315
$213,080
30
$112,712
0
$0
20
$219,206
4
$200,882
FILES CLOSED FOR INCOMPLETENESS
0
$0
28
$231,544
189
$204,274
10
$152,879
0
$0
10
$262,782
1
$271,220
Aggregated Statistics For Year 2003 (Based on 6 partial tracts)
A) FHA, FSA/RHS & VA Home Purchase Loans
B) Conventional Home Purchase Loans
C) Refinancings
D) Home Improvement Loans
F) Non-occupant Loans on < 5 Family Dwellings (A B C & D)
Number
Average Value
Number
Average Value
Number
Average Value
Number
Average Value
Number
Average Value
LOANS ORIGINATED
82
$198,466
954
$209,224
1,491
$177,171
79
$56,289
93
$189,453
APPLICATIONS APPROVED, NOT ACCEPTED
3
$256,053
137
$210,132
226
$186,070
21
$45,752
17
$212,755
APPLICATIONS DENIED
5
$220,054
151
$205,058
472
$185,614
69
$51,303
37
$190,919
APPLICATIONS WITHDRAWN
12
$204,852
203
$215,005
401
$178,391
12
$44,518
27
$219,270
FILES CLOSED FOR INCOMPLETENESS
3
$198,160
28
$219,951
62
$182,688
3
$55,487
5
$132,164
Aggregated Statistics For Year 2002 (Based on 2 partial tracts)
A) FHA, FSA/RHS & VA Home Purchase Loans
B) Conventional Home Purchase Loans
C) Refinancings
D) Home Improvement Loans
F) Non-occupant Loans on < 5 Family Dwellings (A B C & D)
Number
Average Value
Number
Average Value
Number
Average Value
Number
Average Value
Number
Average Value
LOANS ORIGINATED
9
$255,412
335
$219,053
199
$211,757
18
$43,489
18
$218,248
APPLICATIONS APPROVED, NOT ACCEPTED
1
$290,640
39
$232,692
26
$191,190
5
$77,296
2
$267,825
APPLICATIONS DENIED
2
$260,735
35
$224,875
51
$196,945
12
$48,140
3
$224,427
APPLICATIONS WITHDRAWN
1
$332,680
54
$222,590
35
$201,933
4
$69,238
3
$238,440
FILES CLOSED FOR INCOMPLETENESS
0
$0
12
$210,976
11
$233,059
1
$25,220
0
$0
Aggregated Statistics For Year 2001 (Based on 2 partial tracts)
A) FHA, FSA/RHS & VA Home Purchase Loans
B) Conventional Home Purchase Loans
C) Refinancings
D) Home Improvement Loans
F) Non-occupant Loans on < 5 Family Dwellings (A B C & D)
Number
Average Value
Number
Average Value
Number
Average Value
Number
Average Value
Number
Average Value
LOANS ORIGINATED
9
$201,981
305
$184,723
95
$186,056
5
$26,950
10
$180,871
APPLICATIONS APPROVED, NOT ACCEPTED
0
$0
39
$180,076
14
$152,544
3
$39,073
2
$142,560
APPLICATIONS DENIED
0
$0
32
$193,924
24
$153,658
4
$29,245
1
$163,340
APPLICATIONS WITHDRAWN
2
$168,500
48
$176,292
23
$155,200
1
$29,300
2
$119,380
FILES CLOSED FOR INCOMPLETENESS
0
$0
12
$188,057
7
$157,229
2
$25,100
0
$0
Aggregated Statistics For Year 2000 (Based on 2 partial tracts)
A) FHA, FSA/RHS & VA Home Purchase Loans
B) Conventional Home Purchase Loans
C) Refinancings
D) Home Improvement Loans
F) Non-occupant Loans on < 5 Family Dwellings (A B C & D)
Number
Average Value
Number
Average Value
Number
Average Value
Number
Average Value
Number
Average Value
LOANS ORIGINATED
10
$187,140
128
$169,887
4
$207,532
3
$33,307
3
$163,737
APPLICATIONS APPROVED, NOT ACCEPTED
0
$0
15
$171,983
1
$135,950
3
$32,587
0
$0
APPLICATIONS DENIED
1
$260,860
20
$183,717
3
$57,967
2
$55,125
0
$0
APPLICATIONS WITHDRAWN
1
$225,550
33
$178,687
0
$0
0
$0
1
$189,760
FILES CLOSED FOR INCOMPLETENESS
0
$0
1
$300,730
1
$143,160
0
$0
0
$0
Aggregated Statistics For Year 1999 (Based on 2 partial tracts)
A) FHA, FSA/RHS & VA Home Purchase Loans
B) Conventional Home Purchase Loans
C) Refinancings
D) Home Improvement Loans
E) Loans on Dwellings For 5+ Families
F) Non-occupant Loans on < 5 Family Dwellings (A B C & D)
2005 - 2018 National Fire Incident Reporting System (NFIRS) incidents
According to the data from the years 2005 - 2018 the average number of fires per year is 43. The highest number of reported fires - 63 took place in 2017, and the least - 8 in 2006. The data has a declining trend.
When looking into fire subcategories, the most incidents belonged to: Outside Fires (66.7%), and Mobile Property/Vehicle Fires (16.8%).
Fire incident types reported to NFIRS in Zip Code 95626


 Nearest zip codes: 95673, 95835, 95838, 95652, 95660, 95668.


 According to the data from the years 2005 - 2018 the average number of fires per year is 43. The highest number of reported fires - 63 took place in 2017, and the least - 8 in 2006. The data has a declining trend.
 When looking into fire subcategories, the most incidents belonged to: Outside Fires (66.7%), and Mobile Property/Vehicle Fires (16.8%).