Estimated zip code population in 2022: 2,643 Zip code population in 2010: 3,494 Zip code population in 2000: 3,040
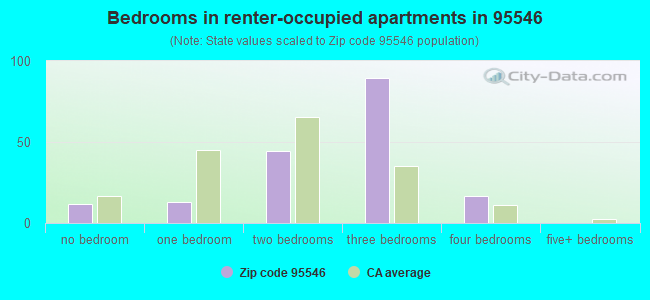
Houses and condos: 1,077 Renter-occupied apartments: 175
% of renters here:
21%
State:
44%
March 2022 cost of living index in zip code 95546: 94.8 (less than average, U.S. average is 100)
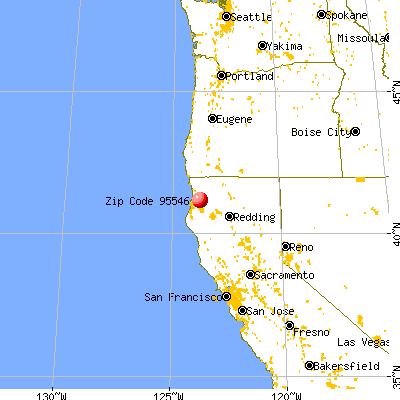
Land area: 136.5 sq. mi. Water area: 1.5 sq. mi.
Population density: 19 people per square mile
(very low).
OSM Map
General Map
Google Map
MSN Map
OSM Map
General Map
Google Map
MSN Map
OSM Map
General Map
Google Map
MSN Map
OSM Map
General Map
Google Map
MSN Map
Please wait while loading the map...
Real estate property taxes paid for housing units in 2022:
This zip code:
0.3% ($722)
California:
0.7% ($4,831)
Median real estate property taxes paid for housing units with mortgages in 2022: $946 (0.3%) Median real estate property taxes paid for housing units with no mortgage in 2022: $671 (0.3%)
Business Search- 14 Million verified businesses
Males: 1,137
(43.0%)
Females: 1,506
(57.0%)
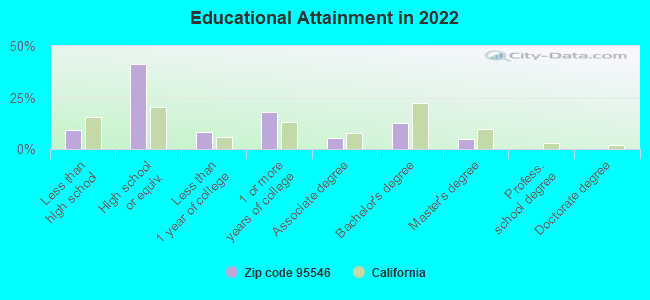
For population 25 years and over in 95546:
High school or higher: 89.6%
Bachelor's degree or higher: 17.4%
Graduate or professional degree: 5.0%
Unemployed: 15.1%
Mean travel time to work (commute): 14.7 minutes
For population 15 years and over in 95546:
Never married: 49.0%
Now married: 26.8%
Separated: 2.5%
Widowed: 6.7%
Divorced: 14.9%
Zip code 95546 compared to state average:
Median household income below state average.
Median house value significantly below state average.
Unemployed percentage above state average.
Black race population percentage significantly below state average.
Hispanic race population percentage significantly below state average.
Foreign-born population percentage significantly below state average.
Renting percentage below state average.
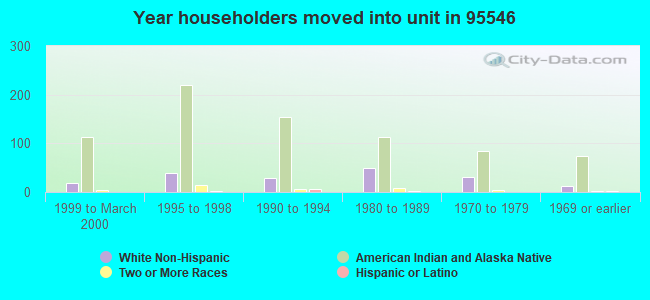
Length of stay since moving in significantly above state average.
Percentage of population with a bachelor's degree or higher significantly below state average.
Averages for the 2020 tax year for zip code 95546, filed in 2021:
Average Adjusted Gross Income (AGI) in 2020: $42,550 (Individual Income Tax Returns)
Here:
$42,550
State:
$95,910
Salary/wage: $41,754 (reported on 87.2% of returns)
Here:
$41,754
State:
$77,331
(% of AGI for various income ranges: 1590.8% for AGIs below $25k, 3718.1% for AGIs $25k-50k, 7614.5% for AGIs $50k-75k, 9931.4% for AGIs $75k-100k, 17352.0% for AGIs $100k-200k)
Taxable interest for individuals: $207 (reported on 12.8% of returns)
This zip code:
$207
California:
$2,294
(% of AGI for various income ranges: 1.2% for AGIs below $25k, 2.3% for AGIs $25k-50k, 3.6% for AGIs $50k-75k, 8.6% for AGIs $75k-100k, 18.0% for AGIs $100k-200k)
Profit/loss from business: +$5,150 (reported on 7.3% of returns)
Here:
+$5,150
State:
+$15,671
(% of AGI for various income ranges: 18.1% for AGIs below $25k, 35.8% for AGIs $25k-50k, 230.9% for AGIs $50k-75k)
Earned income credit: $2,479 (reported on 30.3% of returns)
Here:
$2,479
State:
$2,074
(% of AGI for various income ranges: 180.8% for AGIs below $25k, 112.3% for AGIs $25k-50k)
Percentage of individuals using paid preparers for their 2020 taxes: 93.6%
Here:
94%
State:
92%
(% for various income ranges: 92.3% for AGIs below $25k, 94.6% for AGIs $25k-50k, 93.8% for AGIs $50k-75k, 100.0% for AGIs $75k-100k, 87.5% for AGIs $100k-200k)
Averages for the 2012 tax year for zip code 95546, filed in 2013:
Average Adjusted Gross Income (AGI) in 2012: $33,351 (Individual Income Tax Returns)
Here:
$33,351
State:
$72,726
Salary/wage: $28,691 (reported on 92.9% of returns)
Here:
$28,691
State:
$59,079
(% of AGI for various income ranges: 88.4% for AGIs below $25k, 86.4% for AGIs $25k-50k, 84.3% for AGIs $50k-75k, 78.8% for AGIs $75k-100k, 48.8% for AGIs $100k-200k)
Taxable interest for individuals: $260 (reported on 11.8% of returns)
This zip code:
$260
California:
$2,146
(% of AGI for various income ranges: 0.2% for AGIs $50k-75k, 0.2% for AGIs $75k-100k)
Profit/loss from business: +$6,600 (reported on 10.6% of returns)
Here:
+$6,600
State:
+$17,064
(% of AGI for various income ranges: 5.5% for AGIs below $25k, 2.4% for AGIs $25k-50k, 0.9% for AGIs $50k-75k)
Total itemized deductions: $20,180 (22% of AGI, reported on 5.9% of returns)
Here:
$20,180
State:
$34,004
Here:
22.2% of AGI
State:
22.7% of AGI
Charity contributions: $1,900 (reported on 2.4% of returns)
Here:
$1,900
State:
$4,659
Taxes paid: $4,480 (reported on 5.9% of returns)
95546:
$4,480
State:
$14,448
Earned income credit: $2,568 (reported on 47.1% of returns)
Here:
$2,568
State:
$2,286
(% of AGI for various income ranges: 13.0% for AGIs below $25k, 2.9% for AGIs $25k-50k)
Percentage of individuals using paid preparers for their 2012 taxes: 58.8%
Here:
59%
State:
64%
(% for various income ranges: 53.5% for AGIs below $25k, 61.5% for AGIs $25k-50k, 77.8% for AGIs $50k-75k, 50.0% for AGIs $75k-100k, 66.7% for AGIs $100k-200k)
Averages for the 2004 tax year for zip code 95546, filed in 2005:
Average Adjusted Gross Income (AGI) in 2004: $27,602 (Individual Income Tax Returns)
Here:
$27,602
State:
$58,600
Salary/wage: $26,193 (reported on 91.6% of returns)
Here:
$26,193
State:
$49,455
(% of AGI for various income ranges: 144.5% for AGIs below $10k, 88.4% for AGIs $10k-25k, 93.7% for AGIs $25k-50k, 80.1% for AGIs $50k-75k, 69.9% for AGIs $75k-100k, 70.0% for AGIs over 100k)
Taxable interest for individuals: $356 (reported on 18.4% of returns)
This zip code:
$356
California:
$2,365
(% of AGI for various income ranges: 2.1% for AGIs below $10k, 0.3% for AGIs $10k-25k, 0.2% for AGIs $25k-50k, 0.3% for AGIs $50k-75k, 0.0% for AGIs over 100k)
Taxable dividends: $188 (reported on 2.0% of returns)
Here:
$188
State:
$4,746
Net capital gain/loss: +$250 (reported on 2.0% of returns)
Here:
+$250
State:
+$23,418
Profit/loss from business: +$5,416 (reported on 12.5% of returns)
Here:
+$5,416
State:
+$16,826
(% of AGI for various income ranges: 8.2% for AGIs below $10k, 5.1% for AGIs $10k-25k, 1.6% for AGIs $25k-50k, 2.9% for AGIs $50k-75k)
Total itemized deductions: $15,784 (18% of AGI, reported on 4.6% of returns)
Here:
$15,784
State:
$28,113
Here:
18.2% of AGI
State:
25.3% of AGI
Charity contributions deductions: $2,226 (3% of AGI, reported on 3.8% of returns)
Here:
$2,226
State:
$3,923
Here:
2.8% of AGI
State:
3.3% of AGI
Total tax: $3,681 (reported on 54.9% of returns)
95546:
$3,681
State:
$10,761
(% of AGI for various income ranges: 2.0% for AGIs below $10k, 2.6% for AGIs $10k-25k, 4.9% for AGIs $25k-50k, 10.2% for AGIs $50k-75k, 11.2% for AGIs $75k-100k, 17.3% for AGIs over 100k)
Earned income credit: $1,958 (reported on 44.1% of returns)
Here:
$1,958
State:
$1,763
Percentage of individuals using paid preparers for their 2004 taxes: 56.4%
Here:
56%
State:
66%
(% for various income ranges: 48.4% for AGIs below $10k, 62.3% for AGIs $10k-25k, 55.3% for AGIs $25k-50k, 56.7% for AGIs $50k-75k, 52.6% for AGIs $75k-100k, 66.7% for AGIs over 100k)
Household received Food Stamps/SNAP in the past 12 months: 325 Household did not receive Food Stamps/SNAP in the past 12 months: 547
Women who had a birth in the past 12 months: 76 (18 now married, 59 unmarried) Women who did not have a birth in the past 12 months: 556 (155 now married, 403 unmarried)
Housing units in zip code 95546 with a mortgage: 165 (19 second mortgage, 15 both second mortgage and home equity loan) Median monthly owner costs for units with a mortgage: $756 Median monthly owner costs for units without a mortgage: $382
Residents with income below the poverty level in 2022:
This zip code:
30.2%
Whole state:
12.2%
Residents with income below 50% of the poverty level in 2022:
This zip code:
13.5%
Whole state:
6.2%
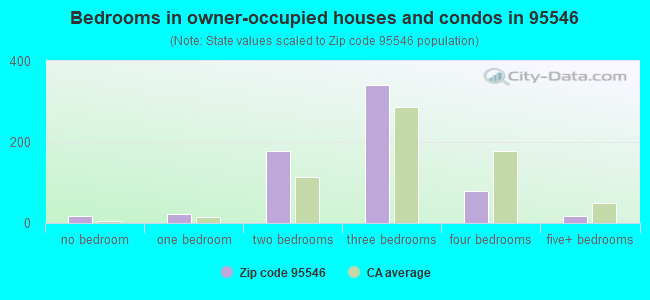
Median number of rooms in houses and condos:
Here:
4.9
State:
6.0
Median number of rooms in apartments:
Here:
4.1
State:
3.9
Notable locations in this zip code not listed on our city pages
Notable locations in zip code 95546: Butte Camp (A), Cooper Ranch (B), Rube Ranch (C), Moore Ranch (D), Essenpries Mill (E), Hoopa Campground (F), K'ima W Ambulance (G), Yurok Volunteer Fire Department Station 1 (H), Yoruk Volunteer Fire Department Station 2 (I), Hoopa Valley Tribe Fire Department (J), Hoopa Valley Volunteer Fire Department (K). Display/hide their locations on the map
Creeks: Coyote Creek (A), Deerhorn Creek (B), Gist Creek (C), Limb Camp Creek (D), Muddy Creek (E), Supply Creek (F), Spring Creek (G), Soctish Creek (H), Mill Creek (I). Display/hide their locations on the map
In group quarters: 30 (-1 institutionalized population)
Size of family households: 160 2-persons, 150 3-persons, 76 4-persons, 91 5-persons, 24 6-persons, 103 7-or-more-persons
Size of nonfamily households: 163 1-person, 53 2-persons
258 married couples with children.
185 single-parent households (81 men, 104 women).
80.3% of residents of 95546 zip code speak English at home.
0.8% of residents speak Spanish at home (100% very well).
0.1% of residents speak other Indo-European language at home (100% very well).
6.2% of residents speak Asian or Pacific Island language at home (19% well, 81% not well).
13.1% of residents speak other language at home (100% very well).
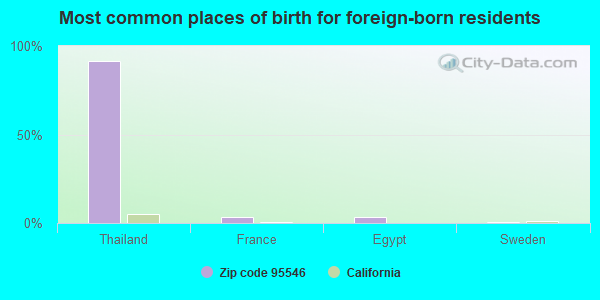
Foreign born population: 166 (6.3%) (94.7% of them are naturalized citizens)
This zip code:
6.3%
Whole state:
26.7%
92%Thailand
4%France
4%Egypt
1%Sweden
1%United Kingdom, excluding England and Scotland
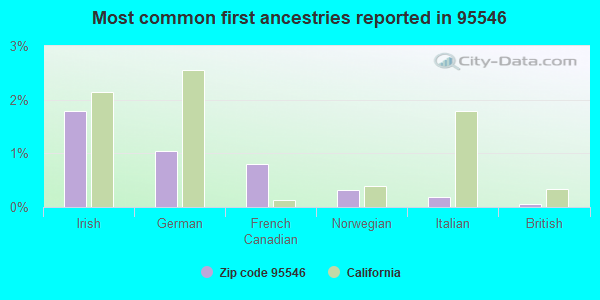
2%Irish
1%German
1%French Canadian
0%Norwegian
0%Italian
0%British
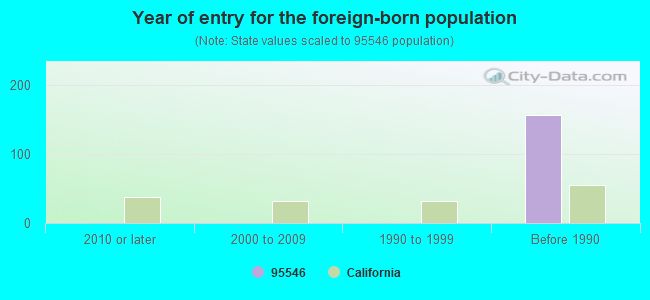
Year of entry for the foreign-born population
02010 or later
02000 to 2009
01990 to 1999
156Before 1990
Public high schools in in zip code 95546 not listed on the city page:
HOOPA VALLEY HIGH(Students: 170, Location: 11400 STATE HIGHWAY 96, Grades: 9-12)
Facilities with environmental interests located in this zip code:
HOOPA VALLEY ELEMENTARY (HWY. 96 & LOOP ROAD in HOOPA, CA)
(National Center for Education Statistics) - STATE ID-6007967 Organizations: KLAMATH-TRINITY JOINT UNIFIED (SCHOOL DISTRICT)
HOOPA VALLEY HIGH (HWY. 96 & LOOP ROAD in HOOPA, CA)
(National Center for Education Statistics) - STATE ID-1234004 Organizations: KLAMATH-TRINITY JOINT UNIFIED (SCHOOL DISTRICT)
JACK NORTON ELEMENTARY - PECUAN (HWY. 169 in HOOPA, CA)
(National Center for Education Statistics) - STATE ID-6007983 Organizations: KLAMATH-TRINITY JOINT UNIFIED (SCHOOL DISTRICT)
CELTOR CHEMICAL WORKS (BETW NORTON FLD & TRINITY RIV in HOOPA, CA) . Tribal Land
SUPERFUND NPL (Superfund database) (Integrated Compliance Information System) - ICIS-09-1993-0013, FORMAL ENFORCEMENT ACTION Alternative names: HOOPA VALLEY INDIAN RESERVATION
CAPTAIN JOHN CONTINUATION (HWY. 96 in HOOPA, CA)
(National Center for Education Statistics) - STATE ID-1230028 Organizations: KLAMATH-TRINITY JOINT UNIFIED (SCHOOL DISTRICT)
HOOPA VALLEY WWTS, LAND MANAGEMENT OFFICE (RESERVATION in HOOPA, CA) . Tribal Land
ENFORCEMENT/COMPLIANCE ACTIVITY (Integrated Compliance Information System) Alternative names: HOOPA VALLEY SS AND LEACHFIELD AT KIMA MEDICAL COMPLEX, HOOPA VALLEY WWTS AT CAMPBELL FIELD, HOOPA VALLEY WWTS AT SHOPPING CENTER
HOOPA LANDFILL (PO BOX 1348 in HOOPA, CA)
CRITERIA AND HAZARDOUS AIR POLLUTANT INVENTORY (Inventory of air pollution sources) Business SIC classification: REFUSE SYSTEMS Business NAICS classification: SOLID WASTE LANDFILL.
MASONITE MILL MESCAT FIELD SITE (HWY 96 ALLOTTMENT 265A 283-296 in HOOPA, CA)
SUPERFUND (Superfund database) Alternative names: HOOPA VALLEY INDIAN RESV, HOOPA VENEER
CAPPELL ROAD ILLEGAL DUMP (CAPPELL ROAD in WEITCHPEC, CA)
SUPERFUND (Superfund database) Alternative names: CAPPELL ROAD SITE
Housing units lacking complete plumbing facilities: 15.1% Housing units lacking complete kitchen facilities: 12.1%
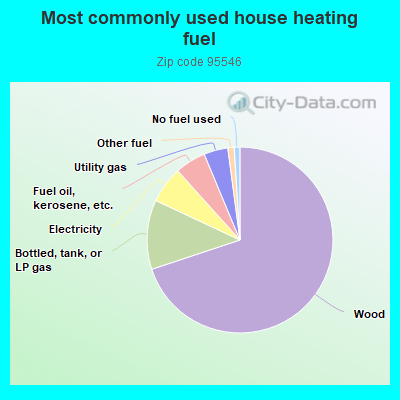
70.2%Wood
12.1%Bottled, tank, or LP gas
6.4%Electricity
5.4%Fuel oil, kerosene, etc.
4.2%Utility gas
1.1%Other fuel
1.0%No fuel used
Population in 1990: 2,702. Population change in the 1990s: +338 (+12.5%).
Place of birth for U.S.-born residents:
This state: 2,292
Northeast: 2
Midwest: 29
South: 49
West: 109
65% of the 95546 zip code residents lived in the same house 5 years ago. Out of people who lived in different houses, 80% lived in this county. Out of people who lived in different counties, 50% lived in California.
95% of the 95546 zip code residents lived in the same house 1 year ago. Out of people who lived in different houses, 86% moved from this county. Out of people who lived in different houses, 14% moved from different county within same state.
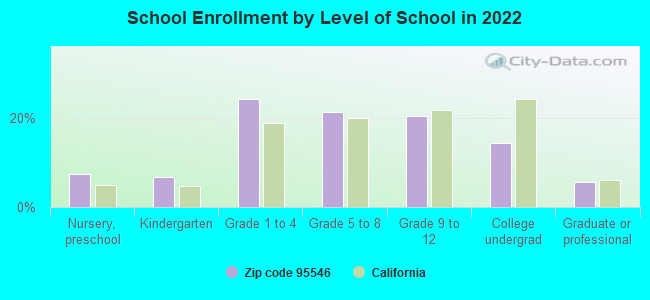
Private vs. public school enrollment:
Students in private schools in grades 1 to 8 (elementary and middle school): 22
Here:
7.2%
California:
10.5%
Students in private schools in grades 9 to 12 (high school): 10
Here:
7.7%
California:
8.5%
Students in private undergraduate colleges: 11
Here:
12.1%
California:
15.9%
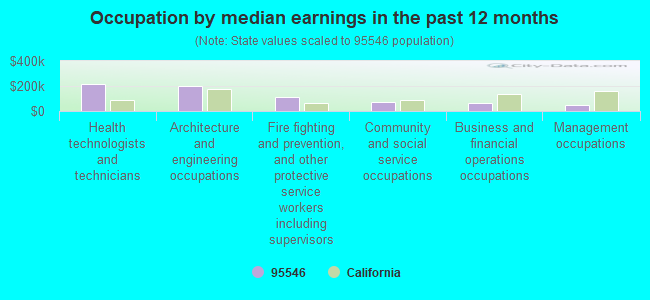
Occupation by median earnings in the past 12 months ($)
212,206Health technologists and technicians
198,805Architecture and engineering occupations
110,601Fire fighting and prevention, and other protective service workers including supervisors
69,247Community and social service occupations
65,218Business and financial operations occupations
46,692Management occupations
Top industries in this zip code by the number of employees in 2005:
Arts, Entertainment, and Recreation: Other Gambling Industries (20-49 employees: 1 establishment)
Health Care and Social Assistance: Vocational Rehabilitation Services (5-9: 1, 1-4: 1)
Finance and Insurance: Credit Unions (5-9: 1)
Construction: New Single-Family Housing Construction (except Operative Builders) (1-4: 2)
Other Services (except Public Administration): Religious Organizations (1-4: 1)
Other Services (except Public Administration): Other Social Advocacy Organizations (1-4: 1)
People in group quarters in 2010:
18 people in workers' group living quarters and job corps centers
People in group quarters in 2000:
5 people in other noninstitutional group quarters
Fatal accident statistics in 2014:
Fatal accident count: 3
Vehicles involved in fatal accidents: 3
Fatal accidents caused by drunken drivers: 1
Fatalities: 4
Persons involved in fatal accidents: 4
Pedestrians involved in fatal accidents: 1
Fatal accident statistics in 2011:
Fatal accident count: 2
Vehicles involved in fatal accidents: 3
Fatal accidents caused by drunken drivers: 1
Fatalities: 2
Persons involved in fatal accidents: 3
Pedestrians involved in fatal accidents: 1
2005 - 2018 National Fire Incident Reporting System (NFIRS) incidents
According to the data from the years 2005 - 2018 the average number of fires per year is 24. The highest number of reported fires - 73 took place in 2015, and the least - 1 in 2006. The data has a rising trend.
When looking into fire subcategories, the most incidents belonged to: Outside Fires (89.1%), and Structure Fires (6.7%).
Fire incident types reported to NFIRS in Zip Code 95546


 Nearest zip codes: 95573, 95525, 95556, 95563, 95555, 95527.


 (Students: 170, Location: 11400 STATE HIGHWAY 96, Grades: 9-12)

 According to the data from the years 2005 - 2018 the average number of fires per year is 24. The highest number of reported fires - 73 took place in 2015, and the least - 1 in 2006. The data has a rising trend.
 When looking into fire subcategories, the most incidents belonged to: Outside Fires (89.1%), and Structure Fires (6.7%).