Estimated zip code population in 2022: 19,258 Zip code population in 2010: 18,889 Zip code population in 2000: 14,785
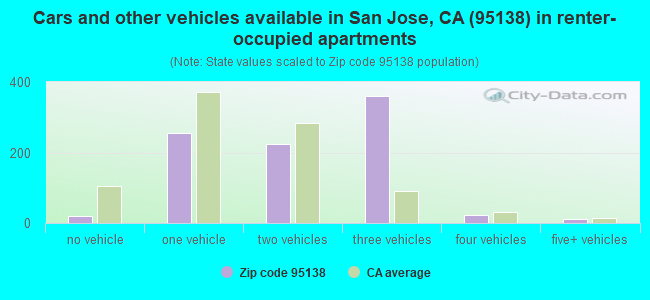
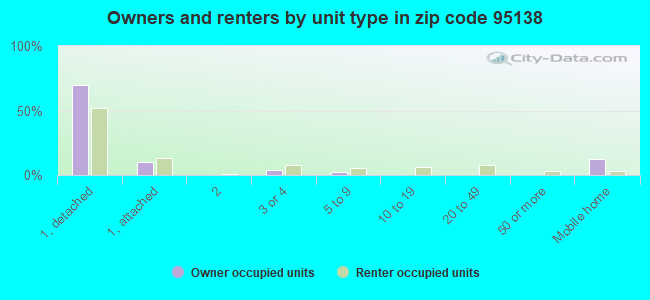
Houses and condos: 5,787 Renter-occupied apartments: 894
% of renters here:
16%
State:
44%
March 2022 cost of living index in zip code 95138: 121.8 (high, U.S. average is 100)
Land area: 26.1 sq. mi. Water area: 0.0 sq. mi.
Population density: 739 people per square mile
(low).
OSM Map
General Map
Google Map
MSN Map
OSM Map
General Map
Google Map
MSN Map
OSM Map
General Map
Google Map
MSN Map
OSM Map
General Map
Google Map
MSN Map
Please wait while loading the map...
Real estate property taxes paid for housing units in 2022:
This zip code:
0.7% ($10,292)
California:
0.7% ($4,831)
Median real estate property taxes paid for housing units with mortgages in 2022: $10,330 (0.7%) Median real estate property taxes paid for housing units with no mortgage in 2022: $9,621 (0.8%)
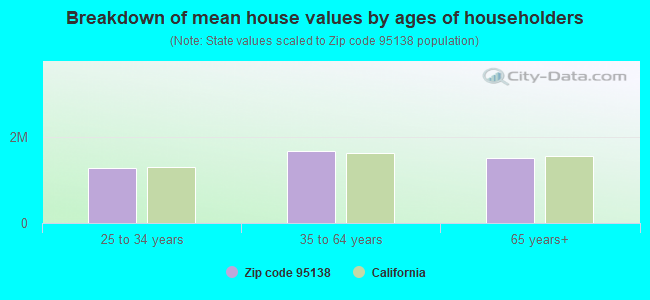
Estimated median house/condo value in 2022: $1,386,737
95138:
$1,386,737
California:
$715,900
According to our research of California and other state lists, there were 25 registered sex offenders living in 95138 zip code as of May 02, 2024. The ratio of all residents to sex offenders in zip code 95138 is 791 to 1. The ratio of registered sex offenders to all residents in this zip code is near the state average.
Median resident age:
This zip code:
39.0 years
California median age:
37.9 years
Average household size:
This zip code:
3.4 people
California:
2.8 people
Averages for the 2020 tax year for zip code 95138, filed in 2021:
Average Adjusted Gross Income (AGI) in 2020: $293,474 (Individual Income Tax Returns)
Here:
$293,474
State:
$95,910
Salary/wage: $188,774 (reported on 86.3% of returns)
Here:
$188,774
State:
$77,331
(% of AGI for various income ranges: 1141.7% for AGIs below $25k, 3984.7% for AGIs $25k-50k, 7783.8% for AGIs $50k-75k, 11390.2% for AGIs $75k-100k, 23832.5% for AGIs $100k-200k, 189481.5% for AGIs over 200k)
Taxable interest for individuals: $3,327 (reported on 49.0% of returns)
This zip code:
$3,327
California:
$2,294
(% of AGI for various income ranges: 26.9% for AGIs below $25k, 42.7% for AGIs $25k-50k, 63.2% for AGIs $50k-75k, 104.9% for AGIs $75k-100k, 220.5% for AGIs $100k-200k, 1903.8% for AGIs over 200k)
Ordinary dividends: $16,934 (reported on 40.5% of returns)
Here:
$16,934
State:
$10,949
(% of AGI for various income ranges: 42.4% for AGIs below $25k, 75.2% for AGIs $25k-50k, 110.7% for AGIs $50k-75k, 192.8% for AGIs $75k-100k, 556.5% for AGIs $100k-200k, 9141.8% for AGIs over 200k)
Net capital gain/loss in AGI: +$212,809 (reported on 42.1% of returns)
Here:
+$212,809
State:
+$49,306
(% of AGI for various income ranges: 30.4% for AGIs below $25k, 84.0% for AGIs $25k-50k, 179.9% for AGIs $50k-75k, 256.3% for AGIs $75k-100k, 1069.5% for AGIs $100k-200k, 132396.7% for AGIs over 200k)
Profit/loss from business: +$33,224 (reported on 16.2% of returns)
Here:
+$33,224
State:
+$15,671
(% of AGI for various income ranges: 142.4% for AGIs below $25k, 253.5% for AGIs $25k-50k, 275.9% for AGIs $50k-75k, 336.7% for AGIs $75k-100k, 1046.0% for AGIs $100k-200k, 5538.7% for AGIs over 200k)
Taxable individual retirement arrangement distribution: $30,993 (reported on 6.3% of returns)
95138:
$30,993
California:
$23,505
(% of AGI for various income ranges: 33.0% for AGIs below $25k, 91.8% for AGIs $25k-50k, 143.2% for AGIs $50k-75k, 314.0% for AGIs $75k-100k, 576.8% for AGIs $100k-200k, 1636.2% for AGIs over 200k)
Self-employed (Keogh) retirement plans: $37,884 (reported on 2.1% of returns)
95138:
$37,884
California:
$30,163
(% of AGI for various income ranges: 120.1% for AGIs $100k-200k, 1028.4% for AGIs over 200k)
Total itemized deductions: $47,516 (reported on 28.7% of returns)
Here:
$47,516
State:
$39,517
(% of AGI for various income ranges: 109.3% for AGIs below $25k, 257.4% for AGIs $25k-50k, 523.0% for AGIs $50k-75k, 1080.7% for AGIs $75k-100k, 2654.0% for AGIs $100k-200k, 15190.5% for AGIs over 200k)
Charity contributions: $17,859 (reported on 23.7% of returns)
Here:
$17,859
State:
$12,598
(% of AGI for various income ranges: 4.2% for AGIs below $25k, 17.6% for AGIs $25k-50k, 42.5% for AGIs $50k-75k, 104.9% for AGIs $75k-100k, 348.6% for AGIs $100k-200k, 5756.9% for AGIs over 200k)
Taxes paid: $9,724 (reported on 28.7% of returns)
95138:
$9,724
State:
$8,807
(% of AGI for various income ranges: 32.6% for AGIs below $25k, 69.0% for AGIs $25k-50k, 145.1% for AGIs $50k-75k, 344.2% for AGIs $75k-100k, 805.3% for AGIs $100k-200k, 2603.6% for AGIs over 200k)
Earned income credit: $1,661 (reported on 6.1% of returns)
Here:
$1,661
State:
$2,074
(% of AGI for various income ranges: 48.0% for AGIs below $25k, 39.2% for AGIs $25k-50k)
Percentage of individuals using paid preparers for their 2020 taxes: 92.0%
Here:
92%
State:
92%
(% for various income ranges: 90.7% for AGIs below $25k, 92.2% for AGIs $25k-50k, 92.2% for AGIs $50k-75k, 92.8% for AGIs $75k-100k, 90.7% for AGIs $100k-200k, 93.5% for AGIs over 200k)
Averages for the 2012 tax year for zip code 95138, filed in 2013:
Average Adjusted Gross Income (AGI) in 2012: $173,284 (Individual Income Tax Returns)
Here:
$173,284
State:
$72,726
Salary/wage: $148,066 (reported on 88.4% of returns)
Here:
$148,066
State:
$59,079
(% of AGI for various income ranges: 78.7% for AGIs below $25k, 80.8% for AGIs $25k-50k, 85.7% for AGIs $50k-75k, 82.9% for AGIs $75k-100k, 85.2% for AGIs $100k-200k, 71.9% for AGIs over 200k)
Taxable interest for individuals: $2,869 (reported on 51.3% of returns)
This zip code:
$2,869
California:
$2,146
(% of AGI for various income ranges: 1.4% for AGIs below $25k, 0.8% for AGIs $25k-50k, 1.0% for AGIs $50k-75k, 0.7% for AGIs $75k-100k, 0.6% for AGIs $100k-200k, 0.9% for AGIs over 200k)
Ordinary dividends: $12,666 (reported on 36.1% of returns)
Here:
$12,666
State:
$9,308
(% of AGI for various income ranges: 1.4% for AGIs below $25k, 1.5% for AGIs $25k-50k, 1.1% for AGIs $50k-75k, 1.6% for AGIs $75k-100k, 1.3% for AGIs $100k-200k, 3.2% for AGIs over 200k)
Net capital gain/loss in AGI: +$33,896 (reported on 36.7% of returns)
Here:
+$33,896
State:
+$30,460
(% of AGI for various income ranges: 0.3% for AGIs $25k-50k, 0.3% for AGIs $50k-75k, 0.6% for AGIs $100k-200k, 10.0% for AGIs over 200k)
Profit/loss from business: +$35,398 (reported on 17.3% of returns)
Here:
+$35,398
State:
+$17,064
(% of AGI for various income ranges: 11.2% for AGIs below $25k, 5.4% for AGIs $25k-50k, 3.5% for AGIs $50k-75k, 5.3% for AGIs $75k-100k, 4.5% for AGIs $100k-200k, 2.9% for AGIs over 200k)
Taxable individual retirement arrangement distribution: $27,539 (reported on 6.3% of returns)
95138:
$27,539
California:
$19,557
(% of AGI for various income ranges: 1.5% for AGIs below $25k, 2.3% for AGIs $25k-50k, 2.2% for AGIs $50k-75k, 2.0% for AGIs $75k-100k, 1.6% for AGIs $100k-200k, 0.7% for AGIs over 200k)
Self-employment retirement plans: $28,480 (reported on 2.5% of returns)
95138:
$28,480
California:
$24,530
(% of AGI for various income ranges: 1.2% for AGIs below $25k, 0.5% for AGIs $100k-200k, 0.4% for AGIs over 200k)
Total itemized deductions: $54,016 (20% of AGI, reported on 58.0% of returns)
Here:
$54,016
State:
$34,004
Here:
19.7% of AGI
State:
22.7% of AGI
(% of AGI for various income ranges: 14.9% for AGIs below $25k, 14.4% for AGIs $25k-50k, 19.9% for AGIs $50k-75k, 22.1% for AGIs $75k-100k, 23.6% for AGIs $100k-200k, 16.6% for AGIs over 200k)
Charity contributions: $4,042 (reported on 48.3% of returns)
Here:
$4,042
State:
$4,659
(% of AGI for various income ranges: 0.6% for AGIs below $25k, 0.9% for AGIs $25k-50k, 1.2% for AGIs $50k-75k, 1.5% for AGIs $75k-100k, 1.5% for AGIs $100k-200k, 1.0% for AGIs over 200k)
Taxes paid: $30,552 (reported on 58.0% of returns)
95138:
$30,552
State:
$14,448
(% of AGI for various income ranges: 4.4% for AGIs below $25k, 4.6% for AGIs $25k-50k, 6.8% for AGIs $50k-75k, 8.4% for AGIs $75k-100k, 10.9% for AGIs $100k-200k, 10.7% for AGIs over 200k)
Earned income credit: $1,861 (reported on 8.9% of returns)
Here:
$1,861
State:
$2,286
(% of AGI for various income ranges: 4.7% for AGIs below $25k, 0.8% for AGIs $25k-50k)
Percentage of individuals using paid preparers for their 2012 taxes: 58.5%
Here:
58%
State:
64%
(% for various income ranges: 55.8% for AGIs below $25k, 58.6% for AGIs $25k-50k, 59.0% for AGIs $50k-75k, 60.8% for AGIs $75k-100k, 56.4% for AGIs $100k-200k, 61.7% for AGIs over 200k)
Averages for the 2004 tax year for zip code 95138, filed in 2005:
Average Adjusted Gross Income (AGI) in 2004: $128,446 (Individual Income Tax Returns)
Here:
$128,446
State:
$58,600
Salary/wage: $116,430 (reported on 88.3% of returns)
Here:
$116,430
State:
$49,455
(% of AGI for various income ranges: 78.0% for AGIs $10k-25k, 86.3% for AGIs $25k-50k, 87.4% for AGIs $50k-75k, 89.7% for AGIs $75k-100k, 75.9% for AGIs over 100k)
Taxable interest for individuals: $2,938 (reported on 61.0% of returns)
This zip code:
$2,938
California:
$2,365
(% of AGI for various income ranges: 2.0% for AGIs $10k-25k, 1.4% for AGIs $25k-50k, 0.7% for AGIs $50k-75k, 0.9% for AGIs $75k-100k, 1.3% for AGIs over 100k)
Taxable dividends: $5,104 (reported on 38.5% of returns)
Here:
$5,104
State:
$4,746
(% of AGI for various income ranges: 2.0% for AGIs $10k-25k, 1.0% for AGIs $25k-50k, 0.6% for AGIs $50k-75k, 0.6% for AGIs $75k-100k, 1.6% for AGIs over 100k)
Net capital gain/loss: +$28,413 (reported on 41.2% of returns)
Here:
+$28,413
State:
+$23,418
(% of AGI for various income ranges: 1.1% for AGIs $10k-25k, -0.3% for AGIs $25k-50k, 1.2% for AGIs $50k-75k, 0.4% for AGIs $75k-100k, 10.8% for AGIs over 100k)
Profit/loss from business: +$36,845 (reported on 19.2% of returns)
Here:
+$36,845
State:
+$16,826
(% of AGI for various income ranges: 11.0% for AGIs $10k-25k, 7.0% for AGIs $25k-50k, 5.6% for AGIs $50k-75k, 4.8% for AGIs $75k-100k, 5.5% for AGIs over 100k)
IRA payment deduction: $3,683 (reported on 3.1% of returns)
95138:
$3,683
California:
$3,192
(% of AGI for various income ranges: 0.3% for AGIs $10k-25k, 0.3% for AGIs $25k-50k, 0.2% for AGIs $50k-75k, 0.1% for AGIs $75k-100k, 0.1% for AGIs over 100k)
Self-employed pension: $23,422 (reported on 3.2% of returns)
Here:
$23,422
California:
$17,688
(% of AGI for various income ranges: 0.7% for AGIs $10k-25k, 0.2% for AGIs $50k-75k, 0.4% for AGIs $75k-100k, 0.7% for AGIs over 100k)
Total itemized deductions: $45,920 (24% of AGI, reported on 63.1% of returns)
Here:
$45,920
State:
$28,113
Here:
24.0% of AGI
State:
25.3% of AGI
(% of AGI for various income ranges: 22.9% for AGIs $10k-25k, 23.5% for AGIs $25k-50k, 27.3% for AGIs $50k-75k, 29.7% for AGIs $75k-100k, 20.9% for AGIs over 100k)
Charity contributions deductions: $4,194 (2% of AGI, reported on 55.5% of returns)
Here:
$4,194
State:
$3,923
Here:
2.1% of AGI
State:
3.3% of AGI
(% of AGI for various income ranges: 1.0% for AGIs $10k-25k, 1.5% for AGIs $25k-50k, 1.8% for AGIs $50k-75k, 2.2% for AGIs $75k-100k, 1.8% for AGIs over 100k)
Total tax: $27,851 (reported on 84.9% of returns)
95138:
$27,851
State:
$10,761
(% of AGI for various income ranges: 5.0% for AGIs $10k-25k, 7.5% for AGIs $25k-50k, 9.0% for AGIs $50k-75k, 9.8% for AGIs $75k-100k, 20.2% for AGIs over 100k)
Earned income credit: $1,533 (reported on 6.1% of returns)
Here:
$1,533
State:
$1,763
Percentage of individuals using paid preparers for their 2004 taxes: 61.1%
Here:
61%
State:
66%
(% for various income ranges: 54.9% for AGIs below $10k, 62.2% for AGIs $10k-25k, 63.3% for AGIs $25k-50k, 62.2% for AGIs $50k-75k, 61.3% for AGIs $75k-100k, 61.8% for AGIs over 100k)
Likely homosexual households (counted as self-reported same-sex unmarried-partner households)
Lesbian couples: 0.0% of all households
Gay men: 0.4% of all households
Household received Food Stamps/SNAP in the past 12 months: 374 Household did not receive Food Stamps/SNAP in the past 12 months: 5,236
Women who had a birth in the past 12 months: 202 (149 now married, 52 unmarried) Women who did not have a birth in the past 12 months: 4,828 (2,131 now married, 2,687 unmarried)
Housing units in zip code 95138 with a mortgage: 3,490 (367 second mortgage, 351 both second mortgage and home equity loan) Houses without a mortgage: 65
Median monthly owner costs for units with a mortgage: $3,876 Median monthly owner costs for units without a mortgage: $1,407
Residents with income below the poverty level in 2022:
This zip code:
5.6%
Whole state:
12.2%
Residents with income below 50% of the poverty level in 2022:
This zip code:
1.9%
Whole state:
6.2%
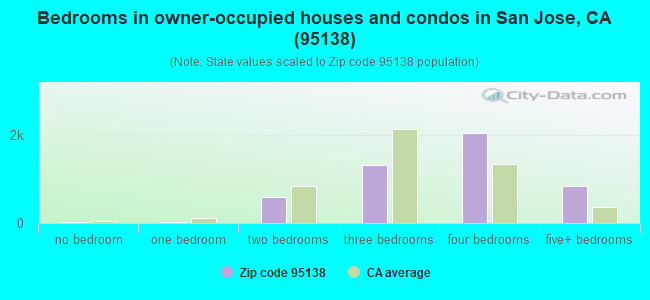
Median number of rooms in houses and condos:
Here:
6.9
State:
6.0
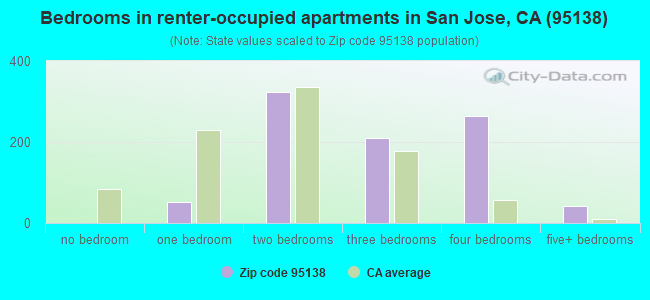
Median number of rooms in apartments:
Here:
5.2
State:
3.9
Notable locations in this zip code not listed on our city pages
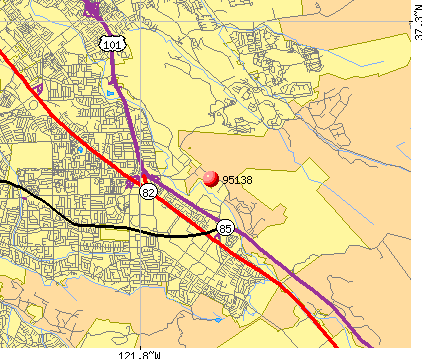
Notable locations in zip code 95138: Silver Creek Valley Country Club (A), United Technology Corporation Fire Department (B). Display/hide their locations on the map
2,885 married couples with children.
1,513 single-parent households (304 men, 1,209 women).
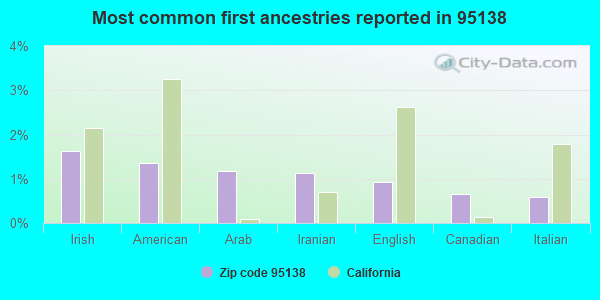
38.7% of residents of 95138 zip code speak English at home.
15.8% of residents speak Spanish at home (77% very well, 15% well, 6% not well, 3% not at all).
11.6% of residents speak other Indo-European language at home (87% very well, 10% well, 3% not well).
31.2% of residents speak Asian or Pacific Island language at home (63% very well, 23% well, 12% not well, 3% not at all).
3.2% of residents speak other language at home (89% very well, 8% well, 2% not well).
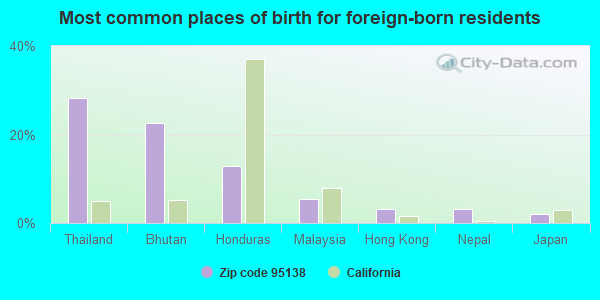
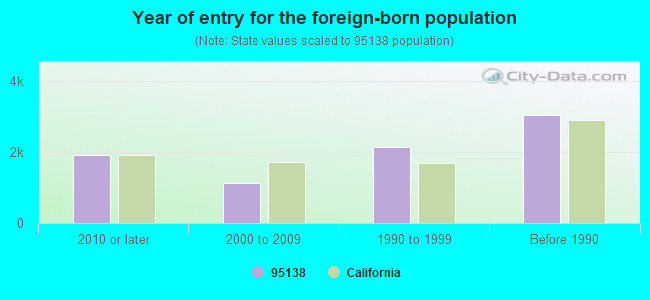
Foreign born population: 7,929 (41.2%) (70.0% of them are naturalized citizens)
Facilities with environmental interests located in this zip code:
ACT MANUFACTURING (5500 HELLYER AVE in SAN JOSE, CA)
STATE MASTER (California - Hazardous Waste Tracking) - HAZARDOU WASTE PROGRAM CRITERIA AND HAZARDOUS AIR POLLUTANT INVENTORY (Inventory of air pollution sources) Small Quantity Generators, between 100 kg and 1000 kg of hazardous waste/month (Resource Conservation and Recovery Act (tracking hazardous waste)) - notification TRI REPORTER (Tracking of toxic chemicals releasing facilities) Business SIC classification: PRINTED CIRCUIT BOARDS; ELECTRONIC COMPONENTS Business NAICS classification: PRINTED CIRCUIT ASSEMBLY (ELECTRONIC ASSEMBLY) MANUFACTURING. Organizations: ACT ELECTRONICS INC. (CONTACT/OPERATOR)
, SUN CAPITAL PARTNERS, INC. (CONTACT/OWNER)
Alternative names: ACT ELECTRONICS INC
INTEL CORPORATION (300 ENZO DR in SAN JOSE, CA)
STATE MASTER (California - Hazardous Waste Tracking) - HAZARDOU WASTE PROGRAM CRITERIA AND HAZARDOUS AIR POLLUTANT INVENTORY (Inventory of air pollution sources) HAZARDOUS WASTE BIENNIAL REPORTER (Resource Conservation and Recovery Act (tracking hazardous waste)) Large Quantity Generators, more that 1000 kg of hazardous waste/month (Resource Conservation and Recovery Act (tracking hazardous waste)) Business SIC classification: SEMICONDUCTORS AND RELATED DEVICES Business NAICS classification: SEMICONDUCTOR AND RELATED DEVICE MANUFACTURING.
JOE'S CLEANERS (5540 MONTEREY HWY in SAN JOSE, CA) . Federal Facility
STATE MASTER (California - Hazardous Waste Tracking) - HAZARDOU WASTE PROGRAM CRITERIA AND HAZARDOUS AIR POLLUTANT INVENTORY (Inventory of air pollution sources) Small Quantity Generators, between 100 kg and 1000 kg of hazardous waste/month (Resource Conservation and Recovery Act (tracking hazardous waste)) - notification Business SIC classification: DRYCLEANING PLANTS, EXCEPT RUG CLEANING Organizations: KEBEDE YOFTAHIE (CONTACT/OWNER)
Alternative names: DRY CLEAN USA
NORTHROP GRUMMAN SYSTEMS CORPORATION (5225 HELLYER AVENUE SUITE 100 in SAN JOSE, CA)
STATE MASTER (California - Hazardous Waste Tracking) - HAZARDOU WASTE PROGRAM CRITERIA AND HAZARDOUS AIR POLLUTANT INVENTORY (Inventory of air pollution sources) Small Quantity Generators, between 100 kg and 1000 kg of hazardous waste/month (Resource Conservation and Recovery Act (tracking hazardous waste)) - notification Business SIC classification: SEARCH, DETECTION, NAVIGATION, GUIDANCE, AERONAUTICAL, AND NAUTICAL SYSTEMS AND INSTRUMENTS Business NAICS classification: SEARCH, DETECTION, NAVIGATION, GUIDANCE, AERONAUTICAL, AND NAUTICAL SYSTEM AND INSTRUMENT MANUFACTURING. Organizations: NORTHROP GRUMMAN SYSTEMS CORP. (CONTACT/OPERATOR)
, LEGACY PARTNERS (CONTACT/OWNER)
Alternative names: LITTON ADVANCED SYSTEMS DIV, NORTHROP GRUMMAN ELECTRONIC SYSTEMS
ELECTROGLAS INCORPORATED (6024 SILVER CREK VALLEY ROAD in SAN JOSE, CA)
STATE MASTER (California - Hazardous Waste Tracking) - HAZARDOU WASTE PROGRAM CRITERIA AND HAZARDOUS AIR POLLUTANT INVENTORY (Inventory of air pollution sources) Small Quantity Generators, between 100 kg and 1000 kg of hazardous waste/month (Resource Conservation and Recovery Act (tracking hazardous waste)) - notification Business SIC classification: NONCLASSIFIABLE ESTABLISHMENTS
LEDESMA (RITA) ELEMENTARY (1001 SCHOOLHOUSE ROAD in SAN JOSE, CA)
(National Center for Education Statistics) - STATE ID-6116081 Organizations: OAK GROVE ELEMENTARY (SCHOOL DISTRICT)
CELESTICA (5325 HELLYER AVE. in SAN JOSE, CA)
CRITERIA AND HAZARDOUS AIR POLLUTANT INVENTORY (Inventory of air pollution sources) HAZARDOUS WASTE BIENNIAL REPORTER (Resource Conservation and Recovery Act (tracking hazardous waste)) Large Quantity Generators, more that 1000 kg of hazardous waste/month (Resource Conservation and Recovery Act (tracking hazardous waste)) TRI REPORTER (Tracking of toxic chemicals releasing facilities) Business SIC classification: PRINTED CIRCUIT BOARDS; SEMICONDUCTORS AND RELATED DEVICES Business NAICS classification: PRINTED CIRCUIT ASSEMBLY (ELECTRONIC ASSEMBLY) MANUFACTURING.
EDISON PHARMACEUTICALS INC (5941 OPTICAL COURT in SAN JOSE, CA)
Small Quantity Generators, between 100 kg and 1000 kg of hazardous waste/month (Resource Conservation and Recovery Act (tracking hazardous waste)) Organizations: SAN JOSE STATE UNIVERSITY FOUNDATION (CONTACT/OPERATOR)
, MISSION WEST PROPERTIES (CONTACT/OWNER)
LITTON SYSTEMS INC. APPLIED TECHNOLOGY DIV. (4747 HELLYER AVENUE in SAN JOSE, CA)
COMPLIANCE ACTIVITY (Tracking inspections of insecticide, fungicide, and rodenticide, and toxic substances) CRITERIA AND HAZARDOUS AIR POLLUTANT INVENTORY (Inventory of air pollution sources) TRI REPORTER (Tracking of toxic chemicals releasing facilities) Business SIC classification: ELECTRONIC COMPONENTS; SEARCH, DETECTION, NAVIGATION, GUIDANCE, AERONAUTICAL, AND NAUTICAL SYSTEMS AND INSTRUMENTS Alternative names: LITTON ADVANCED SYSTEMS DIV, LITTON APPLIED TECHNOLOGY, LITTON SYSTEMS, INC
MAGANAS TRUCKING (550 PIERCY RD in SAN JOSE, CA)
TRANSPORTER (Resource Conservation and Recovery Act (tracking hazardous waste)) Organizations: CARLOS MAGANA (CONTACT/OWNER)
Housing units lacking complete kitchen facilities: 0.4%
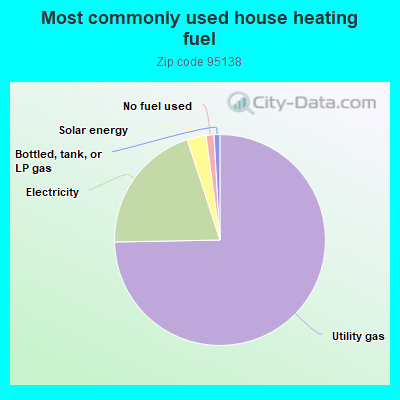
74.7%Utility gas
20.3%Electricity
2.9%Solar energy
1.2%No fuel used
0.9%Bottled, tank, or LP gas
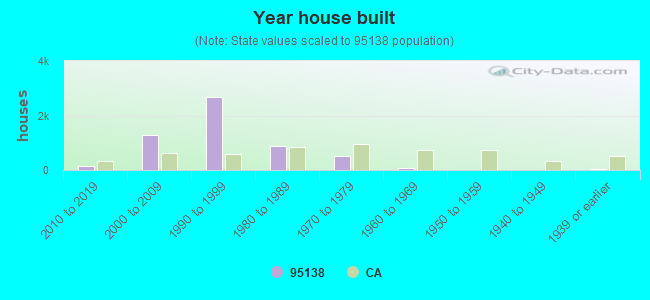
Population in 1990: 5,956. Population change in the 1990s: +8,829 (+148.2%).
Place of birth for U.S.-born residents:
This state: 9,526
Northeast: 556
Midwest: 262
South: 460
West: 314
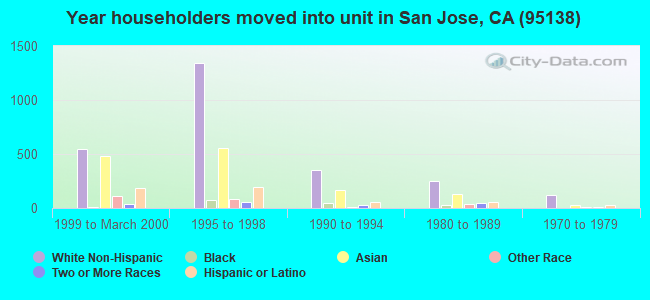
34% of the 95138 zip code residents lived in the same house 5 years ago. Out of people who lived in different houses, 68% lived in this county. Out of people who lived in different counties, 50% lived in California.
89% of the 95138 zip code residents lived in the same house 1 year ago. Out of people who lived in different houses, 74% moved from this county. Out of people who lived in different houses, 12% moved from different county within same state. Out of people who lived in different houses, 5% moved from different state. Out of people who lived in different houses, 6% moved from abroad.
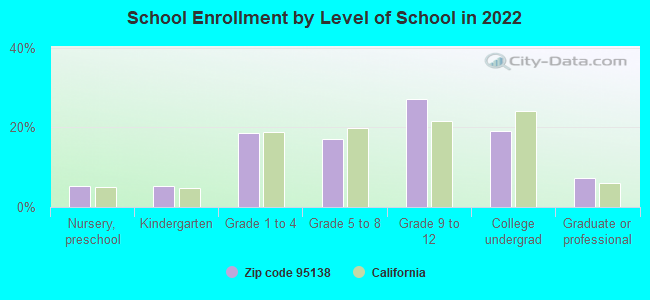
Private vs. public school enrollment:
Students in private schools in grades 1 to 8 (elementary and middle school): 440
Here:
21.0%
California:
10.5%
Students in private schools in grades 9 to 12 (high school): 465
Here:
29.5%
California:
8.5%
Students in private undergraduate colleges: 145
Here:
13.1%
California:
15.9%
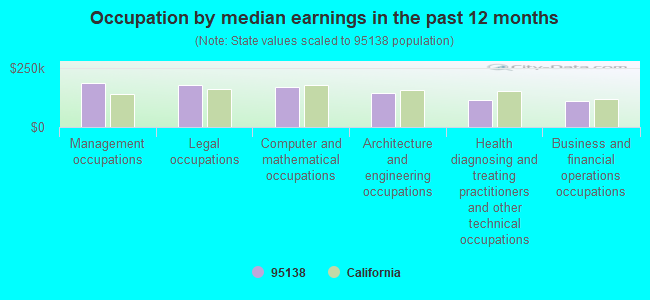
Occupation by median earnings in the past 12 months ($)
185,908Management occupations
175,849Legal occupations
170,225Computer and mathematical occupations
143,632Architecture and engineering occupations
115,719Health diagnosing and treating practitioners and other technical occupations
109,951Business and financial operations occupations
Companies with biggest federal contracts located in this zip code (SAN JOSE, CA):
NORTHROP GRUMMAN SYSTEMS CORPO (5225 HELLYER AVENUE) : $166,731,204 in 245 contractsfrom 1999 to 2006
Contracts for Radar Equipment, Airborne, Electrical and Electronic assemblies, Boards, Cards, and Associated Hardware, Maintenance, Repair and Rebuilding of Equipment -- Communication, Detection, and Coherent Radiation Equipment, Systems Engineering Services, and moreby Army, Navy, Defense Logistics Agency, Air Force, and others Signed by year:2000: $14,431,265; 2001: $4,524,467; 2002: $3,696,435; 2003: $19,992,309; 2004: $34,622,719; 2005: $53,687,768; 2006: $32,514,378.
Biggest contracts:
$25,757,527 with Army for Radar Equipment, Airborne. Signed on 2005-02-01. Completion date: 2008-09-28.
$12,114,472, same as above.Signed on 2004-02-13. Completion date: 2008-09-28.
$11,896,704 with Army for Electrical and Electronic assemblies, Boards, Cards, and Associated Hardware. Signed on 2004-02-13. Completion date: 2008-09-28.
$11,007,479 with Army for Radar Equipment, Airborne. Signed on 2006-06-29. Completion date: 2008-09-28.
RAYTHEON OPTICAL SYSTEMS, INC. (4767 HELLYER AVENUE) : $72,740,822 in 103 contractsfrom 1999 to 2006
Contracts for Optical Instruments, Test Equipment, Components and Accessories, Miscellaneous Electrical and Electronic Components, Radar Equipment, Airborne, Other Special Studies and Analyses, and moreby Air Force Signed by year:2000: $16,278,034; 2001: $29,312,400; 2002: $24,397,489; 2003: -$1,564,349; 2004: -$110,205; 2005: $356,104; 2006: $257,716.
Biggest contracts:
$8,486,200 with Air Force for Optical Instruments, Test Equipment, Components and Accessories. Signed on 2001-09-29. Completion date: 2003-11-30.
$6,000,000 with Air Force for Miscellaneous Electrical and Electronic Components. Signed on 2002-09-30. Completion date: 2002-09-30.
$3,907,956 with Air Force for Optical Instruments, Test Equipment, Components and Accessories. Signed on 2000-05-16. Completion date: 2002-09-30.
$2,939,343, same as above.Signed on 1999-11-08. Completion date: 2002-09-30.
CSD-AEROJET ASSOCIATES (A JOIN (600 METCALF ROAD) : $17,054,751 in 24 contractsfrom 2000 to 2006
Contracts for Defense Missile and Space Systems -- Advanced Development (R&D) by Air Force Signed by year:2000: $2,355,000; 2001: $751,600; 2002: $2,745,085; 2003: $2,837,066; 2004: $3,752,000; 2005: $2,531,000; 2006: $2,083,000.
Biggest contracts:
$2,355,000 with Air Force for Defense Missile and Space Systems -- Advanced Development (R&D). Signed on 2000-12-29. Completion date: 2005-06-15.
$1,761,000, same as above.Signed on 2004-01-22. Completion date: 2005-09-30.
$1,719,475, same as above.Signed on 2004-12-16. Completion date: 2005-09-30.
$1,604,000, same as above.Signed on 2002-08-08. Completion date: 2005-06-15.
M/A-COM, INC (5300 HELLYER AVENUE) : $12,046,019 in 22 contractsfrom 2005 to 2006
Contracts for Electrical Hardware and Supplies, Electronic Countermeasures, Counter-Countermeasures and Quick Reaction Capability Equipment, Oscillators and Piezoelectric Crystals, Filters and Networks, and moreby Navy, Defense Logistics Agency, Army Signed by year:2000: $0; 2001: $0; 2002: $0; 2003: $0; 2004: $0; 2005: $11,901,925; 2006: $144,094.
Biggest contracts:
$6,115,500 with Navy for Electrical Hardware and Supplies. Signed on 2005-06-03. Completion date: 2005-08-12.
$4,622,200, same as above.Signed on 2005-06-17. Completion date: 2005-08-12.
$1,011,500, same as above.Signed on 2005-08-18. Completion date: 2005-09-30.
$62,300 with Defense Logistics Agency for Electronic Countermeasures, Counter-Countermeasures and Quick Reaction Capability Equipment. Signed on 2005-06-02. Completion date: 2006-02-02.
M/A-COM, INC (5300 HELLYER AVENUE) : $2,719,932 in 34 contractsfrom 2001 to 2006
Contracts for Electronic Countermeasures, Counter-Countermeasures and Quick Reaction Capability Equipment, Oscillators and Piezoelectric Crystals, Miscellaneous Communication Equipment, Filters and Networks, and moreby Air Force, Defense Logistics Agency, Navy, Army, and others Signed by year:2000: $0; 2001: $210,750; 2002: $978,024; 2003: $151,575; 2004: $248,735; 2005: $923,217; 2006: $207,631.
Biggest contracts:
$610,377 with Air Force for Electronic Countermeasures, Counter-Countermeasures and Quick Reaction Capability Equipment. Signed on 2005-09-01. Completion date: 2009-08-31.
$434,225 with Air Force for Oscillators and Piezoelectric Crystals. Signed on 2002-03-28. Completion date: 2003-04-30.
$390,999 with Defense Logistics Agency for Miscellaneous Communication Equipment. Signed on 2002-03-19. Completion date: 2003-02-12.
$207,631 with Air Force for Electronic Countermeasures, Counter-Countermeasures and Quick Reaction Capability Equipment. Signed on 2006-01-05. Completion date: 2006-12-05.
STELLEX MICROWAVE SYSTEMS, INC (5300 HELLYER AVE) : $1,299,195 in 7 contractsfrom 1999 to 2001
Contracts for Oscillators and Piezoelectric Crystals, Miscellaneous Communication Equipment, Electrical Control Equipment, Electronic Countermeasures, Counter-Countermeasures and Quick Reaction Capability Equipment, and moreby Air Force, Defense Logistics Agency, Army, Navy, and others Signed by year:2000: $619,550; 2001: $60,625; 2002: $0; 2003: $0; 2004: $0; 2005: $0; 2006: $0.
Biggest contracts:
$619,020 with Air Force for Oscillators and Piezoelectric Crystals. Signed on 1999-12-30. Completion date: 2001-06-30.
$282,825 with Defense Logistics Agency for Miscellaneous Communication Equipment. Signed on 2000-03-21. Completion date: 2001-03-20.
$144,000 with Army for Electrical Control Equipment. Signed on 2000-07-24. Completion date: 2001-01-08.
$138,975 with Navy for Electronic Countermeasures, Counter-Countermeasures and Quick Reaction Capability Equipment. Signed on 2000-03-09. Completion date: 2001-10-30.
LITTON SYSTEMS INC (4747 HELLYER AVE) : $1,043,148 in 24 contractsfrom 2002 to 2006
Contracts for Converters, Electrical, Nonrotating, Electrical Hardware and Supplies, Miscellaneous Electrical and Electronic Components, Electrical and Electronic assemblies, Boards, Cards, and Associated Hardware, and moreby Defense Logistics Agency Signed by year:2000: $0; 2001: $0; 2002: $90,200; 2003: $32,544; 2004: $324,650; 2005: $255,087; 2006: $340,667.
Biggest contracts:
$107,559 with Defense Logistics Agency for Converters, Electrical, Nonrotating. Signed on 2006-03-17. Completion date: 2007-06-10.
$107,559, same as above.Signed on 2006-03-17. Completion date: 2007-06-07.
$96,174 with Defense Logistics Agency for Electrical Hardware and Supplies. Signed on 2006-01-27. Completion date: 2006-06-16.
$94,585 with Defense Logistics Agency for Miscellaneous Electrical and Electronic Components. Signed on 2004-02-11. Completion date: 2005-02-24.
SUNRISE TELECOM, INC (302 ENZO DRIVE; small business) : $855,635 in 20 contractsfrom 2002 to 2006
Contracts for ADP Support Equipment, Electrical and Electronic Properties Measuring and Testing Instruments, ADP Software, Teletype and Facsimile Equipment, and moreby Federal Technology Service, U.S. Coast Guard, National Geospatial-Intelligence Agency, Navy, and others Signed by year:2000: $0; 2001: $0; 2002: $366,755; 2003: $144,880; 2004: $239,155; 2005: $83,450; 2006: $21,395.
Biggest contracts:
$334,250 with Federal Technology Service for ADP Support Equipment. Signed on 2002-10-15. Completion date: 2003-10-15.
$135,280 with U.S. Coast Guard for Electrical and Electronic Properties Measuring and Testing Instruments. Signed on 2003-06-15. Completion date: 2003-08-15.
$121,925 with National Geospatial-Intelligence Agency for ADP Software. Signed on 2004-09-29. Completion date: 2004-09-29.
$47,010 with Navy for Electrical and Electronic Properties Measuring and Testing Instruments. Signed on 2004-08-16. Completion date: 2004-09-29.
AMPRO COMPUTERS, INC (5215 HELLYER AVE # 110; small business) : $631,422 in 15 contractsfrom 2002 to 2006
Contracts for ADP Central Processing Unit (CPU, Computer), Digital, Electronic Modules, Electrical and Electronic assemblies, Boards, Cards, and Associated Hardware, ADP Components, and moreby Army, Navy, NASA Signed by year:2000: $0; 2001: $0; 2002: $121,500; 2003: $0; 2004: $191,690; 2005: $290,022; 2006: $28,210.
Biggest contracts:
$169,950 with Army for ADP Central Processing Unit (CPU, Computer), Digital. Signed on 2005-07-20. Completion date: 2005-08-18.
$121,500 with Navy for Electronic Modules. Signed on 2002-11-15. Completion date: 2002-12-20.
$105,721 with Army for ADP Central Processing Unit (CPU, Computer), Digital. Signed on 2005-02-23. Completion date: 2005-04-18.
$68,651, same as above.Signed on 2004-08-18. Completion date: 2004-08-27.
IMT, INC. (5895 GLENEAGLES CIRCLE; small business) : $105,000 in 2 contractsfrom 1999 to 2000
$75,000 with Army for Other Defense -- Applied Research and Exploratory Development (R&D). Signed on 1999-12-20. Completion date: 2000-08-31.
$30,000 with Navy for Defense Ships -- Basic Research (R&D). Signed on 2000-05-09. Completion date: 1999-11-24.
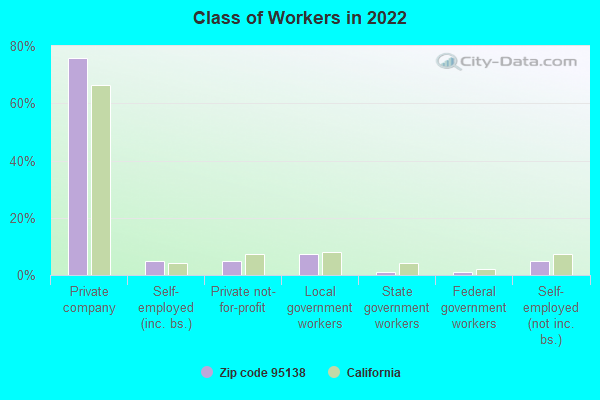
Top industries in this zip code by the number of employees in 2005:
Professional, Scientific, and Technical Services: Research and Development in the Physical, Engineering, and Life Sciences (250-499: 1, 100-249: 2, 5-9: 1, 1-4: 4)
Wholesale Trade: Computer and Computer Peripheral Equipment and Software Merchant Wholesalers (250-499: 1)
Wholesale Trade: Medical, Dental, and Hospital Equipment and Supplies Merchant Wholesalers (250-499: 1)
Arts, Entertainment, and Recreation: Golf Courses and Country Clubs (100-249: 1, 50-99: 1)
People in group quarters in 2010:
27 people in correctional facilities intended for juveniles
11 people in residential treatment centers for adults
10 people in group homes intended for adults
Fatal accident statistics in 2014:
Fatal accident count: 4
Vehicles involved in fatal accidents: 10
Fatal accidents caused by drunken drivers: 2
Fatalities: 4
Persons involved in fatal accidents: 19
Pedestrians involved in fatal accidents: 1
Fatal accident statistics in 2013:
Fatal accident count: 3
Vehicles involved in fatal accidents: 3
Fatal accidents caused by drunken drivers: 1
Fatalities: 3
Persons involved in fatal accidents: 6
Pedestrians involved in fatal accidents: 0
Home Mortgage Disclosure Act Aggregated Statistics For Year 2009 (Based on 2 full and 4 partial tracts)
A) FHA, FSA/RHS & VA Home Purchase Loans
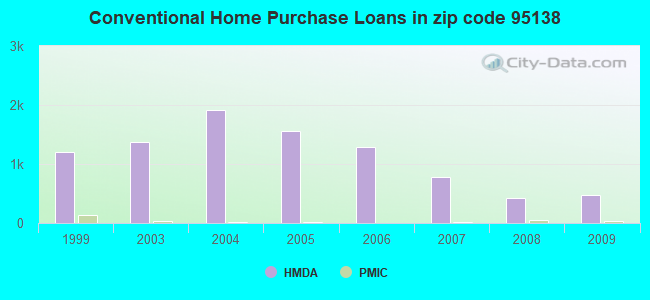
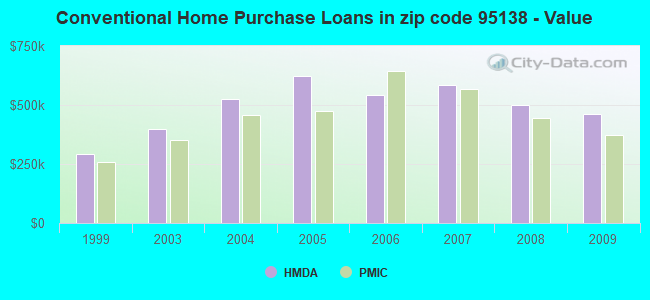
B) Conventional Home Purchase Loans
C) Refinancings
D) Home Improvement Loans
F) Non-occupant Loans on < 5 Family Dwellings (A B C & D)
G) Loans On Manufactured Home Dwelling (A B C & D)
Number
Average Value
Number
Average Value
Number
Average Value
Number
Average Value
Number
Average Value
Number
Average Value
LOANS ORIGINATED
86
$427,510
468
$462,673
1,951
$423,951
44
$306,436
75
$340,165
14
$91,053
APPLICATIONS APPROVED, NOT ACCEPTED
9
$421,917
61
$504,997
315
$439,297
8
$319,139
9
$296,706
4
$58,822
APPLICATIONS DENIED
22
$390,571
141
$501,611
557
$524,760
14
$398,936
27
$306,465
30
$77,832
APPLICATIONS WITHDRAWN
13
$446,607
86
$547,027
326
$510,966
10
$174,288
18
$223,516
0
$0
FILES CLOSED FOR INCOMPLETENESS
9
$431,352
29
$479,797
92
$420,831
2
$62,430
4
$227,092
4
$81,755
Aggregated Statistics For Year 2008 (Based on 2 full and 4 partial tracts)
A) FHA, FSA/RHS & VA Home Purchase Loans
B) Conventional Home Purchase Loans
C) Refinancings
D) Home Improvement Loans
E) Loans on Dwellings For 5+ Families
F) Non-occupant Loans on < 5 Family Dwellings (A B C & D)
G) Loans On Manufactured Home Dwelling (A B C & D)
Number
Average Value
Number
Average Value
Number
Average Value
Number
Average Value
Number
Average Value
Number
Average Value
Number
Average Value
LOANS ORIGINATED
42
$446,684
421
$500,273
1,037
$486,470
39
$261,833
2
$34,895,000
54
$373,386
29
$105,304
APPLICATIONS APPROVED, NOT ACCEPTED
4
$354,275
112
$629,139
197
$530,216
11
$242,746
0
$0
17
$369,593
25
$118,426
APPLICATIONS DENIED
6
$468,552
142
$451,868
469
$518,276
37
$269,023
0
$0
30
$425,398
79
$107,144
APPLICATIONS WITHDRAWN
2
$352,940
70
$568,660
218
$566,845
9
$256,671
0
$0
16
$315,910
0
$0
FILES CLOSED FOR INCOMPLETENESS
0
$0
14
$653,375
92
$562,085
4
$337,745
0
$0
0
$0
0
$0
Aggregated Statistics For Year 2007 (Based on 2 full and 4 partial tracts)
B) Conventional Home Purchase Loans
C) Refinancings
D) Home Improvement Loans
E) Loans on Dwellings For 5+ Families
F) Non-occupant Loans on < 5 Family Dwellings (A B C & D)
G) Loans On Manufactured Home Dwelling (A B C & D)
Number
Average Value
Number
Average Value
Number
Average Value
Number
Average Value
Number
Average Value
Number
Average Value
LOANS ORIGINATED
784
$584,795
1,473
$590,911
72
$361,629
0
$0
74
$449,387
53
$107,742
APPLICATIONS APPROVED, NOT ACCEPTED
216
$599,840
358
$565,881
36
$361,649
0
$0
20
$461,190
31
$98,375
APPLICATIONS DENIED
340
$496,410
679
$604,845
54
$323,479
4
$8,972
35
$511,503
82
$89,628
APPLICATIONS WITHDRAWN
131
$513,425
266
$553,661
18
$521,137
0
$0
18
$406,967
8
$100,360
FILES CLOSED FOR INCOMPLETENESS
37
$461,326
117
$558,249
3
$810,203
0
$0
3
$439,507
0
$0
Aggregated Statistics For Year 2006 (Based on 2 full and 4 partial tracts)
B) Conventional Home Purchase Loans
C) Refinancings
D) Home Improvement Loans
F) Non-occupant Loans on < 5 Family Dwellings (A B C & D)
G) Loans On Manufactured Home Dwelling (A B C & D)
Number
Average Value
Number
Average Value
Number
Average Value
Number
Average Value
Number
Average Value
LOANS ORIGINATED
1,294
$540,693
1,813
$575,196
168
$361,373
121
$469,519
52
$95,659
APPLICATIONS APPROVED, NOT ACCEPTED
397
$535,126
389
$538,136
54
$212,309
27
$483,697
31
$82,146
APPLICATIONS DENIED
485
$531,125
720
$576,959
102
$277,979
46
$481,686
42
$96,994
APPLICATIONS WITHDRAWN
275
$542,325
381
$554,216
40
$209,442
41
$369,895
20
$96,312
FILES CLOSED FOR INCOMPLETENESS
37
$536,318
118
$478,936
5
$126,886
8
$437,492
0
$0
Aggregated Statistics For Year 2005 (Based on 2 full and 4 partial tracts)
A) FHA, FSA/RHS & VA Home Purchase Loans
B) Conventional Home Purchase Loans
C) Refinancings
D) Home Improvement Loans
E) Loans on Dwellings For 5+ Families
F) Non-occupant Loans on < 5 Family Dwellings (A B C & D)
G) Loans On Manufactured Home Dwelling (A B C & D)
Number
Average Value
Number
Average Value
Number
Average Value
Number
Average Value
Number
Average Value
Number
Average Value
Number
Average Value
LOANS ORIGINATED
0
$0
1,551
$622,222
2,237
$522,265
201
$398,868
2
$643,580
105
$457,776
31
$94,068
APPLICATIONS APPROVED, NOT ACCEPTED
0
$0
404
$522,754
393
$504,404
31
$250,473
0
$0
18
$371,963
43
$96,796
APPLICATIONS DENIED
2
$90,725
560
$628,317
863
$534,378
112
$352,994
0
$0
55
$393,296
88
$116,512
APPLICATIONS WITHDRAWN
0
$0
251
$550,128
513
$474,060
42
$353,953
0
$0
24
$438,241
15
$92,263
FILES CLOSED FOR INCOMPLETENESS
0
$0
88
$557,488
154
$521,547
11
$325,644
0
$0
11
$229,386
0
$0
Aggregated Statistics For Year 2004 (Based on 2 full and 4 partial tracts)
B) Conventional Home Purchase Loans
C) Refinancings
D) Home Improvement Loans
E) Loans on Dwellings For 5+ Families
F) Non-occupant Loans on < 5 Family Dwellings (A B C & D)
G) Loans On Manufactured Home Dwelling (A B C & D)
Number
Average Value
Number
Average Value
Number
Average Value
Number
Average Value
Number
Average Value
Number
Average Value
LOANS ORIGINATED
1,923
$523,725
2,954
$452,429
82
$278,194
0
$0
188
$332,702
56
$92,012
APPLICATIONS APPROVED, NOT ACCEPTED
516
$538,631
642
$450,162
9
$211,212
0
$0
33
$220,395
56
$108,781
APPLICATIONS DENIED
624
$595,550
822
$442,182
59
$222,335
0
$0
57
$363,102
127
$97,178
APPLICATIONS WITHDRAWN
213
$472,210
605
$407,505
33
$239,242
2
$83,240
22
$323,999
14
$86,169
FILES CLOSED FOR INCOMPLETENESS
104
$436,097
124
$415,603
2
$99,700
0
$0
2
$145,670
0
$0
Aggregated Statistics For Year 2003 (Based on 2 full and 4 partial tracts)
A) FHA, FSA/RHS & VA Home Purchase Loans
B) Conventional Home Purchase Loans
C) Refinancings
D) Home Improvement Loans
F) Non-occupant Loans on < 5 Family Dwellings (A B C & D)
Number
Average Value
Number
Average Value
Number
Average Value
Number
Average Value
Number
Average Value
LOANS ORIGINATED
2
$58,840
1,377
$400,072
6,116
$386,236
37
$106,177
292
$231,738
APPLICATIONS APPROVED, NOT ACCEPTED
4
$61,942
235
$366,438
1,260
$384,163
20
$85,432
44
$252,880
APPLICATIONS DENIED
0
$0
348
$369,776
1,062
$441,921
33
$87,211
46
$303,600
APPLICATIONS WITHDRAWN
0
$0
140
$436,931
949
$359,081
20
$161,144
30
$265,693
FILES CLOSED FOR INCOMPLETENESS
0
$0
47
$456,563
261
$432,384
5
$41,964
9
$193,830
Aggregated Statistics For Year 1999 (Based on 1 full and 2 partial tracts)
A) FHA, FSA/RHS & VA Home Purchase Loans
B) Conventional Home Purchase Loans
C) Refinancings
D) Home Improvement Loans
F) Non-occupant Loans on < 5 Family Dwellings (A B C & D)

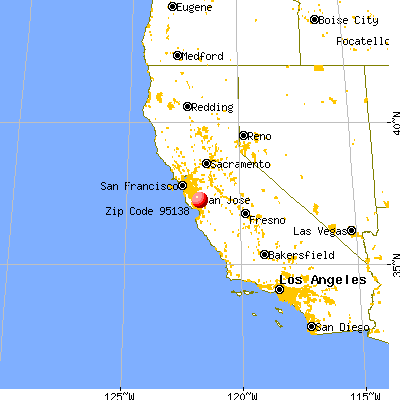


 Nearest zip codes: 95013, 95139, 95119, 95135, 95121, 95123.