Estimated zip code population in 2022: 9,771 Zip code population in 2010: 9,372 Zip code population in 2000: 10,170
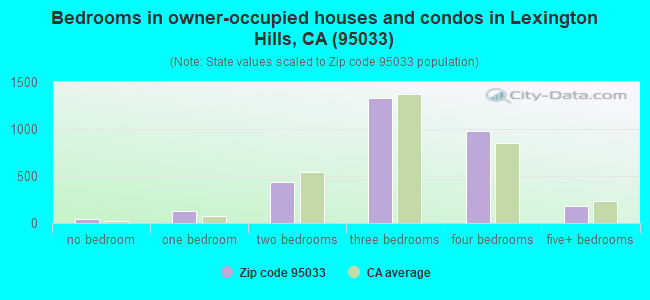
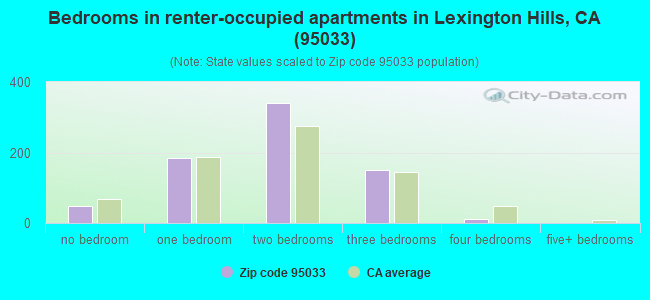
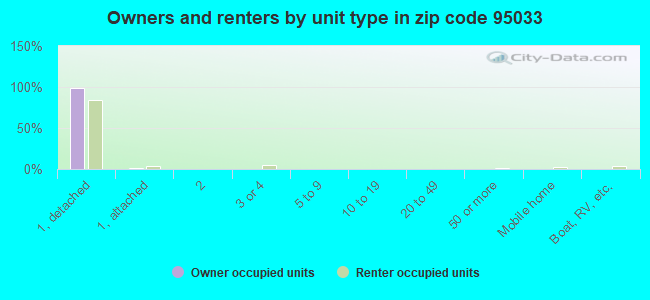
Houses and condos: 4,291 Renter-occupied apartments: 736
% of renters here:
19%
State:
44%
March 2022 cost of living index in zip code 95033: 110.1 (more than average, U.S. average is 100)
Land area: 91.6 sq. mi. Water area: 0.7 sq. mi.
Population density: 107 people per square mile
(very low).
OSM Map
General Map
Google Map
MSN Map
OSM Map
General Map
Google Map
MSN Map
OSM Map
General Map
Google Map
MSN Map
OSM Map
General Map
Google Map
MSN Map
Please wait while loading the map...
Real estate property taxes paid for housing units in 2022:
This zip code:
0.7% ($10,292)
California:
0.7% ($4,831)
Median real estate property taxes paid for housing units with mortgages in 2022: $10,330 (0.7%) Median real estate property taxes paid for housing units with no mortgage in 2022: $9,016 (0.6%)
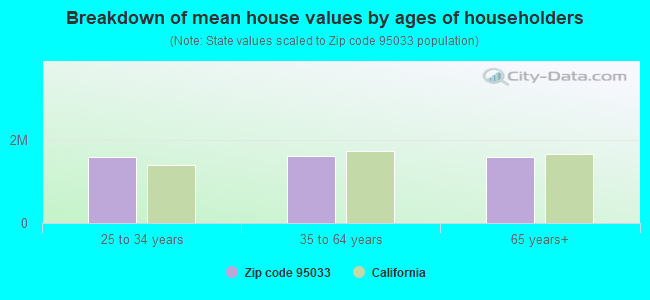
Estimated median house/condo value in 2022: $1,425,285
95033:
$1,425,285
California:
$715,900
According to our research of California and other state lists, there were 9 registered sex offenders living in 95033 zip code as of May 19, 2024. The ratio of all residents to sex offenders in zip code 95033 is 1,128 to 1. The ratio of registered sex offenders to all residents in this zip code is lower than the state average.
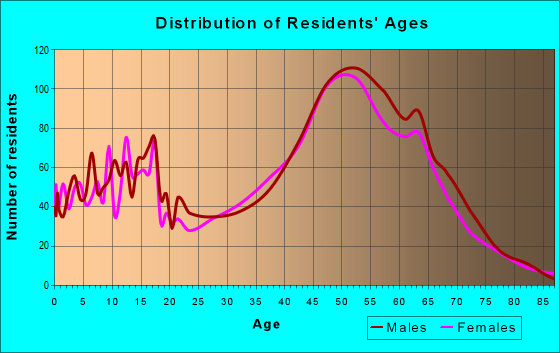
Median resident age:
This zip code:
47.7 years
California median age:
37.9 years
Average household size:
This zip code:
2.5 people
California:
2.8 people
Averages for the 2020 tax year for zip code 95033, filed in 2021:
Average Adjusted Gross Income (AGI) in 2020: $238,704 (Individual Income Tax Returns)
Here:
$238,704
State:
$95,910
Salary/wage: $221,034 (reported on 75.9% of returns)
Here:
$221,034
State:
$77,331
(% of AGI for various income ranges: 1064.0% for AGIs below $25k, 3989.3% for AGIs $25k-50k, 6852.9% for AGIs $50k-75k, 11058.8% for AGIs $75k-100k, 20651.3% for AGIs $100k-200k, 182817.8% for AGIs over 200k)
Taxable interest for individuals: $2,520 (reported on 57.1% of returns)
This zip code:
$2,520
California:
$2,294
(% of AGI for various income ranges: 47.9% for AGIs below $25k, 82.2% for AGIs $25k-50k, 70.8% for AGIs $50k-75k, 146.5% for AGIs $75k-100k, 411.8% for AGIs $100k-200k, 1154.7% for AGIs over 200k)
Ordinary dividends: $11,679 (reported on 48.9% of returns)
Here:
$11,679
State:
$10,949
(% of AGI for various income ranges: 142.1% for AGIs below $25k, 234.1% for AGIs $25k-50k, 250.8% for AGIs $50k-75k, 466.5% for AGIs $75k-100k, 1231.5% for AGIs $100k-200k, 5302.5% for AGIs over 200k)
Net capital gain/loss in AGI: +$58,647 (reported on 49.4% of returns)
Here:
+$58,647
State:
+$49,306
(% of AGI for various income ranges: 39.8% for AGIs below $25k, 219.6% for AGIs $25k-50k, 241.7% for AGIs $50k-75k, 500.6% for AGIs $75k-100k, 1795.6% for AGIs $100k-200k, 35796.2% for AGIs over 200k)
Profit/loss from business: +$34,042 (reported on 21.8% of returns)
Here:
+$34,042
State:
+$15,671
(% of AGI for various income ranges: 221.4% for AGIs below $25k, 577.4% for AGIs $25k-50k, 818.8% for AGIs $50k-75k, 1060.6% for AGIs $75k-100k, 1770.8% for AGIs $100k-200k, 5773.1% for AGIs over 200k)
Taxable individual retirement arrangement distribution: $29,645 (reported on 12.4% of returns)
95033:
$29,645
California:
$23,505
(% of AGI for various income ranges: 54.9% for AGIs below $25k, 241.1% for AGIs $25k-50k, 351.2% for AGIs $50k-75k, 703.5% for AGIs $75k-100k, 1288.7% for AGIs $100k-200k, 2425.0% for AGIs over 200k)
Self-employed (Keogh) retirement plans: $26,733 (reported on 2.8% of returns)
95033:
$26,733
California:
$30,163
(% of AGI for various income ranges: 107.8% for AGIs $25k-50k, 110.5% for AGIs $100k-200k, 776.9% for AGIs over 200k)
Total itemized deductions: $43,013 (reported on 34.0% of returns)
Here:
$43,013
State:
$39,517
(% of AGI for various income ranges: 311.4% for AGIs below $25k, 504.4% for AGIs $25k-50k, 877.5% for AGIs $50k-75k, 1889.4% for AGIs $75k-100k, 3082.8% for AGIs $100k-200k, 13227.2% for AGIs over 200k)
Charity contributions: $13,075 (reported on 26.9% of returns)
Here:
$13,075
State:
$12,598
(% of AGI for various income ranges: 7.7% for AGIs below $25k, 24.1% for AGIs $25k-50k, 69.6% for AGIs $50k-75k, 117.1% for AGIs $75k-100k, 354.9% for AGIs $100k-200k, 4121.2% for AGIs over 200k)
Taxes paid: $9,623 (reported on 33.7% of returns)
95033:
$9,623
State:
$8,807
(% of AGI for various income ranges: 74.0% for AGIs below $25k, 116.7% for AGIs $25k-50k, 206.7% for AGIs $50k-75k, 466.5% for AGIs $75k-100k, 856.2% for AGIs $100k-200k, 2686.2% for AGIs over 200k)
Earned income credit: $1,241 (reported on 4.0% of returns)
Here:
$1,241
State:
$2,074
(% of AGI for various income ranges: 29.3% for AGIs below $25k, 31.5% for AGIs $25k-50k)
Percentage of individuals using paid preparers for their 2020 taxes: 91.1%
Here:
91%
State:
92%
(% for various income ranges: 88.5% for AGIs below $25k, 87.8% for AGIs $25k-50k, 92.7% for AGIs $50k-75k, 88.6% for AGIs $75k-100k, 92.2% for AGIs $100k-200k, 93.3% for AGIs over 200k)
Averages for the 2012 tax year for zip code 95033, filed in 2013:
Average Adjusted Gross Income (AGI) in 2012: $171,167 (Individual Income Tax Returns)
Here:
$171,167
State:
$72,726
Salary/wage: $144,633 (reported on 77.9% of returns)
Here:
$144,633
State:
$59,079
(% of AGI for various income ranges: 63.6% for AGIs below $25k, 63.6% for AGIs $25k-50k, 60.0% for AGIs $50k-75k, 58.1% for AGIs $75k-100k, 73.2% for AGIs $100k-200k, 64.7% for AGIs over 200k)
Taxable interest for individuals: $2,147 (reported on 55.2% of returns)
This zip code:
$2,147
California:
$2,146
(% of AGI for various income ranges: 2.6% for AGIs below $25k, 1.2% for AGIs $25k-50k, 1.5% for AGIs $50k-75k, 1.2% for AGIs $75k-100k, 0.6% for AGIs $100k-200k, 0.6% for AGIs over 200k)
Ordinary dividends: $16,157 (reported on 43.6% of returns)
Here:
$16,157
State:
$9,308
(% of AGI for various income ranges: 5.1% for AGIs below $25k, 4.1% for AGIs $25k-50k, 3.1% for AGIs $50k-75k, 2.7% for AGIs $75k-100k, 2.4% for AGIs $100k-200k, 4.7% for AGIs over 200k)
Net capital gain/loss in AGI: +$26,125 (reported on 41.7% of returns)
Here:
+$26,125
State:
+$30,460
(% of AGI for various income ranges: 1.5% for AGIs below $25k, 1.4% for AGIs $50k-75k, 1.3% for AGIs $75k-100k, 1.8% for AGIs $100k-200k, 8.7% for AGIs over 200k)
Profit/loss from business: +$32,005 (reported on 25.7% of returns)
Here:
+$32,005
State:
+$17,064
(% of AGI for various income ranges: 14.7% for AGIs below $25k, 12.6% for AGIs $25k-50k, 9.5% for AGIs $50k-75k, 9.5% for AGIs $75k-100k, 5.3% for AGIs $100k-200k, 3.6% for AGIs over 200k)
Taxable individual retirement arrangement distribution: $25,353 (reported on 13.9% of returns)
95033:
$25,353
California:
$19,557
(% of AGI for various income ranges: 3.9% for AGIs below $25k, 5.2% for AGIs $25k-50k, 4.0% for AGIs $50k-75k, 4.7% for AGIs $75k-100k, 3.2% for AGIs $100k-200k, 1.3% for AGIs over 200k)
Self-employment retirement plans: $22,793 (reported on 3.4% of returns)
95033:
$22,793
California:
$24,530
(% of AGI for various income ranges: 1.2% for AGIs $25k-50k, 0.5% for AGIs $100k-200k, 0.5% for AGIs over 200k)
Total itemized deductions: $50,402 (19% of AGI, reported on 60.4% of returns)
Here:
$50,402
State:
$34,004
Here:
19.4% of AGI
State:
22.7% of AGI
(% of AGI for various income ranges: 25.2% for AGIs below $25k, 18.5% for AGIs $25k-50k, 21.5% for AGIs $50k-75k, 20.9% for AGIs $75k-100k, 21.2% for AGIs $100k-200k, 16.2% for AGIs over 200k)
Charity contributions: $4,690 (reported on 50.1% of returns)
Here:
$4,690
State:
$4,659
(% of AGI for various income ranges: 0.8% for AGIs below $25k, 1.5% for AGIs $25k-50k, 1.5% for AGIs $50k-75k, 1.7% for AGIs $75k-100k, 1.6% for AGIs $100k-200k, 1.3% for AGIs over 200k)
Taxes paid: $27,164 (reported on 59.7% of returns)
95033:
$27,164
State:
$14,448
(% of AGI for various income ranges: 5.9% for AGIs below $25k, 4.8% for AGIs $25k-50k, 5.5% for AGIs $50k-75k, 7.5% for AGIs $75k-100k, 9.1% for AGIs $100k-200k, 10.2% for AGIs over 200k)
Earned income credit: $1,114 (reported on 5.3% of returns)
Here:
$1,114
State:
$2,286
(% of AGI for various income ranges: 1.7% for AGIs below $25k, 0.3% for AGIs $25k-50k)
Percentage of individuals using paid preparers for their 2012 taxes: 53.0%
Here:
53%
State:
64%
(% for various income ranges: 39.8% for AGIs below $25k, 50.9% for AGIs $25k-50k, 52.4% for AGIs $50k-75k, 54.3% for AGIs $75k-100k, 58.3% for AGIs $100k-200k, 62.9% for AGIs over 200k)
Averages for the 2004 tax year for zip code 95033, filed in 2005:
Average Adjusted Gross Income (AGI) in 2004: $109,107 (Individual Income Tax Returns)
Here:
$109,107
State:
$58,600
Salary/wage: $101,166 (reported on 78.2% of returns)
Here:
$101,166
State:
$49,455
(% of AGI for various income ranges: 63.8% for AGIs $10k-25k, 69.9% for AGIs $25k-50k, 69.1% for AGIs $50k-75k, 69.5% for AGIs $75k-100k, 71.8% for AGIs over 100k)
Taxable interest for individuals: $3,143 (reported on 65.7% of returns)
This zip code:
$3,143
California:
$2,365
(% of AGI for various income ranges: 4.4% for AGIs $10k-25k, 2.3% for AGIs $25k-50k, 1.7% for AGIs $50k-75k, 2.0% for AGIs $75k-100k, 1.7% for AGIs over 100k)
Taxable dividends: $5,323 (reported on 48.4% of returns)
Here:
$5,323
State:
$4,746
(% of AGI for various income ranges: 4.5% for AGIs $10k-25k, 3.5% for AGIs $25k-50k, 2.2% for AGIs $50k-75k, 2.4% for AGIs $75k-100k, 2.1% for AGIs over 100k)
Net capital gain/loss: +$16,739 (reported on 46.0% of returns)
Here:
+$16,739
State:
+$23,418
(% of AGI for various income ranges: 0.7% for AGIs $10k-25k, 0.7% for AGIs $25k-50k, 1.0% for AGIs $50k-75k, 1.0% for AGIs $75k-100k, 8.5% for AGIs over 100k)
Profit/loss from business: +$25,969 (reported on 28.5% of returns)
Here:
+$25,969
State:
+$16,826
(% of AGI for various income ranges: 14.3% for AGIs $10k-25k, 12.1% for AGIs $25k-50k, 9.9% for AGIs $50k-75k, 11.3% for AGIs $75k-100k, 5.3% for AGIs over 100k)
IRA payment deduction: $3,604 (reported on 4.3% of returns)
95033:
$3,604
California:
$3,192
(% of AGI for various income ranges: 0.5% for AGIs $10k-25k, 0.4% for AGIs $25k-50k, 0.3% for AGIs $50k-75k, 0.3% for AGIs $75k-100k, 0.1% for AGIs over 100k)
Self-employed pension: $15,415 (reported on 5.0% of returns)
Here:
$15,415
California:
$17,688
(% of AGI for various income ranges: 0.6% for AGIs $25k-50k, 0.7% for AGIs $50k-75k, 1.4% for AGIs $75k-100k, 0.7% for AGIs over 100k)
Total itemized deductions: $40,488 (25% of AGI, reported on 60.5% of returns)
Here:
$40,488
State:
$28,113
Here:
24.8% of AGI
State:
25.3% of AGI
(% of AGI for various income ranges: 34.1% for AGIs $10k-25k, 24.7% for AGIs $25k-50k, 26.0% for AGIs $50k-75k, 24.8% for AGIs $75k-100k, 20.9% for AGIs over 100k)
Charity contributions deductions: $3,777 (2% of AGI, reported on 54.0% of returns)
Here:
$3,777
State:
$3,923
Here:
2.2% of AGI
State:
3.3% of AGI
(% of AGI for various income ranges: 1.6% for AGIs $10k-25k, 1.9% for AGIs $25k-50k, 1.8% for AGIs $50k-75k, 2.3% for AGIs $75k-100k, 1.8% for AGIs over 100k)
Total tax: $22,647 (reported on 85.9% of returns)
95033:
$22,647
State:
$10,761
(% of AGI for various income ranges: 6.3% for AGIs $10k-25k, 9.0% for AGIs $25k-50k, 10.6% for AGIs $50k-75k, 11.6% for AGIs $75k-100k, 19.6% for AGIs over 100k)
Earned income credit: $902 (reported on 4.3% of returns)
Here:
$902
State:
$1,763
Percentage of individuals using paid preparers for their 2004 taxes: 55.7%
Here:
56%
State:
66%
(% for various income ranges: 44.5% for AGIs below $10k, 47.3% for AGIs $10k-25k, 48.9% for AGIs $25k-50k, 58.1% for AGIs $50k-75k, 61.1% for AGIs $75k-100k, 64.2% for AGIs over 100k)
Likely homosexual households (counted as self-reported same-sex unmarried-partner households)
Lesbian couples: 0.2% of all households
Gay men: 0.0% of all households
Household received Food Stamps/SNAP in the past 12 months: 71 Household did not receive Food Stamps/SNAP in the past 12 months: 3,668
Women who had a birth in the past 12 months: 92 (92 now married, 0 unmarried) Women who did not have a birth in the past 12 months: 1,745 (981 now married, 752 unmarried)
Housing units in zip code 95033 with a mortgage: 2,320 (295 second mortgage, 244 both second mortgage and home equity loan) Houses without a mortgage: 64
Median monthly owner costs for units with a mortgage: $3,876 Median monthly owner costs for units without a mortgage: $1,215
Residents with income below the poverty level in 2022:
This zip code:
2.8%
Whole state:
12.2%
Residents with income below 50% of the poverty level in 2022:
This zip code:
0.4%
Whole state:
6.2%
Median number of rooms in houses and condos:
Here:
6.4
State:
6.0
Median number of rooms in apartments:
Here:
4.0
State:
3.9
Notable locations in this zip code not listed on our city pages
Notable locations in zip code 95033: Burrell Guard Station (A), Burrell School (B), Wrights (C), Uncle Billys Cabin (D), Spanish Ranch (E), Skyline Ranch (F), Saratoga Summit Ranger Station (G), Mount Bielawski Lookout (H), David Bruce Winery (I), Bynington Winery (J), Gilman Ranch (K), Future Farmers of America Camp (L), Felton Guard Station (M), Fidel Ranch (N), White Rock Ranch (O), Department of Forestry and Fire Protection Station 13 Alma (P), Zayante Fire Protection District Station 3 (Q), Santa Clara County Fire Department Redwood Fire Station (R). Display/hide their locations on the map
Lakes and reservoirs: Laguna del Sargento (A), Williams Reservoir (B), Lake Elsman (C), Lexington Reservoir (D), Lake Couzzens (E), Howell Reservoir (F). Display/hide their locations on the map
Creeks: Black Creek (A), Briggs Creek (B), Burns Creek (C), Gold Mine Creek (D), Hendrys Creek (E), Indian Cabin Creek (F), Indian Creek (G), Laurel Creek (H), Trout Creek (I). Display/hide their locations on the map
In group quarters: 72 (-1 institutionalized population)
Size of family households: 1,329 2-persons, 637 3-persons, 416 4-persons, 209 5-persons, 95 6-persons, 27 7-or-more-persons
Size of nonfamily households: 617 1-person, 495 2-persons, 15 5-persons
1,480 married couples with children.
168 single-parent households (80 men, 88 women).
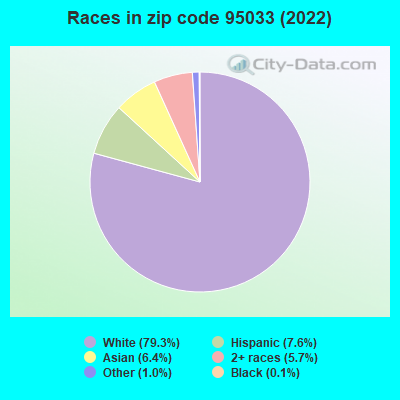
86.8% of residents of 95033 zip code speak English at home.
3.9% of residents speak Spanish at home (81% very well, 12% well, 7% not well).
5.4% of residents speak other Indo-European language at home (85% very well, 9% well, 5% not well, 1% not at all).
3.3% of residents speak Asian or Pacific Island language at home (82% very well, 6% well, 9% not well, 3% not at all).
0.4% of residents speak other language at home (100% very well).
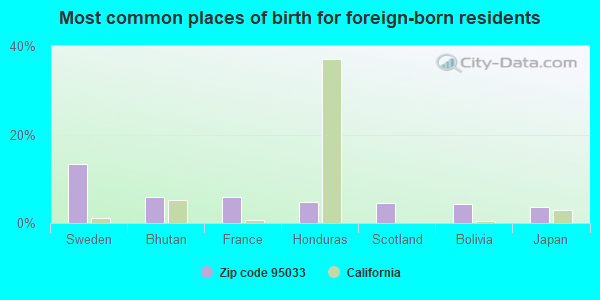
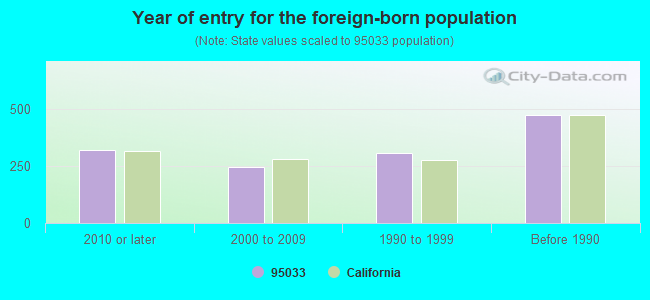
Foreign born population: 1,258 (12.9%) (61.4% of them are naturalized citizens)
Housing units lacking complete plumbing facilities: 2.1% Housing units lacking complete kitchen facilities: 2.0%
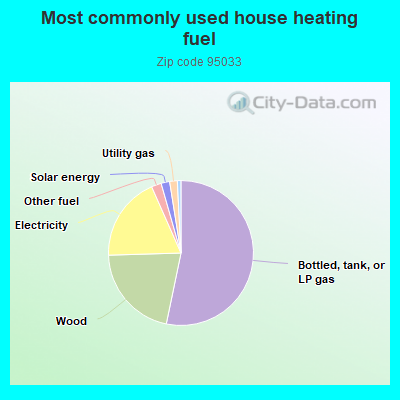
53.1%Bottled, tank, or LP gas
21.2%Wood
18.8%Electricity
2.2%Other fuel
1.9%Solar energy
1.7%Utility gas
0.8%Fuel oil, kerosene, etc.
Place of birth for U.S.-born residents:
This state: 5,535
Northeast: 954
Midwest: 607
South: 616
West: 659
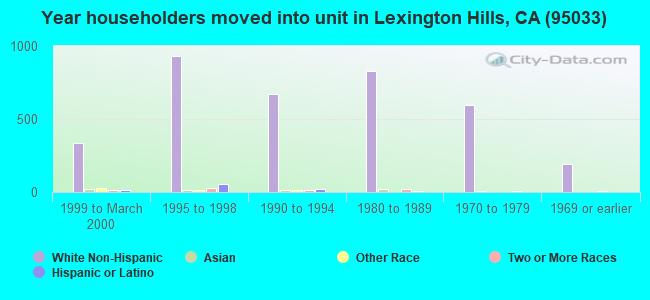
67% of the 95033 zip code residents lived in the same house 5 years ago. Out of people who lived in different houses, 39% lived in this county. Out of people who lived in different counties, 50% lived in California.
91% of the 95033 zip code residents lived in the same house 1 year ago. Out of people who lived in different houses, 26% moved from this county. Out of people who lived in different houses, 61% moved from different county within same state. Out of people who lived in different houses, 14% moved from different state. Out of people who lived in different houses, 2% moved from abroad.
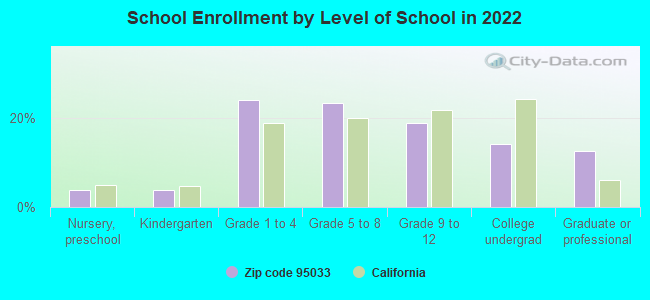
Private vs. public school enrollment:
Students in private schools in grades 1 to 8 (elementary and middle school): 189
Here:
18.8%
California:
10.5%
Students in private schools in grades 9 to 12 (high school): 10
Here:
2.7%
California:
8.5%
Students in private undergraduate colleges: 27
Here:
9.2%
California:
15.9%
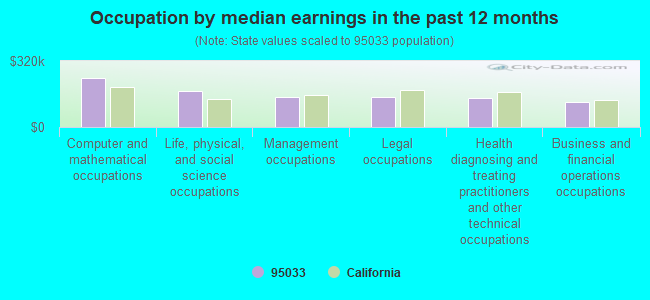
Occupation by median earnings in the past 12 months ($)
235,230Computer and mathematical occupations
176,089Life, physical, and social science occupations
147,274Management occupations
146,234Legal occupations
140,181Health diagnosing and treating practitioners and other technical occupations
119,349Business and financial operations occupations
Companies with federal contracts located in this zip code:
LIONHEARTH TECHNOLOGIES, INC (25401 SPANISH RANCH RD in LOS GATOS, CA; small business) : $880,000 in 3 contractsfrom 1999 to 2000
$365,000 with Army for Defense Tank - Automotive -- Advanced Development (R&D). Signed on 2000-11-17. Completion date: 2001-12-31.
$365,000, same as above.Signed on 1999-12-14. Completion date: 2001-12-31.
$150,000 with Army for Other Defense -- Applied Research and Exploratory Development (R&D). Signed on 1999-12-06. Completion date: 2000-12-31.
9X MEDIA, INC (20711 BEAR CREEK RD in LOS GATOS, CA; small business) : $341,647 in 18 contractsfrom 2002 to 2005
Contracts for ADP Components, ADP Central Processing Unit (CPU, Computer), Digital, ADP Support Equipment, Miscellaneous Electrical and Electronic Components, and moreby U.S. Army Corps of Engineers - civil program financing only, Navy, Department of Veterans Affairs, Air Force, and others Signed by year:2000: $0; 2001: $0; 2002: $80,300; 2003: $64,984; 2004: $23,128; 2005: $173,235; 2006: $0.
Biggest contracts:
$80,300 with U.S. Army Corps of Engineers - civil program financing only for ADP Components. Signed on 2002-08-26. Completion date: 2002-09-26.
$47,934 with Navy for ADP Components. Signed on 2005-02-03. Completion date: 2005-03-03.
$44,000 with Department of Veterans Affairs for ADP Central Processing Unit (CPU, Computer), Digital. Signed on 2005-09-27. Completion date: 2005-11-11.
$30,347 with Air Force for ADP Support Equipment. Signed on 2005-01-07. Completion date: 2005-03-07.
MANUFACTURING AND TEST CO INC (15000 STETSON RD in LOS GATOS, CA; small business) : $51,337 in 2 contractsfrom 2002 to 2004
$26,960 with Army for ADP Input/Output and Storage Devices. Signed on 2002-05-31. Completion date: 2002-06-14.
$24,377 with Army for ADP Support Equipment. Taking place in NM. Signed on 2004-07-01. Completion date: 2004-07-31.
Top industries in this zip code by the number of employees in 2005:
Professional, Scientific, and Technical Services: Computer Systems Design Services (50-99 employees: 1 establishment, 1-4 employees: 7 establishments)
2005 - 2018 National Fire Incident Reporting System (NFIRS) incidents
According to the data from the years 2005 - 2018 the average number of fire incidents per year is 42. The highest number of fire incidents - 111 took place in 2008, and the least - 11 in 2006. The data has a growing trend.
When looking into fire subcategories, the most incidents belonged to: Outside Fires (41.0%), and Mobile Property/Vehicle Fires (29.7%).
Fire incident types reported to NFIRS in Zip Code 95033
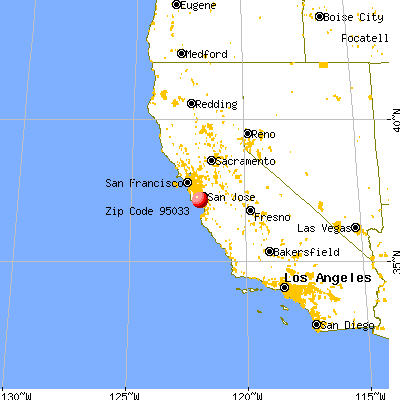


 Nearest zip codes: 95030, 95032, 95066, 95070, 95124, 95018.


 : $880,000 in 3 contracts from 1999 to 2000
 According to the data from the years 2005 - 2018 the average number of fire incidents per year is 42. The highest number of fire incidents - 111 took place in 2008, and the least - 11 in 2006. The data has a growing trend.
 When looking into fire subcategories, the most incidents belonged to: Outside Fires (41.0%), and Mobile Property/Vehicle Fires (29.7%).