Estimated zip code population in 2022: 24,965 Zip code population in 2010: 20,596 Zip code population in 2000: 21,093
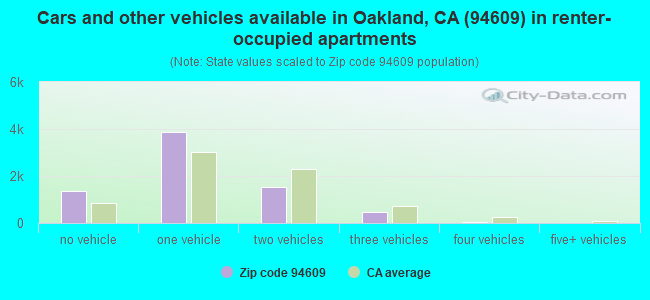
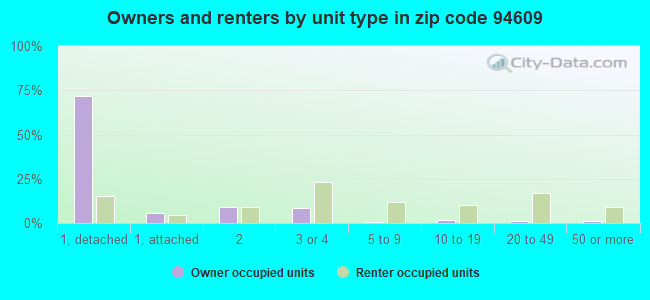
Houses and condos: 11,701 Renter-occupied apartments: 7,254
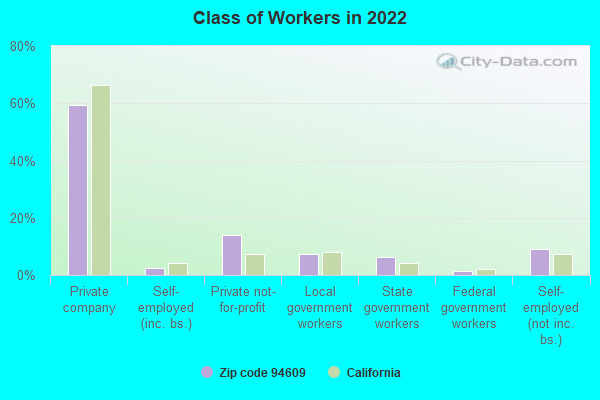
% of renters here:
67%
State:
44%
March 2022 cost of living index in zip code 94609: 122.4 (high, U.S. average is 100)
Land area: 1.7 sq. mi. Water area: 0.0 sq. mi.
Population density: 14,619 people per square mile
(very high).
OSM Map
General Map
Google Map
MSN Map
OSM Map
General Map
Google Map
MSN Map
OSM Map
General Map
Google Map
MSN Map
OSM Map
General Map
Google Map
MSN Map
Please wait while loading the map...
Real estate property taxes paid for housing units in 2022:
This zip code:
0.8% ($9,476)
California:
0.7% ($4,831)
Median real estate property taxes paid for housing units with mortgages in 2022: $10,326 (0.8%) Median real estate property taxes paid for housing units with no mortgage in 2022: $6,614 (0.6%)
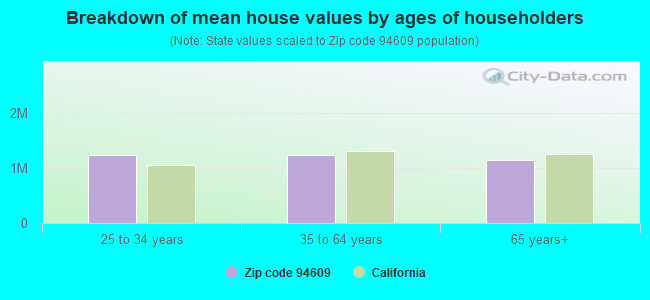
Estimated median house/condo value in 2022: $1,191,393
94609:
$1,191,393
California:
$715,900
According to our research of California and other state lists, there were 16 registered sex offenders living in 94609 zip code as of May 04, 2024. The ratio of all residents to sex offenders in zip code 94609 is 1,416 to 1. The ratio of registered sex offenders to all residents in this zip code is lower than the state average.
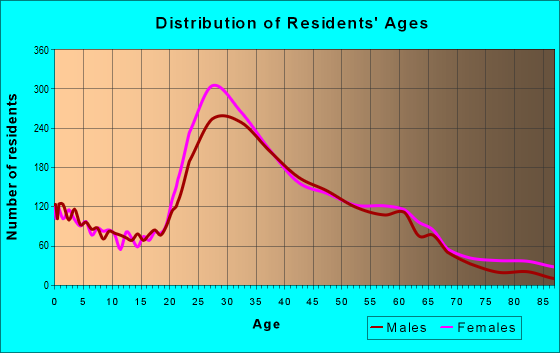
Median resident age:
This zip code:
36.0 years
California median age:
37.9 years
Average household size:
This zip code:
2.3 people
California:
2.8 people
Averages for the 2020 tax year for zip code 94609, filed in 2021:
Average Adjusted Gross Income (AGI) in 2020: $104,904 (Individual Income Tax Returns)
Here:
$104,904
State:
$95,910
Salary/wage: $96,455 (reported on 83.9% of returns)
Here:
$96,455
State:
$77,331
(% of AGI for various income ranges: 1113.8% for AGIs below $25k, 4089.0% for AGIs $25k-50k, 7903.9% for AGIs $50k-75k, 12215.0% for AGIs $75k-100k, 21437.6% for AGIs $100k-200k, 131098.1% for AGIs over 200k)
Taxable interest for individuals: $1,012 (reported on 36.6% of returns)
This zip code:
$1,012
California:
$2,294
(% of AGI for various income ranges: 12.8% for AGIs below $25k, 29.6% for AGIs $25k-50k, 29.1% for AGIs $50k-75k, 65.1% for AGIs $75k-100k, 84.2% for AGIs $100k-200k, 556.7% for AGIs over 200k)
Ordinary dividends: $5,004 (reported on 28.9% of returns)
Here:
$5,004
State:
$10,949
(% of AGI for various income ranges: 32.1% for AGIs below $25k, 58.6% for AGIs $25k-50k, 115.6% for AGIs $50k-75k, 202.7% for AGIs $75k-100k, 381.9% for AGIs $100k-200k, 2478.6% for AGIs over 200k)
Net capital gain/loss in AGI: +$25,030 (reported on 27.6% of returns)
Here:
+$25,030
State:
+$49,306
(% of AGI for various income ranges: 18.2% for AGIs below $25k, 66.2% for AGIs $25k-50k, 132.0% for AGIs $50k-75k, 285.1% for AGIs $75k-100k, 681.3% for AGIs $100k-200k, 20221.7% for AGIs over 200k)
Profit/loss from business: +$17,245 (reported on 23.4% of returns)
Here:
+$17,245
State:
+$15,671
(% of AGI for various income ranges: 248.7% for AGIs below $25k, 371.1% for AGIs $25k-50k, 408.8% for AGIs $50k-75k, 650.5% for AGIs $75k-100k, 1064.7% for AGIs $100k-200k, 4631.9% for AGIs over 200k)
Taxable individual retirement arrangement distribution: $15,078 (reported on 4.7% of returns)
94609:
$15,078
California:
$23,505
(% of AGI for various income ranges: 33.5% for AGIs below $25k, 42.0% for AGIs $25k-50k, 81.6% for AGIs $50k-75k, 138.3% for AGIs $75k-100k, 281.4% for AGIs $100k-200k, 561.7% for AGIs over 200k)
Self-employed (Keogh) retirement plans: $23,159 (reported on 1.8% of returns)
94609:
$23,159
California:
$30,163
(% of AGI for various income ranges: 14.9% for AGIs $25k-50k, 41.8% for AGIs $50k-75k, 96.5% for AGIs $100k-200k, 883.6% for AGIs over 200k)
Total itemized deductions: $32,672 (reported on 14.5% of returns)
Here:
$32,672
State:
$39,517
(% of AGI for various income ranges: 69.5% for AGIs below $25k, 155.3% for AGIs $25k-50k, 345.4% for AGIs $50k-75k, 626.8% for AGIs $75k-100k, 1345.2% for AGIs $100k-200k, 8405.0% for AGIs over 200k)
Charity contributions: $8,613 (reported on 11.8% of returns)
Here:
$8,613
State:
$12,598
(% of AGI for various income ranges: 5.4% for AGIs below $25k, 19.4% for AGIs $25k-50k, 49.7% for AGIs $50k-75k, 90.8% for AGIs $75k-100k, 185.3% for AGIs $100k-200k, 2425.6% for AGIs over 200k)
Taxes paid: $8,998 (reported on 14.4% of returns)
94609:
$8,998
State:
$8,807
(% of AGI for various income ranges: 15.2% for AGIs below $25k, 33.2% for AGIs $25k-50k, 96.6% for AGIs $50k-75k, 201.2% for AGIs $75k-100k, 451.9% for AGIs $100k-200k, 2002.8% for AGIs over 200k)
Earned income credit: $1,564 (reported on 10.7% of returns)
Here:
$1,564
State:
$2,074
(% of AGI for various income ranges: 76.1% for AGIs below $25k, 40.3% for AGIs $25k-50k)
Percentage of individuals using paid preparers for their 2020 taxes: 93.2%
Here:
93%
State:
92%
(% for various income ranges: 90.8% for AGIs below $25k, 92.8% for AGIs $25k-50k, 93.4% for AGIs $50k-75k, 94.0% for AGIs $75k-100k, 94.4% for AGIs $100k-200k, 95.8% for AGIs over 200k)
Averages for the 2012 tax year for zip code 94609, filed in 2013:
Average Adjusted Gross Income (AGI) in 2012: $52,331 (Individual Income Tax Returns)
Here:
$52,331
State:
$72,726
Salary/wage: $49,380 (reported on 85.2% of returns)
Here:
$49,380
State:
$59,079
(% of AGI for various income ranges: 74.7% for AGIs below $25k, 84.6% for AGIs $25k-50k, 83.3% for AGIs $50k-75k, 82.6% for AGIs $75k-100k, 83.2% for AGIs $100k-200k, 69.9% for AGIs over 200k)
Taxable interest for individuals: $664 (reported on 31.6% of returns)
This zip code:
$664
California:
$2,146
(% of AGI for various income ranges: 0.6% for AGIs below $25k, 0.4% for AGIs $25k-50k, 0.3% for AGIs $50k-75k, 0.5% for AGIs $75k-100k, 0.3% for AGIs $100k-200k, 0.4% for AGIs over 200k)
Ordinary dividends: $3,105 (reported on 18.7% of returns)
Here:
$3,105
State:
$9,308
(% of AGI for various income ranges: 1.4% for AGIs below $25k, 0.7% for AGIs $25k-50k, 0.9% for AGIs $50k-75k, 1.0% for AGIs $75k-100k, 1.0% for AGIs $100k-200k, 1.9% for AGIs over 200k)
Net capital gain/loss in AGI: +$7,411 (reported on 15.5% of returns)
Here:
+$7,411
State:
+$30,460
(% of AGI for various income ranges: 0.3% for AGIs below $25k, 0.4% for AGIs $25k-50k, 0.7% for AGIs $50k-75k, 1.6% for AGIs $75k-100k, 1.4% for AGIs $100k-200k, 8.6% for AGIs over 200k)
Profit/loss from business: +$15,865 (reported on 22.7% of returns)
Here:
+$15,865
State:
+$17,064
(% of AGI for various income ranges: 14.0% for AGIs below $25k, 6.4% for AGIs $25k-50k, 5.5% for AGIs $50k-75k, 5.9% for AGIs $75k-100k, 6.4% for AGIs $100k-200k, 6.3% for AGIs over 200k)
Taxable individual retirement arrangement distribution: $13,389 (reported on 4.0% of returns)
94609:
$13,389
California:
$19,557
(% of AGI for various income ranges: 1.2% for AGIs below $25k, 0.7% for AGIs $25k-50k, 1.0% for AGIs $50k-75k, 1.0% for AGIs $75k-100k, 1.1% for AGIs $100k-200k, 1.2% for AGIs over 200k)
Self-employment retirement plans: $14,061 (reported on 1.6% of returns)
94609:
$14,061
California:
$24,530
(% of AGI for various income ranges: 0.2% for AGIs $25k-50k, 0.3% for AGIs $50k-75k, 0.3% for AGIs $75k-100k, 0.5% for AGIs $100k-200k, 1.0% for AGIs over 200k)
Total itemized deductions: $23,671 (22% of AGI, reported on 26.4% of returns)
Here:
$23,671
State:
$34,004
Here:
21.9% of AGI
State:
22.7% of AGI
(% of AGI for various income ranges: 7.0% for AGIs below $25k, 6.1% for AGIs $25k-50k, 10.1% for AGIs $50k-75k, 13.4% for AGIs $75k-100k, 16.6% for AGIs $100k-200k, 15.1% for AGIs over 200k)
Charity contributions: $2,532 (reported on 19.8% of returns)
Here:
$2,532
State:
$4,659
(% of AGI for various income ranges: 0.3% for AGIs below $25k, 0.6% for AGIs $25k-50k, 0.9% for AGIs $50k-75k, 1.2% for AGIs $75k-100k, 1.0% for AGIs $100k-200k, 1.5% for AGIs over 200k)
Taxes paid: $10,390 (reported on 26.1% of returns)
94609:
$10,390
State:
$14,448
(% of AGI for various income ranges: 1.4% for AGIs below $25k, 1.4% for AGIs $25k-50k, 3.3% for AGIs $50k-75k, 5.9% for AGIs $75k-100k, 7.9% for AGIs $100k-200k, 8.7% for AGIs over 200k)
Earned income credit: $1,464 (reported on 15.9% of returns)
Here:
$1,464
State:
$2,286
(% of AGI for various income ranges: 4.0% for AGIs below $25k, 0.3% for AGIs $25k-50k)
Percentage of individuals using paid preparers for their 2012 taxes: 40.8%
Here:
41%
State:
64%
(% for various income ranges: 39.0% for AGIs below $25k, 36.1% for AGIs $25k-50k, 41.5% for AGIs $50k-75k, 42.9% for AGIs $75k-100k, 50.4% for AGIs $100k-200k, 68.8% for AGIs over 200k)
Averages for the 2004 tax year for zip code 94609, filed in 2005:
Average Adjusted Gross Income (AGI) in 2004: $38,628 (Individual Income Tax Returns)
Here:
$38,628
State:
$58,600
Salary/wage: $37,203 (reported on 85.2% of returns)
Here:
$37,203
State:
$49,455
(% of AGI for various income ranges: 112.9% for AGIs below $10k, 79.4% for AGIs $10k-25k, 86.1% for AGIs $25k-50k, 85.7% for AGIs $50k-75k, 86.2% for AGIs $75k-100k, 72.5% for AGIs over 100k)
Taxable interest for individuals: $891 (reported on 36.3% of returns)
This zip code:
$891
California:
$2,365
(% of AGI for various income ranges: 4.1% for AGIs below $10k, 1.0% for AGIs $10k-25k, 0.7% for AGIs $25k-50k, 0.7% for AGIs $50k-75k, 0.7% for AGIs $75k-100k, 0.8% for AGIs over 100k)
Taxable dividends: $1,936 (reported on 18.9% of returns)
Here:
$1,936
State:
$4,746
(% of AGI for various income ranges: 4.1% for AGIs below $10k, 0.9% for AGIs $10k-25k, 0.7% for AGIs $25k-50k, 0.9% for AGIs $50k-75k, 0.9% for AGIs $75k-100k, 1.1% for AGIs over 100k)
Net capital gain/loss: +$7,178 (reported on 15.3% of returns)
Here:
+$7,178
State:
+$23,418
(% of AGI for various income ranges: -1.6% for AGIs below $10k, 0.5% for AGIs $10k-25k, 0.4% for AGIs $25k-50k, 0.9% for AGIs $50k-75k, 1.3% for AGIs $75k-100k, 8.9% for AGIs over 100k)
Profit/loss from business: +$12,650 (reported on 19.8% of returns)
Here:
+$12,650
State:
+$16,826
(% of AGI for various income ranges: 20.8% for AGIs below $10k, 9.3% for AGIs $10k-25k, 5.3% for AGIs $25k-50k, 6.1% for AGIs $50k-75k, 5.1% for AGIs $75k-100k, 6.3% for AGIs over 100k)
IRA payment deduction: $2,648 (reported on 2.8% of returns)
94609:
$2,648
California:
$3,192
(% of AGI for various income ranges: 0.4% for AGIs below $10k, 0.3% for AGIs $10k-25k, 0.3% for AGIs $25k-50k, 0.2% for AGIs $50k-75k, 0.1% for AGIs $75k-100k, 0.1% for AGIs over 100k)
Self-employed pension: $10,344 (reported on 1.7% of returns)
Here:
$10,344
California:
$17,688
(% of AGI for various income ranges: 0.1% for AGIs $10k-25k, 0.3% for AGIs $25k-50k, 0.3% for AGIs $50k-75k, 0.5% for AGIs $75k-100k, 0.9% for AGIs over 100k)
Total itemized deductions: $20,846 (27% of AGI, reported on 25.5% of returns)
Here:
$20,846
State:
$28,113
Here:
27.3% of AGI
State:
25.3% of AGI
(% of AGI for various income ranges: 17.7% for AGIs below $10k, 7.6% for AGIs $10k-25k, 8.5% for AGIs $25k-50k, 15.4% for AGIs $50k-75k, 17.9% for AGIs $75k-100k, 18.7% for AGIs over 100k)
Charity contributions deductions: $2,589 (3% of AGI, reported on 21.2% of returns)
Here:
$2,589
State:
$3,923
Here:
3.2% of AGI
State:
3.3% of AGI
(% of AGI for various income ranges: 0.8% for AGIs below $10k, 0.8% for AGIs $10k-25k, 1.0% for AGIs $25k-50k, 1.5% for AGIs $50k-75k, 1.4% for AGIs $75k-100k, 2.1% for AGIs over 100k)
Total tax: $5,689 (reported on 79.1% of returns)
94609:
$5,689
State:
$10,761
(% of AGI for various income ranges: 5.5% for AGIs below $10k, 5.6% for AGIs $10k-25k, 9.2% for AGIs $25k-50k, 11.9% for AGIs $50k-75k, 12.8% for AGIs $75k-100k, 16.6% for AGIs over 100k)
Earned income credit: $1,332 (reported on 16.1% of returns)
Here:
$1,332
State:
$1,763
Percentage of individuals using paid preparers for their 2004 taxes: 48.6%
Here:
49%
State:
66%
(% for various income ranges: 47.6% for AGIs below $10k, 48.2% for AGIs $10k-25k, 46.5% for AGIs $25k-50k, 50.0% for AGIs $50k-75k, 50.0% for AGIs $75k-100k, 58.1% for AGIs over 100k)
Likely homosexual households (counted as self-reported same-sex unmarried-partner households)
Lesbian couples: 0.8% of all households
Gay men: 0.8% of all households
Household received Food Stamps/SNAP in the past 12 months: 1,115 Household did not receive Food Stamps/SNAP in the past 12 months: 9,666
Women who had a birth in the past 12 months: 396 (301 now married, 94 unmarried) Women who did not have a birth in the past 12 months: 7,634 (2,085 now married, 5,589 unmarried)
Housing units in zip code 94609 with a mortgage: 2,547 (310 second mortgage, 306 both second mortgage and home equity loan) Houses without a mortgage: 31
Median monthly owner costs for units with a mortgage: $3,437 Median monthly owner costs for units without a mortgage: $952
Residents with income below the poverty level in 2022:
This zip code:
10.2%
Whole state:
12.2%
Residents with income below 50% of the poverty level in 2022:
This zip code:
5.2%
Whole state:
6.2%
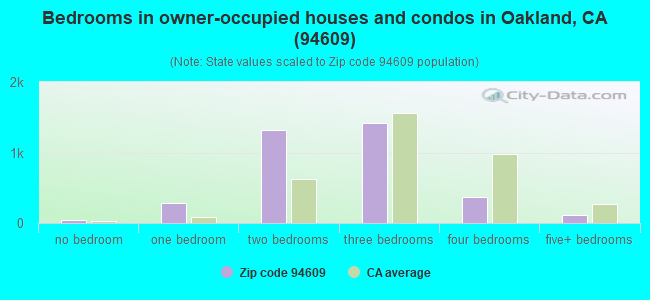
Median number of rooms in houses and condos:
Here:
5.6
State:
6.0
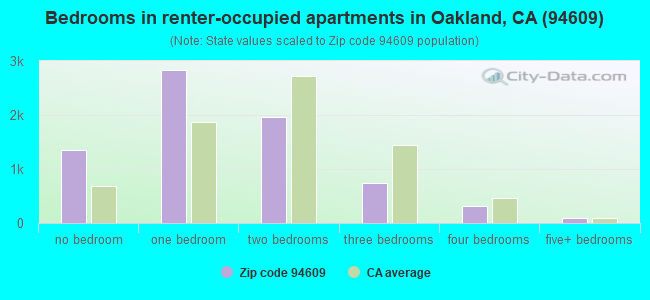
Median number of rooms in apartments:
Here:
3.4
State:
3.9
Notable locations in this zip code not listed on our city pages
Notable locations in zip code 94609: Temescal Branch Oakland Public Library (A), Thunder Road Chemical Dependency Recovery Hospital (B), Oakland Fire Department Station 8 (C), Bakewell Memorial Building (D), East Bay Center for the Blind (E). Display/hide their locations on the map
Churches in zip code 94609 include: Beebee Memorial Christian Methodist Episcopal Church (A), Bethany Missionary Baptist Church (B), Christ Holy Sanctified Pentecostal Church (C), Emmanuel Presbyterian Church (D), Evening Shade Baptist Church (E), Evergreen Baptist Church (F), Golden Gate Baptist Church (G), Gospel Auditorium (H), Italian Christian Apostolic Church (I). Display/hide their locations on the map
Parks in zip code 94609 include: North Oakland Recreation Center (1), Temescal Pool (2), Bushrod Park (3), Colby Park (4). Display/hide their locations on the map
2,083 married couples with children.
960 single-parent households (293 men, 667 women).
73.6% of residents of 94609 zip code speak English at home.
9.5% of residents speak Spanish at home (78% very well, 12% well, 9% not well).
4.8% of residents speak other Indo-European language at home (88% very well, 6% well, 5% not well, 1% not at all).
6.9% of residents speak Asian or Pacific Island language at home (73% very well, 13% well, 8% not well, 6% not at all).
4.4% of residents speak other language at home (62% very well, 31% well, 2% not well, 5% not at all).
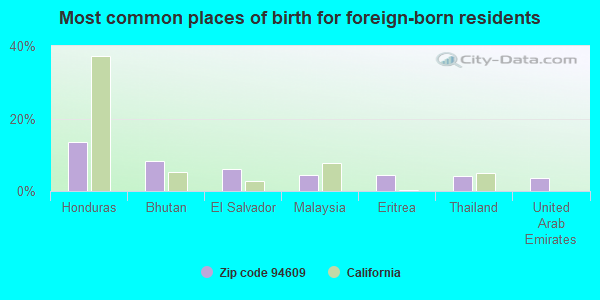
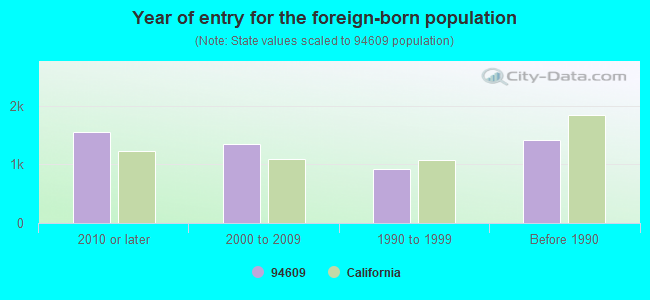
Foreign born population: 4,607 (18.5%) (53.8% of them are naturalized citizens)
Major facilities with environmental interests located in this zip code:
CARTER MIDDLE SCHOOL (4521 WEBSTER ST in OAKLAND, CA)
STATE MASTER (California - Hazardous Waste Tracking) - HAZARDOU WASTE PROGRAM (National Center for Education Statistics) - STATE ID-6057103 Small Quantity Generators, between 100 kg and 1000 kg of hazardous waste/month (Resource Conservation and Recovery Act (tracking hazardous waste)) - notification Organizations: OAKLAND UNIFIED SCHOOL DIST (CONTACT/OWNER)
, OAKLAND UNIFIED (SCHOOL DISTRICT)
CHILDRENS HOSPITAL MEDICAL CTR (747 52ND ST in OAKLAND, CA)
STATE MASTER (California - Hazardous Waste Tracking) - HAZARDOU WASTE PROGRAM CRITERIA AND HAZARDOUS AIR POLLUTANT INVENTORY (Inventory of air pollution sources) Small Quantity Generators, between 100 kg and 1000 kg of hazardous waste/month (Resource Conservation and Recovery Act (tracking hazardous waste)) Business SIC classification: GENERAL MEDICAL AND SURGICAL HOSPITALS Alternative names: CHILDRENS HOSPITAL & RESEARCH CENTER AT OAKLAND, CHILDRENS HOSPITAL OAKLAND
EAST BAY ORTHOPAEDIC SPECIALIST (3100 TELEGRAPH AVE in OAKLAND, CA) . Federal Facility
STATE MASTER (California - Hazardous Waste Tracking) - HAZARDOU WASTE PROGRAM Small Quantity Generators, between 100 kg and 1000 kg of hazardous waste/month (Resource Conservation and Recovery Act (tracking hazardous waste)) - notification Organizations: SUMMIT MEDICAL CENTER (CONTACT/OWNER)
Alternative names: PERALTA ORTHOPAEDIC ASSOCIATES
EQUILON ENTERPRISES (2800 TELEGRAPH/28TH in OAKLAND, CA) . Federal Facility
STATE MASTER (California - Hazardous Waste Tracking) - HAZARDOU WASTE PROGRAM Small Quantity Generators, between 100 kg and 1000 kg of hazardous waste/month (Resource Conservation and Recovery Act (tracking hazardous waste)) - notification Organizations: EQUILON ENTERPRISES LLC (CONTACT/OWNER)
Alternative names: SHELL OIL CO
CHEVRON STATION NO 90338 (5500 TELEGRAPH AVE in OAKLAND, CA)
STATE MASTER (California - Hazardous Waste Tracking) - HAZARDOU WASTE PROGRAM Small Quantity Generators, between 100 kg and 1000 kg of hazardous waste/month (Resource Conservation and Recovery Act (tracking hazardous waste)) - notification Organizations: CHEVRON PRODUCTS CO (CONTACT/OWNER)
EMERSON ELEMENTARY (4803 LAWTON AVE. in OAKLAND, CA)
(National Center for Education Statistics) - STATE ID-6001812 Organizations: OAKLAND UNIFIED (SCHOOL DISTRICT)
LANEY MIDDLE (OPPORTUNITY) (900 FALLON ST. in OAKLAND, CA)
(National Center for Education Statistics) - STATE ID-6114011 Organizations: OAKLAND UNIFIED (SCHOOL DISTRICT)
ENVIRONMENTAL CONTROL INDUSTRIES (5720 SHATTUCK AVE UNIT A in OAKLAND, CA)
COMPLIANCE ACTIVITY (Tracking inspections of insecticide, fungicide, and rodenticide, and toxic substances) Small Quantity Generators, between 100 kg and 1000 kg of hazardous waste/month (Resource Conservation and Recovery Act (tracking hazardous waste)) Organizations: DAN DOUD, KURT ZIMMERMAN (CONTACT/OWNER)
HISTOPATHOLOGY REFERENCE LAB (2940 SUMMIT ST 2ND FLOOR in OAKLAND, CA)
Small Quantity Generators, between 100 kg and 1000 kg of hazardous waste/month (Resource Conservation and Recovery Act (tracking hazardous waste)) - notification Organizations: M DESIN J MONTANYE (CONTACT/OWNER)
ADVANCED RADIOLOGIC IMAGING (411 30TH ST in OAKLAND, CA)
Small Quantity Generators, between 100 kg and 1000 kg of hazardous waste/month (Resource Conservation and Recovery Act (tracking hazardous waste)) - notification Organizations: CALIFORNIA COMMERCIAL INVEST (CONTACT/OWNER)
EBMUD BERKELEY VIEW 1 AND 2 RESERVOIRS (1401 SUMMIT RD in OAKLAND, CA)
Small Quantity Generators, between 100 kg and 1000 kg of hazardous waste/month (Resource Conservation and Recovery Act (tracking hazardous waste)) - notification
HARRELL STUDIO (549 66TH ST in OAKLAND, CA)
Small Quantity Generators, between 100 kg and 1000 kg of hazardous waste/month (Resource Conservation and Recovery Act (tracking hazardous waste)) - notification Business NAICS classification: PHOTOGRAPHY STUDIOS, PORTRAIT. Organizations: CALVIN HARRELL (CONTACT/OWNER)
MEDICAL CENTER MAGNETIC IMAG (3000 TELEGRAPH AVE in OAKLAND, CA)
Small Quantity Generators, between 100 kg and 1000 kg of hazardous waste/month (Resource Conservation and Recovery Act (tracking hazardous waste)) - notification Business NAICS classification: OFFICES OF PHYSICIANS, MENTAL HEALTH SPECIALISTS. Organizations: MRI INVESTORS (CONTACT/OWNER)
Housing units lacking complete plumbing facilities: 0.3% Housing units lacking complete kitchen facilities: 0.9%
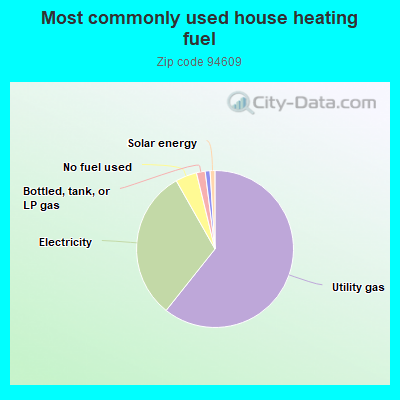
60.7%Utility gas
31.1%Electricity
4.4%No fuel used
1.8%Bottled, tank, or LP gas
1.0%Other fuel
1.0%Solar energy
Population in 1990: 20,263. Population change in the 1990s: +830 (+4.1%).
Place of birth for U.S.-born residents:
This state: 11,608
Northeast: 2,339
Midwest: 2,309
South: 2,567
West: 820
48% of the 94609 zip code residents lived in the same house 5 years ago. Out of people who lived in different houses, 51% lived in this county. Out of people who lived in different counties, 50% lived in California.
81% of the 94609 zip code residents lived in the same house 1 year ago. Out of people who lived in different houses, 53% moved from this county. Out of people who lived in different houses, 27% moved from different county within same state. Out of people who lived in different houses, 17% moved from different state. Out of people who lived in different houses, 0% moved from abroad.
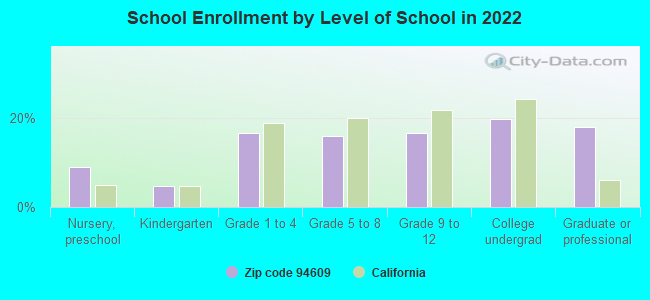
Private vs. public school enrollment:
Students in private schools in grades 1 to 8 (elementary and middle school): 215
Here:
14.7%
California:
10.5%
Students in private schools in grades 9 to 12 (high school): 95
Here:
13.0%
California:
8.5%
Students in private undergraduate colleges: 148
Here:
16.9%
California:
15.9%
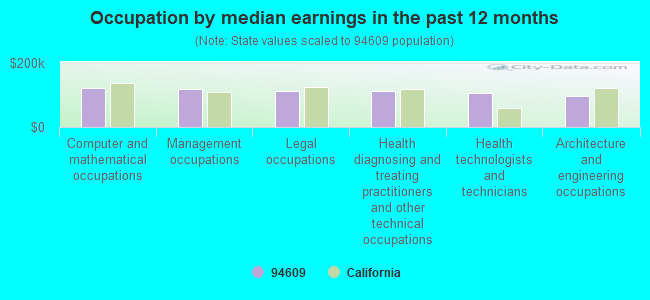
Occupation by median earnings in the past 12 months ($)
121,920Computer and mathematical occupations
118,257Management occupations
111,992Legal occupations
111,903Health diagnosing and treating practitioners and other technical occupations
106,867Health technologists and technicians
95,980Architecture and engineering occupations
Companies with federal contracts located in this zip code (OAKLAND, CA):
PENDULUM INSTRUMENTS, INC (5811 RACINE ST; small business) : $1,054,435 in 5 contractsfrom 2002 to 2005
Contracts for Electrical and Electronic Properties Measuring and Testing Instruments by Air Force, Navy Signed by year:2000: $0; 2001: $0; 2002: $325,500; 2003: $707,600; 2004: $16,735; 2005: $4,600; 2006: $0.
Biggest contracts:
$671,000 with Air Force for Electrical and Electronic Properties Measuring and Testing Instruments. Signed on 2003-09-30. Completion date: 2006-09-30.
$325,500, same as above.Signed on 2002-09-29. Completion date: 2003-02-28.
$36,600, same as above.Signed on 2003-03-10. Completion date: 2003-04-30.
$16,735 with Navy for Electrical and Electronic Properties Measuring and Testing Instruments. Signed on 2004-01-13. Completion date: 2004-02-06.
GILDERSLEEVE ELECTRIC INC (4800 A TELEGRAPH AVE; small business) : $71,481 in 5 contractsfrom 2000 to 2002
Contracts for Maintenance, Repair and Rebuilding of Equipment -- Electrical and Electronic Equipment Components, Maintenance, Repair or Alteration of Real Property -- Other Administrative Facilities and Service Buildings, Construction of Structures and Facilities -- Other Industrial Buildings by Navy Signed by year:2000: $5,000; 2001: $18,604; 2002: $47,877; 2003: $0; 2004: $0; 2005: $0; 2006: $0.
Biggest contracts:
$47,169 with Navy for Maintenance, Repair and Rebuilding of Equipment -- Electrical and Electronic Equipment Components. Signed on 2002-09-25. Completion date: 2002-10-31.
$12,004 with Navy for Maintenance, Repair or Alteration of Real Property -- Other Administrative Facilities and Service Buildings. Signed on 2001-04-11. Completion date: 2001-05-14.
$6,600, same as above.Signed on 2001-02-23. Completion date: 2001-03-16.
$5,000 with Navy for Construction of Structures and Facilities -- Other Industrial Buildings. Signed on 2000-10-19. Completion date: 2000-11-30.
LEO'S PROFESSIONAL AUDIO INCOR (5447 TELEGRAPH AVE; small business) : $44,564 in 5 contractsfrom 2002 to 2005
Contracts for Musical Instruments, Headsets, Handsets, Microphones and Speakers, Connectors, Electrical by Air Force, Department of Defense, Army Signed by year:2000: $0; 2001: $0; 2002: $3,344; 2003: $17,747; 2004: $1,154; 2005: $22,319; 2006: $0.
Biggest contracts:
$22,319 with Air Force for Musical Instruments. Signed on 2005-09-21. Completion date: 2005-10-21.
$10,913 with Department of Defense for Headsets, Handsets, Microphones and Speakers. Signed on 2003-02-27. Completion date: 2003-03-14.
$6,834, same as above.Signed on 2003-02-05. Completion date: 2003-02-28.
$3,344 with Department of Defense for Connectors, Electrical. Signed on 2002-01-28. Completion date: 2002-02-08.
NEURO ELECTRIC TEST ASSOCIATES (2844 SUMMIT ST STE 203; small business) : $8,340 in 2 contractsin 2005
$5,550 with Air Force for Neurology Services. Signed on 2005-05-06. Completion date: 2005-05-06.
$2,790 with Air Force for Medical and Surgical Instruments, Equipment, and Supplies. Signed on 2005-06-16. Completion date: 2005-06-16.
Top industries in this zip code by the number of employees in 2005:
Health Care and Social Assistance: General Medical and Surgical Hospitals (over 1000 employees: 2 establishments)
Health Care and Social Assistance: Offices of Physicians (except Mental Health Specialists) (250-499: 1, 100-249: 1, 50-99: 2, 20-49: 10, 10-19: 18, 5-9: 25, 1-4: 102)
Health Care and Social Assistance: Nursing Care Facilities (100-249: 2, 5-9: 1)
2005 - 2018 National Fire Incident Reporting System (NFIRS) incidents
According to the data from the years 2005 - 2018 the average number of fire incidents per year is 40. The highest number of reported fire incidents - 107 took place in 2017, and the least - 0 in 2010. The data has an increasing trend.
When looking into fire subcategories, the most reports belonged to: Structure Fires (37.7%), and Outside Fires (37.3%).
Fire incident types reported to NFIRS in Zip Code 94609


 Nearest zip codes: 94608, 94612, 94618, 94703, 94610, 94704.
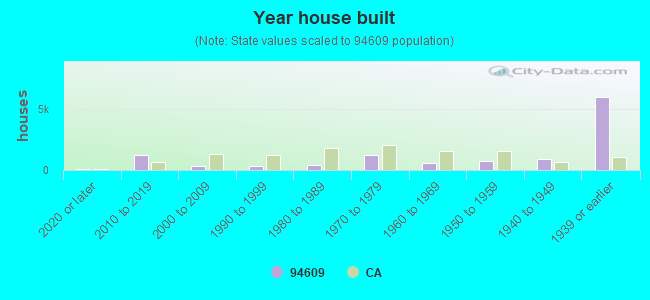


 According to the data from the years 2005 - 2018 the average number of fire incidents per year is 40. The highest number of reported fire incidents - 107 took place in 2017, and the least - 0 in 2010. The data has an increasing trend.
 When looking into fire subcategories, the most reports belonged to: Structure Fires (37.7%), and Outside Fires (37.3%).