Estimated zip code population in 2022: 3,399 Zip code population in 2010: 3,021 Zip code population in 2000: 2,870
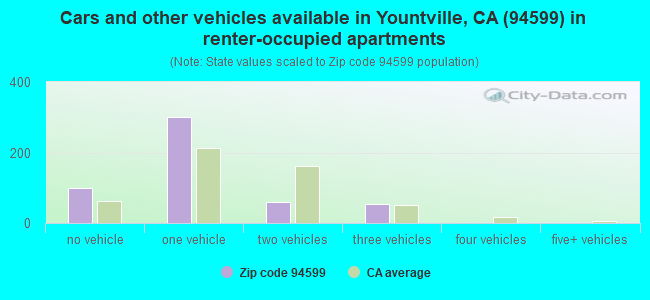
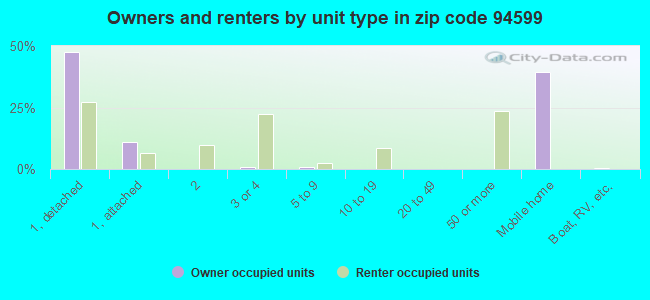
Houses and condos: 1,897 Renter-occupied apartments: 509
% of renters here:
33%
State:
44%
March 2022 cost of living index in zip code 94599: 120.6 (high, U.S. average is 100)
Land area: 2.9 sq. mi. Water area: 0.0 sq. mi.
Population density: 1,159 people per square mile
(low).
OSM Map
General Map
Google Map
MSN Map
OSM Map
General Map
Google Map
MSN Map
OSM Map
General Map
Google Map
MSN Map
OSM Map
General Map
Google Map
MSN Map
Please wait while loading the map...
Real estate property taxes paid for housing units in 2022:
This zip code:
0.5% ($3,340)
California:
0.7% ($4,831)
Median real estate property taxes paid for housing units with mortgages in 2022: $7,302 (0.7%) Median real estate property taxes paid for housing units with no mortgage in 2022: $1,315 (0.3%)
Estimated median house/condo value in 2022: $738,051
94599:
$738,051
California:
$715,900
According to our research of California and other state lists, there was 1 registered sex offender living in 94599 zip code as of May 21, 2024. The ratio of all residents to sex offenders in zip code 94599 is 3,193 to 1. The ratio of registered sex offenders to all residents in this zip code is much lower than the state average.
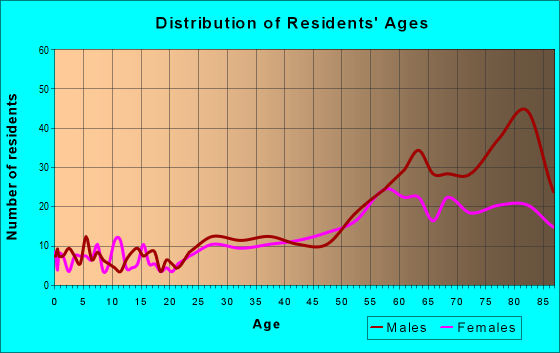
Median resident age:
This zip code:
66.1 years
California median age:
37.9 years
Average household size:
This zip code:
1.7 people
California:
2.8 people
Averages for the 2020 tax year for zip code 94599, filed in 2021:
Average Adjusted Gross Income (AGI) in 2020: $123,119 (Individual Income Tax Returns)
Here:
$123,119
State:
$95,910
Salary/wage: $89,093 (reported on 64.0% of returns)
Here:
$89,093
State:
$77,331
(% of AGI for various income ranges: 1080.0% for AGIs below $25k, 4053.6% for AGIs $25k-50k, 7640.9% for AGIs $50k-75k, 11178.6% for AGIs $75k-100k, 20033.8% for AGIs $100k-200k, 131750.0% for AGIs over 200k)
Taxable interest for individuals: $3,736 (reported on 48.2% of returns)
This zip code:
$3,736
California:
$2,294
(% of AGI for various income ranges: 40.0% for AGIs below $25k, 86.4% for AGIs $25k-50k, 78.2% for AGIs $50k-75k, 330.0% for AGIs $75k-100k, 583.8% for AGIs $100k-200k, 5100.0% for AGIs over 200k)
Ordinary dividends: $12,449 (reported on 35.3% of returns)
Here:
$12,449
State:
$10,949
(% of AGI for various income ranges: 105.9% for AGIs below $25k, 121.4% for AGIs $25k-50k, 365.5% for AGIs $50k-75k, 564.3% for AGIs $75k-100k, 1257.5% for AGIs $100k-200k, 13156.7% for AGIs over 200k)
Net capital gain/loss in AGI: +$51,198 (reported on 34.5% of returns)
Here:
+$51,198
State:
+$49,306
(% of AGI for various income ranges: 33.5% for AGIs below $25k, 163.6% for AGIs $25k-50k, 252.7% for AGIs $50k-75k, 678.6% for AGIs $75k-100k, 2033.7% for AGIs $100k-200k, 73030.0% for AGIs over 200k)
Profit/loss from business: +$27,982 (reported on 20.1% of returns)
Here:
+$27,982
State:
+$15,671
(% of AGI for various income ranges: 128.8% for AGIs below $25k, 362.9% for AGIs $25k-50k, 395.5% for AGIs $50k-75k, 554.3% for AGIs $75k-100k, 846.2% for AGIs $100k-200k, 18693.3% for AGIs over 200k)
Taxable individual retirement arrangement distribution: $23,533 (reported on 17.3% of returns)
94599:
$23,533
California:
$23,505
(% of AGI for various income ranges: 224.7% for AGIs below $25k, 249.3% for AGIs $25k-50k, 373.6% for AGIs $50k-75k, 648.6% for AGIs $75k-100k, 2548.8% for AGIs $100k-200k, 6710.0% for AGIs over 200k)
Self-employed (Keogh) retirement plans: $30,750 (reported on 1.4% of returns)
94599:
$30,750
California:
$30,163
(% of AGI for various income ranges: 559.1% for AGIs $50k-75k)
Total itemized deductions: $39,989 (reported on 19.4% of returns)
Here:
$39,989
State:
$39,517
(% of AGI for various income ranges: 705.7% for AGIs $25k-50k, 805.5% for AGIs $50k-75k, 1514.3% for AGIs $75k-100k, 2936.2% for AGIs $100k-200k, 18380.0% for AGIs over 200k)
Charity contributions: $11,027 (reported on 15.8% of returns)
Here:
$11,027
State:
$12,598
(% of AGI for various income ranges: 36.5% for AGIs below $25k, 149.1% for AGIs $50k-75k, 97.1% for AGIs $75k-100k, 562.5% for AGIs $100k-200k, 5606.7% for AGIs over 200k)
Taxes paid: $8,144 (reported on 19.4% of returns)
94599:
$8,144
State:
$8,807
(% of AGI for various income ranges: 159.3% for AGIs $25k-50k, 180.9% for AGIs $50k-75k, 405.7% for AGIs $75k-100k, 871.2% for AGIs $100k-200k, 2653.3% for AGIs over 200k)
Earned income credit: $1,138 (reported on 5.8% of returns)
Here:
$1,138
State:
$2,074
(% of AGI for various income ranges: 53.5% for AGIs below $25k)
Percentage of individuals using paid preparers for their 2020 taxes: 89.2%
Here:
89%
State:
92%
(% for various income ranges: 88.2% for AGIs below $25k, 85.7% for AGIs $25k-50k, 87.0% for AGIs $50k-75k, 93.8% for AGIs $75k-100k, 86.4% for AGIs $100k-200k, 100.0% for AGIs over 200k)
Averages for the 2012 tax year for zip code 94599, filed in 2013:
Average Adjusted Gross Income (AGI) in 2012: $102,296 (Individual Income Tax Returns)
Here:
$102,296
State:
$72,726
Salary/wage: $67,536 (reported on 67.9% of returns)
Here:
$67,536
State:
$59,079
(% of AGI for various income ranges: 51.5% for AGIs below $25k, 64.3% for AGIs $25k-50k, 65.0% for AGIs $50k-75k, 58.6% for AGIs $75k-100k, 61.6% for AGIs $100k-200k, 30.0% for AGIs over 200k)
Taxable interest for individuals: $3,577 (reported on 46.5% of returns)
This zip code:
$3,577
California:
$2,146
(% of AGI for various income ranges: 2.7% for AGIs below $25k, 1.1% for AGIs $25k-50k, 1.0% for AGIs $50k-75k, 1.0% for AGIs $75k-100k, 1.2% for AGIs $100k-200k, 2.0% for AGIs over 200k)
Ordinary dividends: $12,288 (reported on 30.2% of returns)
Here:
$12,288
State:
$9,308
(% of AGI for various income ranges: 4.9% for AGIs below $25k, 2.6% for AGIs $25k-50k, 2.1% for AGIs $50k-75k, 2.1% for AGIs $75k-100k, 2.5% for AGIs $100k-200k, 4.6% for AGIs over 200k)
Net capital gain/loss in AGI: +$29,349 (reported on 27.0% of returns)
Here:
+$29,349
State:
+$30,460
(% of AGI for various income ranges: 0.4% for AGIs $25k-50k, 1.4% for AGIs $75k-100k, 2.4% for AGIs $100k-200k, 13.6% for AGIs over 200k)
Profit/loss from business: +$40,307 (reported on 17.0% of returns)
Here:
+$40,307
State:
+$17,064
(% of AGI for various income ranges: 6.9% for AGIs below $25k, 5.3% for AGIs $25k-50k, 5.9% for AGIs $50k-75k, 4.6% for AGIs $75k-100k, 6.3% for AGIs $100k-200k, 7.5% for AGIs over 200k)
Taxable individual retirement arrangement distribution: $15,938 (reported on 16.4% of returns)
94599:
$15,938
California:
$19,557
(% of AGI for various income ranges: 4.8% for AGIs below $25k, 2.8% for AGIs $25k-50k, 3.7% for AGIs $50k-75k, 4.3% for AGIs $75k-100k, 5.6% for AGIs $100k-200k, 0.9% for AGIs over 200k)
Self-employment retirement plans: $24,100 (reported on 1.9% of returns)
94599:
$24,100
California:
$24,530
Total itemized deductions: $42,730 (21% of AGI, reported on 40.3% of returns)
Here:
$42,730
State:
$34,004
Here:
21.1% of AGI
State:
22.7% of AGI
(% of AGI for various income ranges: 17.8% for AGIs below $25k, 10.9% for AGIs $25k-50k, 11.8% for AGIs $50k-75k, 16.9% for AGIs $75k-100k, 21.3% for AGIs $100k-200k, 17.1% for AGIs over 200k)
Charity contributions: $5,430 (reported on 33.3% of returns)
Here:
$5,430
State:
$4,659
(% of AGI for various income ranges: 1.7% for AGIs below $25k, 1.5% for AGIs $25k-50k, 1.4% for AGIs $50k-75k, 1.8% for AGIs $75k-100k, 2.8% for AGIs $100k-200k, 1.6% for AGIs over 200k)
Taxes paid: $20,447 (reported on 40.3% of returns)
94599:
$20,447
State:
$14,448
(% of AGI for various income ranges: 2.9% for AGIs below $25k, 2.1% for AGIs $25k-50k, 3.2% for AGIs $50k-75k, 5.6% for AGIs $75k-100k, 8.1% for AGIs $100k-200k, 10.6% for AGIs over 200k)
Earned income credit: $1,930 (reported on 6.3% of returns)
Here:
$1,930
State:
$2,286
(% of AGI for various income ranges: 1.8% for AGIs below $25k, 0.6% for AGIs $25k-50k)
Percentage of individuals using paid preparers for their 2012 taxes: 59.1%
Here:
59%
State:
64%
(% for various income ranges: 47.9% for AGIs below $25k, 55.3% for AGIs $25k-50k, 58.3% for AGIs $50k-75k, 68.8% for AGIs $75k-100k, 66.7% for AGIs $100k-200k, 91.7% for AGIs over 200k)
Averages for the 2004 tax year for zip code 94599, filed in 2005:
Average Adjusted Gross Income (AGI) in 2004: $61,056 (Individual Income Tax Returns)
Here:
$61,056
State:
$58,600
Salary/wage: $56,892 (reported on 69.0% of returns)
Here:
$56,892
State:
$49,455
(% of AGI for various income ranges: 643.4% for AGIs below $10k, 49.2% for AGIs $10k-25k, 64.9% for AGIs $25k-50k, 71.6% for AGIs $50k-75k, 70.3% for AGIs $75k-100k, 61.5% for AGIs over 100k)
Taxable interest for individuals: $3,237 (reported on 55.9% of returns)
This zip code:
$3,237
California:
$2,365
(% of AGI for various income ranges: 52.2% for AGIs below $10k, 4.2% for AGIs $10k-25k, 2.4% for AGIs $25k-50k, 2.0% for AGIs $50k-75k, 3.0% for AGIs $75k-100k, 3.1% for AGIs over 100k)
Taxable dividends: $4,987 (reported on 32.2% of returns)
Here:
$4,987
State:
$4,746
(% of AGI for various income ranges: 89.3% for AGIs below $10k, 4.2% for AGIs $10k-25k, 2.2% for AGIs $25k-50k, 1.5% for AGIs $50k-75k, 3.1% for AGIs $75k-100k, 2.5% for AGIs over 100k)
Net capital gain/loss: +$10,553 (reported on 28.6% of returns)
Here:
+$10,553
State:
+$23,418
(% of AGI for various income ranges: -28.3% for AGIs below $10k, -0.4% for AGIs $10k-25k, 0.1% for AGIs $25k-50k, 1.1% for AGIs $50k-75k, 3.0% for AGIs $75k-100k, 8.5% for AGIs over 100k)
Profit/loss from business: +$28,734 (reported on 17.2% of returns)
Here:
+$28,734
State:
+$16,826
(% of AGI for various income ranges: -35.8% for AGIs below $10k, 5.3% for AGIs $10k-25k, 5.8% for AGIs $25k-50k, 5.8% for AGIs $50k-75k, 7.7% for AGIs $75k-100k, 10.0% for AGIs over 100k)
Profit/loss from farming: +$6,643 (reported on 1.6% of returns)
Here:
+$6,643
State:
-$7,562
IRA payment deduction: $3,365 (reported on 3.7% of returns)
94599:
$3,365
California:
$3,192
(% of AGI for various income ranges: 0.4% for AGIs $25k-50k, 0.2% for AGIs $50k-75k, 0.4% for AGIs $75k-100k, 0.1% for AGIs over 100k)
Self-employed pension: $12,118 (reported on 3.0% of returns)
Here:
$12,118
California:
$17,688
(% of AGI for various income ranges: 0.8% for AGIs $10k-25k, 0.5% for AGIs $50k-75k, 0.9% for AGIs over 100k)
Total itemized deductions: $29,346 (24% of AGI, reported on 36.1% of returns)
Here:
$29,346
State:
$28,113
Here:
24.1% of AGI
State:
25.3% of AGI
(% of AGI for various income ranges: 114.5% for AGIs below $10k, 11.0% for AGIs $10k-25k, 12.7% for AGIs $25k-50k, 16.2% for AGIs $50k-75k, 19.4% for AGIs $75k-100k, 19.2% for AGIs over 100k)
Charity contributions deductions: $3,439 (3% of AGI, reported on 31.8% of returns)
Here:
$3,439
State:
$3,923
Here:
2.7% of AGI
State:
3.3% of AGI
(% of AGI for various income ranges: 8.8% for AGIs below $10k, 2.5% for AGIs $10k-25k, 1.6% for AGIs $25k-50k, 1.5% for AGIs $50k-75k, 2.1% for AGIs $75k-100k, 1.8% for AGIs over 100k)
Total tax: $11,979 (reported on 78.7% of returns)
94599:
$11,979
State:
$10,761
(% of AGI for various income ranges: 29.6% for AGIs below $10k, 4.1% for AGIs $10k-25k, 8.0% for AGIs $25k-50k, 10.8% for AGIs $50k-75k, 11.5% for AGIs $75k-100k, 21.0% for AGIs over 100k)
Earned income credit: $1,519 (reported on 6.3% of returns)
Here:
$1,519
State:
$1,763
Percentage of individuals using paid preparers for their 2004 taxes: 63.6%
Here:
64%
State:
66%
(% for various income ranges: 54.9% for AGIs below $10k, 60.8% for AGIs $10k-25k, 60.3% for AGIs $25k-50k, 70.5% for AGIs $50k-75k, 63.3% for AGIs $75k-100k, 79.7% for AGIs over 100k)
Likely homosexual households (counted as self-reported same-sex unmarried-partner households)
Lesbian couples: 0.0% of all households
Gay men: 0.3% of all households
Household received Food Stamps/SNAP in the past 12 months: 125 Household did not receive Food Stamps/SNAP in the past 12 months: 1,416
Women who had a birth in the past 12 months: 6 (6 now married, 0 unmarried) Women who did not have a birth in the past 12 months: 311 (173 now married, 136 unmarried)
Housing units in zip code 94599 with a mortgage: 404 (34 second mortgage, 35 both second mortgage and home equity loan) Median monthly owner costs for units with a mortgage: $2,613 Median monthly owner costs for units without a mortgage: $1,012
Residents with income below the poverty level in 2022:
This zip code:
10.4%
Whole state:
12.2%
Residents with income below 50% of the poverty level in 2022:
This zip code:
8.3%
Whole state:
6.2%
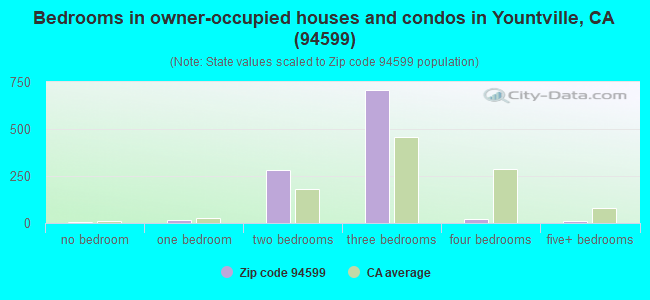
Median number of rooms in houses and condos:
Here:
5.6
State:
6.0
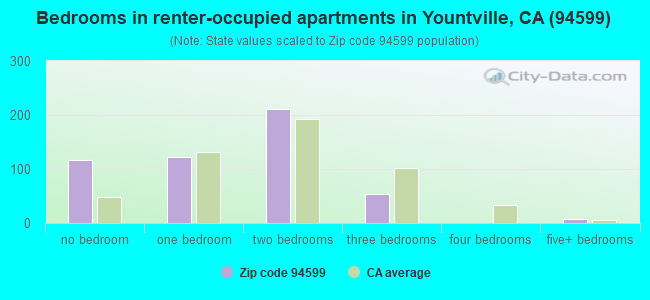
Median number of rooms in apartments:
Here:
3.2
State:
3.9
Notable locations in this zip code not listed on our city pages
Notable locations in zip code 94599: Yountville Town Hall (A), Yountville Branch Napa City-County Library (B), Napa County Fire Department Station 12 Yountville (C). Display/hide their locations on the map
In group quarters: 755 (-1 institutionalized population)
Size of family households: 418 2-persons, 131 3-persons, 49 4-persons, 15 5-persons
Size of nonfamily households: 833 1-person, 131 2-persons
135 married couples with children.
0 single-parent households ().
80.2% of residents of 94599 zip code speak English at home.
12.5% of residents speak Spanish at home (49% very well, 8% well, 31% not well, 12% not at all).
4.8% of residents speak other Indo-European language at home (76% very well, 21% well, 3% not well).
4.3% of residents speak Asian or Pacific Island language at home (60% very well, 16% well, 19% not well, 5% not at all).
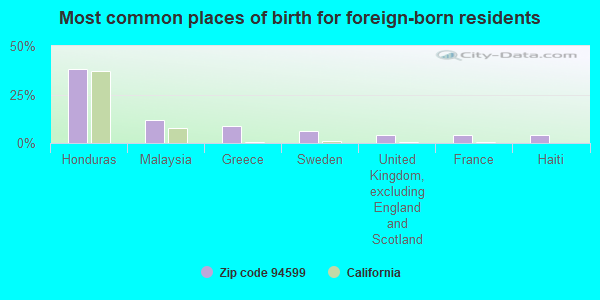
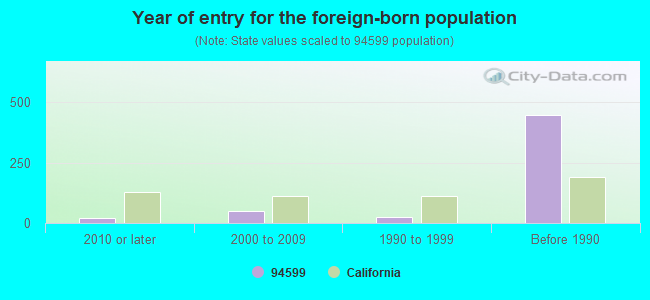
Foreign born population: 517 (15.2%) (81.9% of them are naturalized citizens)
This zip code:
15.2%
Whole state:
26.7%
38%Honduras
12%Malaysia
9%Greece
6%Sweden
4%United Kingdom, excluding England and Scotland
4%France
4%Haiti
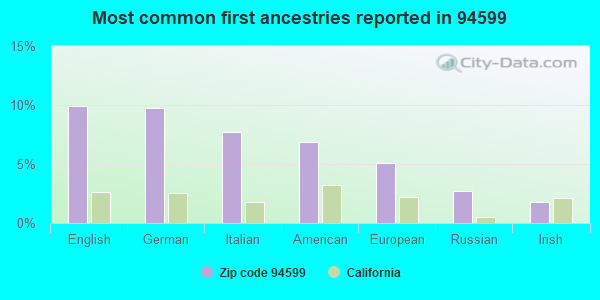
10%English
10%German
8%Italian
7%American
5%European
3%Russian
2%Irish
Year of entry for the foreign-born population
222010 or later
492000 to 2009
251990 to 1999
448Before 1990
Housing units lacking complete plumbing facilities: 0.3% Housing units lacking complete kitchen facilities: 6.8%
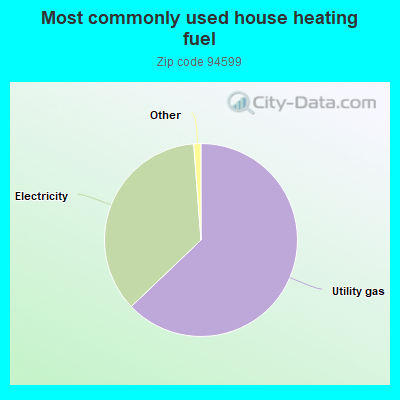
63.0%Utility gas
36.0%Electricity
Population in 1990: 1,876. Population change in the 1990s: +994 (+53.0%).
Place of birth for U.S.-born residents:
This state: 2,024
Northeast: 275
Midwest: 222
South: 197
West: 98
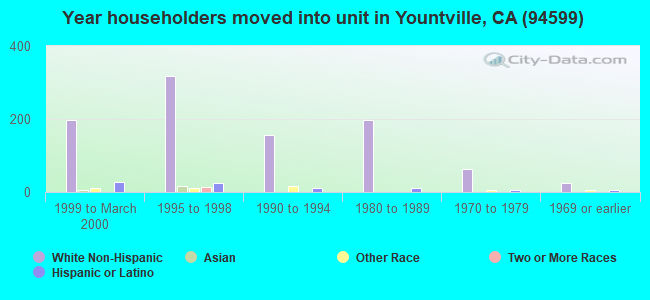
50% of the 94599 zip code residents lived in the same house 5 years ago. Out of people who lived in different houses, 28% lived in this county. Out of people who lived in different counties, 50% lived in California.
90% of the 94599 zip code residents lived in the same house 1 year ago. Out of people who lived in different houses, 58% moved from this county. Out of people who lived in different houses, 30% moved from different county within same state. Out of people who lived in different houses, 12% moved from abroad.
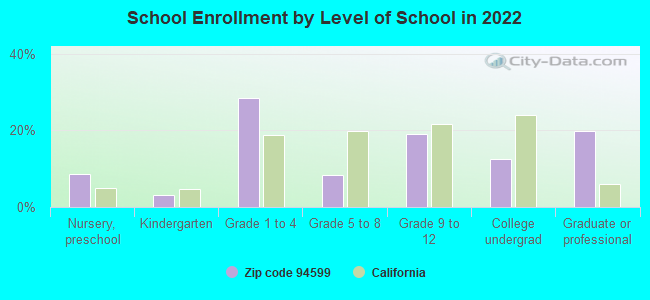
Private vs. public school enrollment:
Students in private schools in grades 1 to 8 (elementary and middle school): 9
Here:
9.8%
California:
10.5%
Students in private schools in grades 9 to 12 (high school):
Here:
0.0%
California:
8.5%
Students in private undergraduate colleges: 33
Here:
100.0%
California:
15.9%
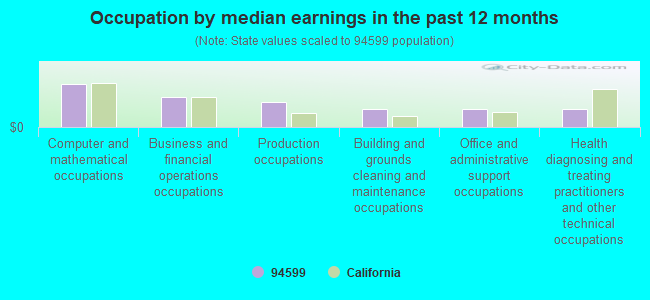
Occupation by median earnings in the past 12 months ($)
149,295Computer and mathematical occupations
102,989Business and financial operations occupations
87,127Production occupations
62,623Building and grounds cleaning and maintenance occupations
62,486Office and administrative support occupations
62,304Health diagnosing and treating practitioners and other technical occupations
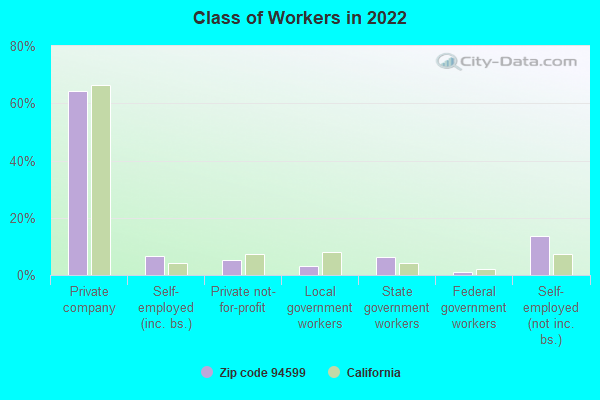
Top industries in this zip code by the number of employees in 2005:
Health Care and Social Assistance: General Medical and Surgical Hospitals (over 1000 employees: 1 establishment)
Accommodation and Food Services: Hotels (except Casino Hotels) and Motels (250-499: 1, 20-49: 2, 1-4: 1)
Accommodation and Food Services: Limited-Service Restaurants (20-49: 2, 1-4: 1)
Accommodation and Food Services: Caterers (20-49: 1)
Arts, Entertainment, and Recreation: Golf Courses and Country Clubs (20-49: 1)
Construction: Painting and Wall Covering Contractors (20-49: 1)
Finance and Insurance: Real Estate Credit (20-49: 1)
People in group quarters in 2010:
928 people in nursing facilities/skilled-nursing facilities
37 people in workers' group living quarters and job corps centers
23 people in residential treatment centers for adults
People in group quarters in 2000:
658 people in orthopedic wards and institutions for the physically handicapped
71 people in other noninstitutional group quarters
2006 - 2018 National Fire Incident Reporting System (NFIRS) incidents
According to the data from the years 2006 - 2018 the average number of fire incidents per year is 13. The highest number of reported fires - 26 took place in 2007, and the least - 7 in 2006. The data has a constant trend.
When looking into fire subcategories, the most reports belonged to: Outside Fires (48.9%), and Structure Fires (26.4%).
Fire incident types reported to NFIRS in Zip Code 94599


+$6,643
-$7,562
 Nearest zip codes: 94573, 94558, 95442, 94574, 95431, 94559.


 According to the data from the years 2006 - 2018 the average number of fire incidents per year is 13. The highest number of reported fires - 26 took place in 2007, and the least - 7 in 2006. The data has a constant trend.
 When looking into fire subcategories, the most reports belonged to: Outside Fires (48.9%), and Structure Fires (26.4%).