Estimated zip code population in 2022: 67,018 Zip code population in 2010: 54,605 Zip code population in 2000: 26,560
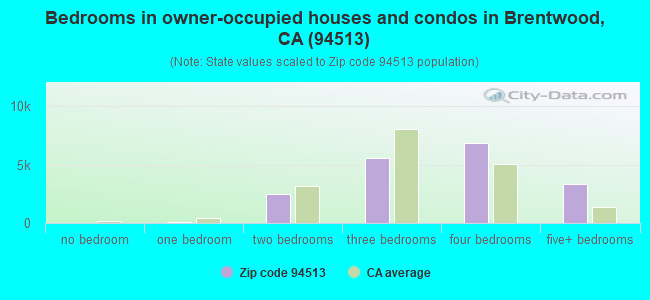
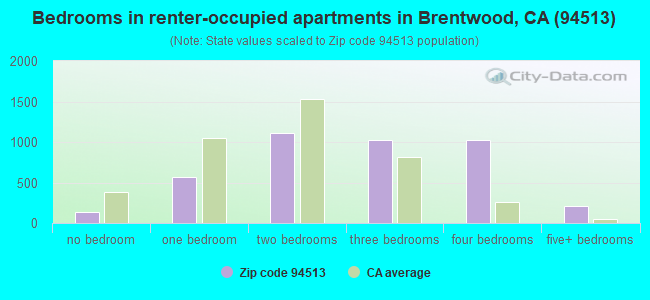
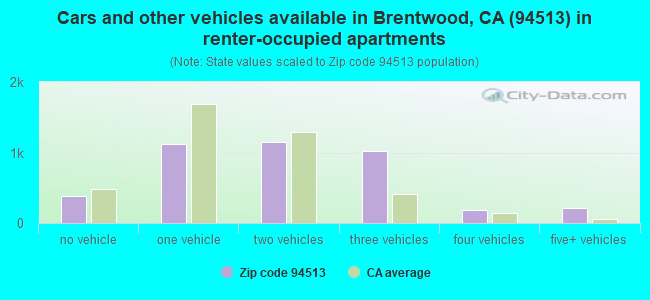
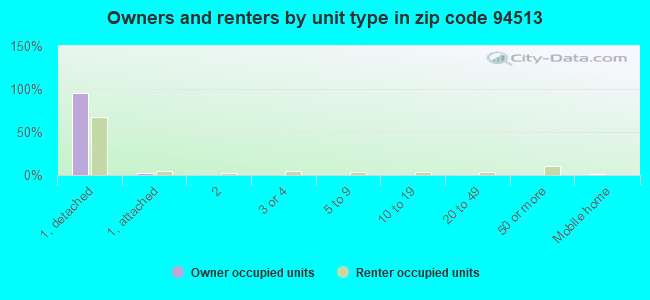
Houses and condos: 22,807 Renter-occupied apartments: 4,081
% of renters here:
18%
State:
44%
March 2022 cost of living index in zip code 94513: 116.7 (more than average, U.S. average is 100)
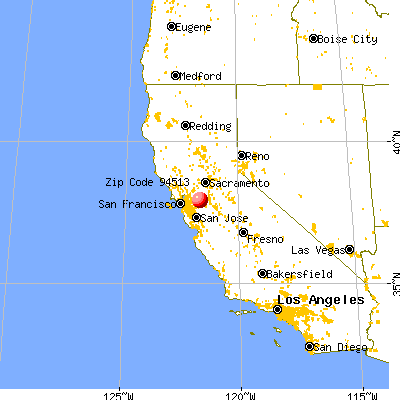
Land area: 75.7 sq. mi. Water area: 1.9 sq. mi.
Population density: 885 people per square mile
(low).
OSM Map
General Map
Google Map
MSN Map
OSM Map
General Map
Google Map
MSN Map
OSM Map
General Map
Google Map
MSN Map
OSM Map
General Map
Google Map
MSN Map
Please wait while loading the map...
Real estate property taxes paid for housing units in 2022:
This zip code:
0.9% ($7,569)
California:
0.7% ($4,831)
Median real estate property taxes paid for housing units with mortgages in 2022: $7,943 (1.0%) Median real estate property taxes paid for housing units with no mortgage in 2022: $6,516 (0.8%)
Estimated median house/condo value in 2022: $798,859
94513:
$798,859
California:
$715,900
According to our research of California and other state lists, there were 37 registered sex offenders living in 94513 zip code as of May 04, 2024. The ratio of all residents to sex offenders in zip code 94513 is 1,630 to 1. The ratio of registered sex offenders to all residents in this zip code is lower than the state average.
Median resident age:
This zip code:
41.7 years
California median age:
37.9 years
Average household size:
This zip code:
3.0 people
California:
2.8 people
Averages for the 2020 tax year for zip code 94513, filed in 2021:
Average Adjusted Gross Income (AGI) in 2020: $103,173 (Individual Income Tax Returns)
Here:
$103,173
State:
$95,910
Salary/wage: $94,075 (reported on 79.7% of returns)
Here:
$94,075
State:
$77,331
(% of AGI for various income ranges: 1192.7% for AGIs below $25k, 3743.0% for AGIs $25k-50k, 6686.1% for AGIs $50k-75k, 9884.3% for AGIs $75k-100k, 20191.1% for AGIs $100k-200k, 69125.3% for AGIs over 200k)
Taxable interest for individuals: $994 (reported on 45.7% of returns)
This zip code:
$994
California:
$2,294
(% of AGI for various income ranges: 25.1% for AGIs below $25k, 33.5% for AGIs $25k-50k, 57.1% for AGIs $50k-75k, 84.6% for AGIs $75k-100k, 98.8% for AGIs $100k-200k, 341.1% for AGIs over 200k)
Ordinary dividends: $4,968 (reported on 21.3% of returns)
Here:
$4,968
State:
$10,949
(% of AGI for various income ranges: 35.8% for AGIs below $25k, 63.7% for AGIs $25k-50k, 117.6% for AGIs $50k-75k, 191.3% for AGIs $75k-100k, 245.6% for AGIs $100k-200k, 894.6% for AGIs over 200k)
Net capital gain/loss in AGI: +$21,571 (reported on 21.3% of returns)
Here:
+$21,571
State:
+$49,306
(% of AGI for various income ranges: 11.3% for AGIs below $25k, 49.9% for AGIs $25k-50k, 92.9% for AGIs $50k-75k, 172.9% for AGIs $75k-100k, 420.7% for AGIs $100k-200k, 8512.0% for AGIs over 200k)
Profit/loss from business: +$13,238 (reported on 16.8% of returns)
Here:
+$13,238
State:
+$15,671
(% of AGI for various income ranges: 111.9% for AGIs below $25k, 193.0% for AGIs $25k-50k, 238.9% for AGIs $50k-75k, 366.3% for AGIs $75k-100k, 478.9% for AGIs $100k-200k, 1790.6% for AGIs over 200k)
Taxable individual retirement arrangement distribution: $25,345 (reported on 9.8% of returns)
94513:
$25,345
California:
$23,505
(% of AGI for various income ranges: 58.3% for AGIs below $25k, 156.9% for AGIs $25k-50k, 285.5% for AGIs $50k-75k, 518.1% for AGIs $75k-100k, 754.7% for AGIs $100k-200k, 1497.8% for AGIs over 200k)
Self-employed (Keogh) retirement plans: $23,612 (reported on 0.5% of returns)
94513:
$23,612
California:
$30,163
(% of AGI for various income ranges: 12.2% for AGIs $50k-75k, 27.3% for AGIs $100k-200k, 179.4% for AGIs over 200k)
Total itemized deductions: $32,706 (reported on 27.5% of returns)
Here:
$32,706
State:
$39,517
(% of AGI for various income ranges: 178.1% for AGIs below $25k, 356.2% for AGIs $25k-50k, 874.6% for AGIs $50k-75k, 1505.7% for AGIs $75k-100k, 2709.1% for AGIs $100k-200k, 6972.0% for AGIs over 200k)
Charity contributions: $5,401 (reported on 22.3% of returns)
Here:
$5,401
State:
$12,598
(% of AGI for various income ranges: 8.2% for AGIs below $25k, 28.5% for AGIs $25k-50k, 82.4% for AGIs $50k-75k, 169.0% for AGIs $75k-100k, 338.5% for AGIs $100k-200k, 1219.4% for AGIs over 200k)
Taxes paid: $9,341 (reported on 27.4% of returns)
94513:
$9,341
State:
$8,807
(% of AGI for various income ranges: 42.5% for AGIs below $25k, 85.8% for AGIs $25k-50k, 246.5% for AGIs $50k-75k, 454.3% for AGIs $75k-100k, 836.6% for AGIs $100k-200k, 1829.0% for AGIs over 200k)
Earned income credit: $1,994 (reported on 7.9% of returns)
Here:
$1,994
State:
$2,074
(% of AGI for various income ranges: 64.4% for AGIs below $25k, 52.5% for AGIs $25k-50k, 1.0% for AGIs $50k-75k)
Percentage of individuals using paid preparers for their 2020 taxes: 93.6%
Here:
94%
State:
92%
(% for various income ranges: 91.4% for AGIs below $25k, 92.7% for AGIs $25k-50k, 93.6% for AGIs $50k-75k, 93.8% for AGIs $75k-100k, 95.0% for AGIs $100k-200k, 96.3% for AGIs over 200k)
Averages for the 2012 tax year for zip code 94513, filed in 2013:
Average Adjusted Gross Income (AGI) in 2012: $77,237 (Individual Income Tax Returns)
Here:
$77,237
State:
$72,726
Salary/wage: $71,314 (reported on 81.4% of returns)
Here:
$71,314
State:
$59,079
(% of AGI for various income ranges: 70.0% for AGIs below $25k, 70.2% for AGIs $25k-50k, 71.1% for AGIs $50k-75k, 74.1% for AGIs $75k-100k, 81.8% for AGIs $100k-200k, 67.1% for AGIs over 200k)
Taxable interest for individuals: $876 (reported on 45.2% of returns)
This zip code:
$876
California:
$2,146
(% of AGI for various income ranges: 1.3% for AGIs below $25k, 0.8% for AGIs $25k-50k, 0.7% for AGIs $50k-75k, 0.5% for AGIs $75k-100k, 0.3% for AGIs $100k-200k, 0.5% for AGIs over 200k)
Ordinary dividends: $3,970 (reported on 19.9% of returns)
Here:
$3,970
State:
$9,308
(% of AGI for various income ranges: 1.8% for AGIs below $25k, 1.1% for AGIs $25k-50k, 1.0% for AGIs $50k-75k, 1.1% for AGIs $75k-100k, 0.8% for AGIs $100k-200k, 1.3% for AGIs over 200k)
Net capital gain/loss in AGI: +$10,149 (reported on 17.1% of returns)
Here:
+$10,149
State:
+$30,460
(% of AGI for various income ranges: 0.2% for AGIs $25k-50k, 0.6% for AGIs $75k-100k, 0.5% for AGIs $100k-200k, 9.4% for AGIs over 200k)
Profit/loss from business: +$16,749 (reported on 16.4% of returns)
Here:
+$16,749
State:
+$17,064
(% of AGI for various income ranges: 9.7% for AGIs below $25k, 5.5% for AGIs $25k-50k, 4.2% for AGIs $50k-75k, 3.0% for AGIs $75k-100k, 2.5% for AGIs $100k-200k, 3.8% for AGIs over 200k)
Taxable individual retirement arrangement distribution: $20,250 (reported on 11.5% of returns)
94513:
$20,250
California:
$19,557
(% of AGI for various income ranges: 4.0% for AGIs below $25k, 3.7% for AGIs $25k-50k, 3.8% for AGIs $50k-75k, 3.8% for AGIs $75k-100k, 2.6% for AGIs $100k-200k, 2.5% for AGIs over 200k)
Self-employment retirement plans: $17,833 (reported on 0.6% of returns)
94513:
$17,833
California:
$24,530
(% of AGI for various income ranges: 0.1% for AGIs $50k-75k, 0.2% for AGIs $100k-200k, 0.3% for AGIs over 200k)
Total itemized deductions: $29,731 (25% of AGI, reported on 52.1% of returns)
Here:
$29,731
State:
$34,004
Here:
25.4% of AGI
State:
22.7% of AGI
(% of AGI for various income ranges: 18.1% for AGIs below $25k, 17.5% for AGIs $25k-50k, 20.9% for AGIs $50k-75k, 21.5% for AGIs $75k-100k, 21.1% for AGIs $100k-200k, 18.1% for AGIs over 200k)
Charity contributions: $2,928 (reported on 44.3% of returns)
Here:
$2,928
State:
$4,659
(% of AGI for various income ranges: 0.9% for AGIs below $25k, 1.3% for AGIs $25k-50k, 1.6% for AGIs $50k-75k, 1.7% for AGIs $75k-100k, 1.9% for AGIs $100k-200k, 1.6% for AGIs over 200k)
Taxes paid: $10,891 (reported on 52.0% of returns)
94513:
$10,891
State:
$14,448
(% of AGI for various income ranges: 5.3% for AGIs below $25k, 4.3% for AGIs $25k-50k, 6.0% for AGIs $50k-75k, 7.0% for AGIs $75k-100k, 7.9% for AGIs $100k-200k, 8.8% for AGIs over 200k)
Earned income credit: $2,136 (reported on 10.5% of returns)
Here:
$2,136
State:
$2,286
(% of AGI for various income ranges: 4.7% for AGIs below $25k, 1.0% for AGIs $25k-50k)
Percentage of individuals using paid preparers for their 2012 taxes: 59.6%
Here:
60%
State:
64%
(% for various income ranges: 51.2% for AGIs below $25k, 59.9% for AGIs $25k-50k, 62.5% for AGIs $50k-75k, 63.3% for AGIs $75k-100k, 63.7% for AGIs $100k-200k, 69.6% for AGIs over 200k)
Averages for the 2004 tax year for zip code 94513, filed in 2005:
Average Adjusted Gross Income (AGI) in 2004: $67,374 (Individual Income Tax Returns)
Here:
$67,374
State:
$58,600
Salary/wage: $62,174 (reported on 83.2% of returns)
Here:
$62,174
State:
$49,455
(% of AGI for various income ranges: 195.8% for AGIs below $10k, 67.3% for AGIs $10k-25k, 74.1% for AGIs $25k-50k, 77.4% for AGIs $50k-75k, 82.3% for AGIs $75k-100k, 74.8% for AGIs over 100k)
Taxable interest for individuals: $1,225 (reported on 58.7% of returns)
This zip code:
$1,225
California:
$2,365
(% of AGI for various income ranges: 13.1% for AGIs below $10k, 2.8% for AGIs $10k-25k, 1.6% for AGIs $25k-50k, 1.1% for AGIs $50k-75k, 0.8% for AGIs $75k-100k, 0.8% for AGIs over 100k)
Taxable dividends: $2,271 (reported on 24.7% of returns)
Here:
$2,271
State:
$4,746
(% of AGI for various income ranges: 7.0% for AGIs below $10k, 2.1% for AGIs $10k-25k, 1.2% for AGIs $25k-50k, 0.8% for AGIs $50k-75k, 0.6% for AGIs $75k-100k, 0.7% for AGIs over 100k)
Net capital gain/loss: +$14,231 (reported on 22.6% of returns)
Here:
+$14,231
State:
+$23,418
(% of AGI for various income ranges: 11.1% for AGIs below $10k, -0.1% for AGIs $10k-25k, 0.6% for AGIs $25k-50k, 0.8% for AGIs $50k-75k, 1.3% for AGIs $75k-100k, 8.5% for AGIs over 100k)
Profit/loss from business: +$17,915 (reported on 17.8% of returns)
Here:
+$17,915
State:
+$16,826
(% of AGI for various income ranges: -6.5% for AGIs below $10k, 7.4% for AGIs $10k-25k, 6.0% for AGIs $25k-50k, 4.8% for AGIs $50k-75k, 3.6% for AGIs $75k-100k, 4.8% for AGIs over 100k)
IRA payment deduction: $3,146 (reported on 2.2% of returns)
94513:
$3,146
California:
$3,192
(% of AGI for various income ranges: 0.5% for AGIs below $10k, 0.1% for AGIs $10k-25k, 0.2% for AGIs $25k-50k, 0.1% for AGIs $50k-75k, 0.1% for AGIs $75k-100k, 0.1% for AGIs over 100k)
Self-employed pension: $14,906 (reported on 1.3% of returns)
Here:
$14,906
California:
$17,688
(% of AGI for various income ranges: 0.1% for AGIs $10k-25k, 0.1% for AGIs $25k-50k, 0.2% for AGIs $50k-75k, 0.2% for AGIs $75k-100k, 0.4% for AGIs over 100k)
Total itemized deductions: $29,558 (31% of AGI, reported on 61.1% of returns)
Here:
$29,558
State:
$28,113
Here:
31.2% of AGI
State:
25.3% of AGI
(% of AGI for various income ranges: 74.0% for AGIs below $10k, 24.0% for AGIs $10k-25k, 26.6% for AGIs $25k-50k, 31.6% for AGIs $50k-75k, 30.4% for AGIs $75k-100k, 23.9% for AGIs over 100k)
Charity contributions deductions: $2,441 (2% of AGI, reported on 54.5% of returns)
Here:
$2,441
State:
$3,923
Here:
2.5% of AGI
State:
3.3% of AGI
(% of AGI for various income ranges: 2.5% for AGIs below $10k, 1.5% for AGIs $10k-25k, 1.8% for AGIs $25k-50k, 2.2% for AGIs $50k-75k, 2.1% for AGIs $75k-100k, 1.9% for AGIs over 100k)
Total tax: $9,075 (reported on 80.2% of returns)
94513:
$9,075
State:
$10,761
(% of AGI for various income ranges: 6.8% for AGIs below $10k, 4.3% for AGIs $10k-25k, 6.3% for AGIs $25k-50k, 7.2% for AGIs $50k-75k, 8.0% for AGIs $75k-100k, 14.4% for AGIs over 100k)
Earned income credit: $1,651 (reported on 7.6% of returns)
Here:
$1,651
State:
$1,763
Percentage of individuals using paid preparers for their 2004 taxes: 65.4%
Here:
65%
State:
66%
(% for various income ranges: 52.6% for AGIs below $10k, 63.0% for AGIs $10k-25k, 66.9% for AGIs $25k-50k, 70.3% for AGIs $50k-75k, 67.0% for AGIs $75k-100k, 68.6% for AGIs over 100k)
Likely homosexual households (counted as self-reported same-sex unmarried-partner households)
Lesbian couples: 0.2% of all households
Gay men: 0.1% of all households
Household received Food Stamps/SNAP in the past 12 months: 1,352 Household did not receive Food Stamps/SNAP in the past 12 months: 20,525
Women who had a birth in the past 12 months: 593 (359 now married, 235 unmarried) Women who did not have a birth in the past 12 months: 15,048 (6,769 now married, 8,245 unmarried)
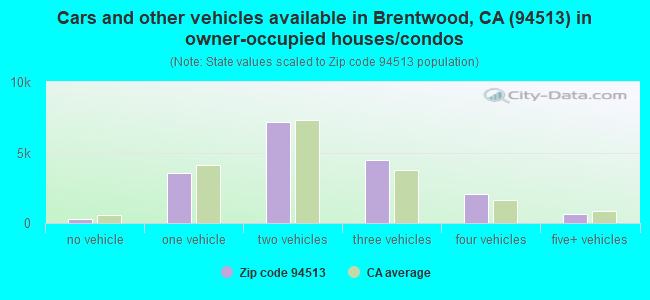
Housing units in zip code 94513 with a mortgage: 13,726 (1,490 second mortgage, 121 home equity loan, 1,161 both second mortgage and home equity loan) Houses without a mortgage: 151
Median monthly owner costs for units with a mortgage: $3,169 Median monthly owner costs for units without a mortgage: $981
Residents with income below the poverty level in 2022:
This zip code:
6.8%
Whole state:
12.2%
Residents with income below 50% of the poverty level in 2022:
This zip code:
3.5%
Whole state:
6.2%
Median number of rooms in houses and condos:
Here:
7.1
State:
6.0
Median number of rooms in apartments:
Here:
5.1
State:
3.9
Notable locations in this zip code not listed on our city pages
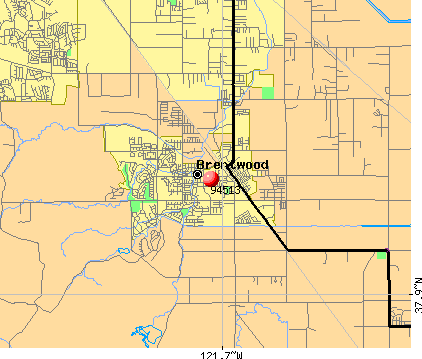
Notable locations in zip code 94513: Stone House (A), Knoll Organic Farms (B), Ghiggeri - Stonebarger Farm (C), Terada Farms (D), Vaquero Farms (E), Smith Family Farms (F), Pease Ranch (G), Lions Community Center (H), Brentwood Branch Contra Costa County Library (I), Brentwood City Hall (J), Valley Oak Nursery (K), Village Nurseries Landscape Center (L), Eden Plains Nursery (M), Asahi Nursery (N), Perez Nursery (O), East Contra Costa Fire Protection District Station 52 (P), East Contra Costa Fire Protection District Station 54 (Q). Display/hide their locations on the map
Churches in zip code 94513 include: Soul's Harbor Church (A), Saint Alban's Episcopal Church (B), Neighborhood Church (C), Grace Bible Fellowship Church (D), First United Pentecostal Church (E), Church of Christ (F), Brentwood Community Methodist Church (G), Brentwood Baptist Church (H). Display/hide their locations on the map
Parks in zip code 94513 include: John Marsh Home State Historic Park (1), Brentwood Park (2), McClarren Park (3), Sunset Park (4). Display/hide their locations on the map
11,854 married couples with children.
3,065 single-parent households (663 men, 2,402 women).
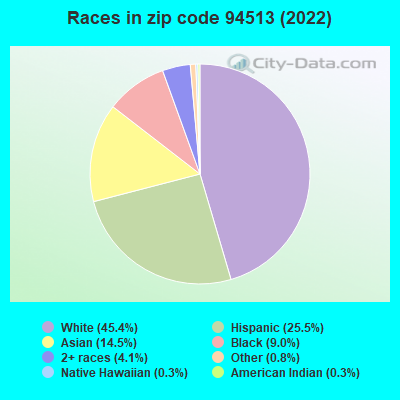
71.9% of residents of 94513 zip code speak English at home.
13.8% of residents speak Spanish at home (68% very well, 18% well, 12% not well, 2% not at all).
4.1% of residents speak other Indo-European language at home (73% very well, 18% well, 9% not well, 1% not at all).
8.6% of residents speak Asian or Pacific Island language at home (61% very well, 28% well, 8% not well, 2% not at all).
1.5% of residents speak other language at home (95% very well, 5% well).
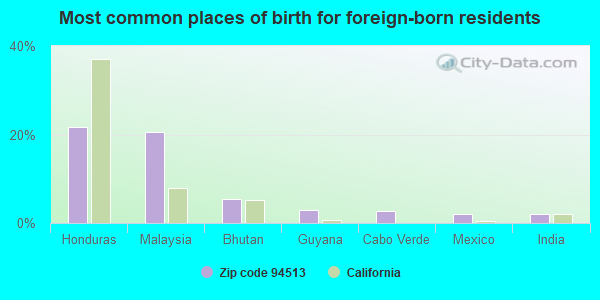
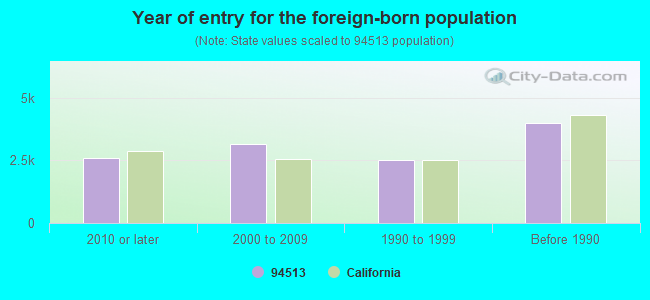
Foreign born population: 11,363 (17.0%) (65.6% of them are naturalized citizens)
This zip code:
17.0%
Whole state:
26.7%
22%Honduras
21%Malaysia
5%Bhutan
3%Guyana
3%Cabo Verde
2%Mexico
2%India
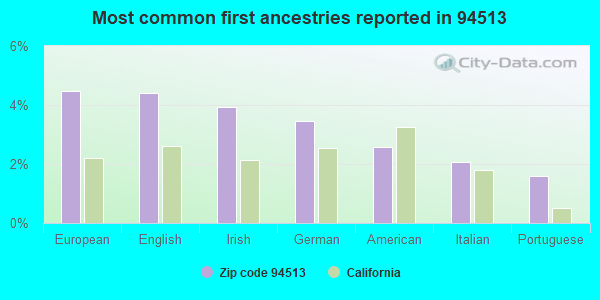
4%European
4%English
4%Irish
3%German
3%American
2%Italian
2%Portuguese
Year of entry for the foreign-born population
2,5932010 or later
3,1462000 to 2009
2,5111990 to 1999
4,007Before 1990
Major facilities with environmental interests located in this zip code:
LIBERTY UNION HIGH SCHOOL DIST (850 2ND ST in BRENTWOOD, CA)
(National Center for Education Statistics) - STATE ID-0733980 Small Quantity Generators, between 100 kg and 1000 kg of hazardous waste/month (Resource Conservation and Recovery Act (tracking hazardous waste))
CASEYS AUTO BODY (4515 OHARA AVE in BRENTWOOD, CA)
STATE MASTER (California - Hazardous Waste Tracking) - HAZARDOU WASTE PROGRAM CRITERIA AND HAZARDOUS AIR POLLUTANT INVENTORY (Inventory of air pollution sources) Small Quantity Generators, between 100 kg and 1000 kg of hazardous waste/month (Resource Conservation and Recovery Act (tracking hazardous waste)) - notification Business SIC classification: TOP, BODY, AND UPHOLSTERY REPAIR SHOPS AND PAINT SHOPS Organizations: CARL AND MIKE CASEY (CONTACT/OWNER)
LONGS DRUG STORES NO 511 (1175 SECOND ST in BRENTWOOD, CA)
STATE MASTER (California - Hazardous Waste Tracking) - HAZARDOU WASTE PROGRAM Small Quantity Generators, between 100 kg and 1000 kg of hazardous waste/month (Resource Conservation and Recovery Act (tracking hazardous waste)) - notification Organizations: LONGS DRUG STORES CAL (CONTACT/OWNER)
Alternative names: LONGS DRUG STORE #511
CHEVRON STATION NO 96911 (336 OAK STREET in BRENTWOOD, CA)
STATE MASTER (California - Hazardous Waste Tracking) - HAZARDOU WASTE PROGRAM Small Quantity Generators, between 100 kg and 1000 kg of hazardous waste/month (Resource Conservation and Recovery Act (tracking hazardous waste)) - notification Organizations: CHEVRON PRODUCTS CO (CONTACT/OWNER)
NYBERG TRUCKING (235 EAGLE LN in BRENTWOOD, CA)
STATE MASTER (California - Hazardous Waste Tracking) - HAZARDOU WASTE PROGRAM TRANSPORTER (Resource Conservation and Recovery Act (tracking hazardous waste)) - notification Organizations: ROBERT NYBERG (CONTACT/OWNER)
EDNA HILL MIDDLE (140 BIRCH ST. in BRENTWOOD, CA)
(National Center for Education Statistics) - STATE ID-6003651 Organizations: BRENTWOOD UNION ELEMENTARY (SCHOOL DISTRICT)
GARIN ELEMENTARY (250A FIRST ST. in BRENTWOOD, CA)
(National Center for Education Statistics) - STATE ID-6070981 Organizations: BRENTWOOD UNION ELEMENTARY (SCHOOL DISTRICT)
INDEPENDENCE HIGH (929 SECOND ST. in BRENTWOOD, CA)
(National Center for Education Statistics) - STATE ID-0730572 Organizations: LIBERTY UNION HIGH (SCHOOL DISTRICT)
LA PALOMA HIGH (CONT.) (6651 LONE TREE WAY in BRENTWOOD, CA)
(National Center for Education Statistics) - STATE ID-0733998 Organizations: LIBERTY UNION HIGH (SCHOOL DISTRICT)
LOMA VISTA ELEMENTARY (2110 SAN JOSE AVENUE in BRENTWOOD, CA)
(National Center for Education Statistics) - STATE ID-6117410 Organizations: BRENTWOOD UNION ELEMENTARY (SCHOOL DISTRICT)
NUNN (RON) ELEMENTARY (1755 CENTRAL BLVD. in BRENTWOOD, CA)
(National Center for Education Statistics) - STATE ID-6109730 Organizations: BRENTWOOD UNION ELEMENTARY (SCHOOL DISTRICT)
EBMUD BIXLER CHLORINATION FACILITY (ORWOOD ROAD AND BIXLER ROAD in BRENTWOOD, CA)
Small Quantity Generators, between 100 kg and 1000 kg of hazardous waste/month (Resource Conservation and Recovery Act (tracking hazardous waste)) Organizations: EAST BAY MUNICIPAL UTILITY DISTRICT (CONTACT/OPERATOR)
HOME DEPOT USA INC HD 1076 (5631 LONE TREE WAY in BRENTWOOD, CA)
Small Quantity Generators, between 100 kg and 1000 kg of hazardous waste/month (Resource Conservation and Recovery Act (tracking hazardous waste))
Housing units lacking complete plumbing facilities: 1.3% Housing units lacking complete kitchen facilities: 1.7%
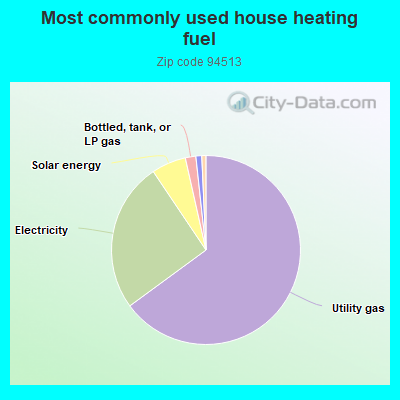
64.8%Utility gas
25.6%Electricity
5.9%Solar energy
1.8%Bottled, tank, or LP gas
1.0%No fuel used
0.7%Wood
Population in 1990: 12,372. Population change in the 1990s: +14,188 (+114.7%).
Place of birth for U.S.-born residents:
This state: 43,510
Northeast: 2,783
Midwest: 3,151
South: 3,135
West: 2,080
45% of the 94513 zip code residents lived in the same house 5 years ago. Out of people who lived in different houses, 44% lived in this county. Out of people who lived in different counties, 50% lived in California.
90% of the 94513 zip code residents lived in the same house 1 year ago. Out of people who lived in different houses, 57% moved from this county. Out of people who lived in different houses, 35% moved from different county within same state. Out of people who lived in different houses, 5% moved from different state. Out of people who lived in different houses, 3% moved from abroad.
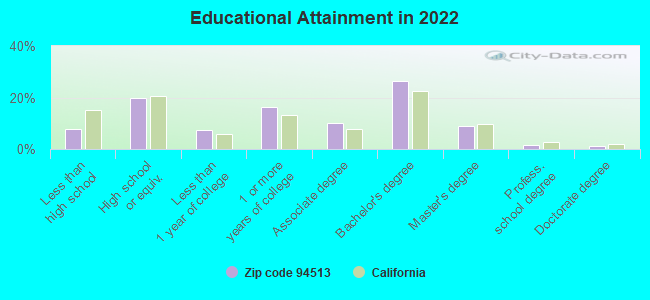
Private vs. public school enrollment:
Students in private schools in grades 1 to 8 (elementary and middle school): 456
Here:
5.9%
California:
10.5%
Students in private schools in grades 9 to 12 (high school): 500
Here:
8.5%
California:
8.5%
Students in private undergraduate colleges: 611
Here:
16.8%
California:
15.9%
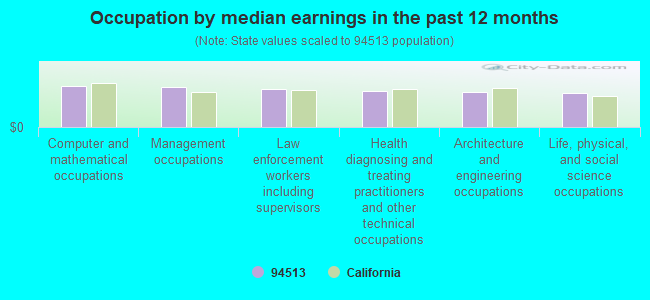
Occupation by median earnings in the past 12 months ($)
143,074Computer and mathematical occupations
137,972Management occupations
129,578Law enforcement workers including supervisors
123,911Health diagnosing and treating practitioners and other technical occupations
121,158Architecture and engineering occupations
115,988Life, physical, and social science occupations
Companies with federal contracts located in this zip code (BRENTWOOD, CA):
DAVIS ULTRASERV INC (470 HARVEST PARK DR; small business) : $2,163,066 in 87 contractsfrom 1999 to 2006
Contracts for Maintenance, Repair and Rebuilding of Equipment -- Medical, Dental, and Veterinary Equipment and Supplies, Maintenance, Repair and Rebuilding of Equipment -- Instruments and Laboratory Equipment, Medical and Surgical Instruments, Equipment, and Supplies, Other Medical Services, and moreby Navy, Army, Department of Veterans Affairs, Air Force, and others Signed by year:2000: $335,148; 2001: $408,946; 2002: $402,063; 2003: $269,600; 2004: $281,520; 2005: $187,710; 2006: $88,146.
Biggest contracts:
$90,792 with Navy for Maintenance, Repair and Rebuilding of Equipment -- Medical, Dental, and Veterinary Equipment and Supplies. Signed on 2001-09-28. Completion date: 2005-09-30.
$87,424 with Army for Maintenance, Repair and Rebuilding of Equipment -- Medical, Dental, and Veterinary Equipment and Supplies. Taking place in TX. Signed on 2003-12-02. Completion date: 2004-09-30.
$87,000 with Department of Veterans Affairs for Maintenance, Repair and Rebuilding of Equipment -- Instruments and Laboratory Equipment. Taking place in NY. Signed on 2000-10-15. Completion date: 2001-09-15.
$81,445 with Navy for Maintenance, Repair and Rebuilding of Equipment -- Medical, Dental, and Veterinary Equipment and Supplies. Signed on 2004-09-24. Completion date: 2005-09-30.
INTERACTIVE SOLUTIONS GROUP (2420 PALM COURT; small business) : $118,596 in 2 contractsfrom 2001 to 2004
$72,380 with Navy for ADP Input/Output and Storage Devices. Signed on 2001-09-05. Completion date: 2001-10-05.
$46,216 with Navy for ADPE System Configuration. Taking place in FL. Signed on 2004-01-16. Completion date: 2004-02-09.
HOPKINS TECHNICAL PRODUCTS INC (470 HARVEST PARK DR #C; small business) : $117,925 in 3 contractsfrom 2000 to 2004
$70,000 with Air Force for Maintenance, Repair and Rebuilding of Equipment -- Miscellaneous. Signed on 2000-07-06. Completion date: 2000-12-16.
$35,949, same as above.Signed on 2000-09-21. Completion date: 2001-09-30.
$11,976 with Air Force for Water Services. Signed on 2004-10-01. Completion date: 2005-09-30.
ALL COMPONENT ENGINEERING & SA (1368 SUNFLOWER LN; small business)
$33,525 with Army for Vehicular Power Transmission Components. Signed on 2005-12-05. Completion date: 2010-11-22.
M C C I (4505 OHARA AVE; small business)
$6,296 with Navy for Other Defense -- Applied Research and Exploratory Development (R&D). Taking place in FL. Signed on 2005-01-06. Completion date: 2005-02-20.
US ULTRASERV (470 HARVEST PARK DR STE A1; small business)
$5,167 with Navy for Medical and Surgical Instruments, Equipment, and Supplies. Taking place in VA. Signed on 2004-04-05. Completion date: 2004-04-06.
Top industries in this zip code by the number of employees in 2005:
Utilities: Electric Power Distribution (over 1000 employees: 1 establishment)
Professional, Scientific, and Technical Services: Display Advertising (500-999: 1)
2005 - 2018 National Fire Incident Reporting System (NFIRS) incidents
According to the data from the years 2005 - 2018 the average number of fire incidents per year is 28. The highest number of fires - 205 took place in 2005, and the least - 3 in 2016. The data has a decreasing trend.
When looking into fire subcategories, the most incidents belonged to: Outside Fires (49.7%), and Structure Fires (32.9%).
Fire incident types reported to NFIRS in Zip Code 94513


 Nearest zip codes: 94548, 94561, 94505, 94514, 94511, 94531.


 According to the data from the years 2005 - 2018 the average number of fire incidents per year is 28. The highest number of fires - 205 took place in 2005, and the least - 3 in 2016. The data has a decreasing trend.
 When looking into fire subcategories, the most incidents belonged to: Outside Fires (49.7%), and Structure Fires (32.9%).