Estimated zip code population in 2022: 552 Zip code population in 2010: 406 Zip code population in 2000: 374
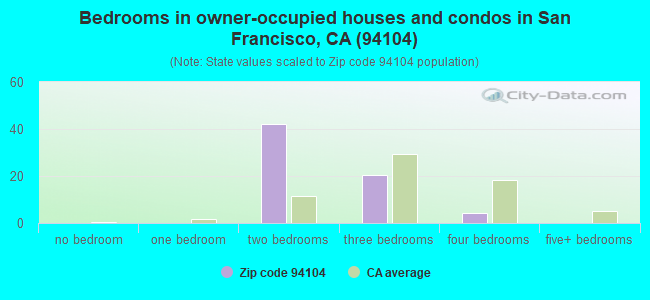
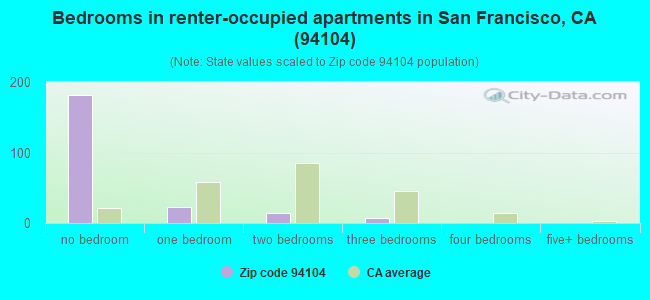
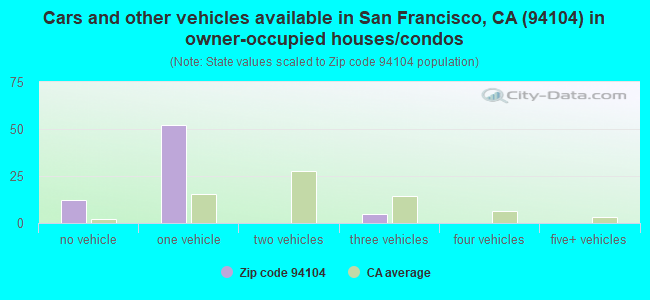
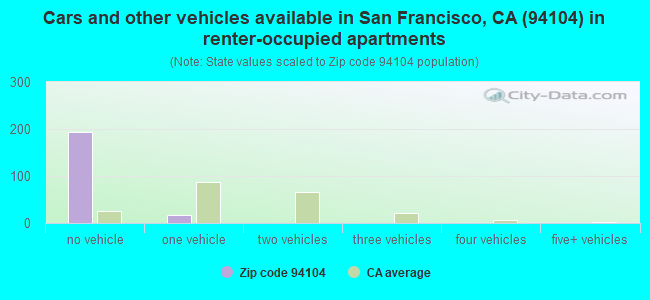
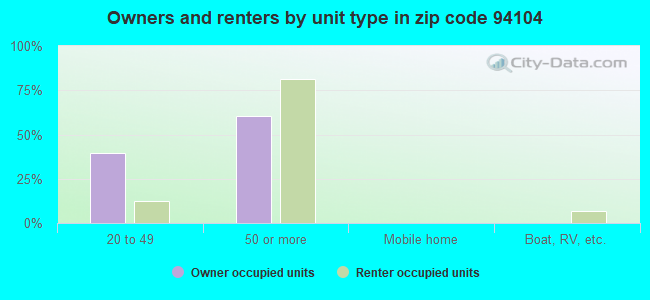
Houses and condos: 314 Renter-occupied apartments: 215
% of renters here:
76%
State:
44%
March 2022 cost of living index in zip code 94104: 171.7 (very high, U.S. average is 100)
Land area: 0.1 sq. mi. Water area: 0.0 sq. mi.
Population density: 7,114 people per square mile
(high).
OSM Map
General Map
Google Map
MSN Map
OSM Map
General Map
Google Map
MSN Map
OSM Map
General Map
Google Map
MSN Map
OSM Map
General Map
Google Map
MSN Map
Please wait while loading the map...
Real estate property taxes paid for housing units in 2022:
This zip code:
0.5% ($10,292)
California:
0.7% ($4,831)
Median real estate property taxes paid for housing units with mortgages in 2022: $10,330 (0.5%) Median real estate property taxes paid for housing units with no mortgage in 2022: $10,572 (0.5%)
Estimated median house/condo value in 2022: $2,171,698
94104:
$2,171,698
California:
$715,900
According to our research of California and other state lists, there was 1 registered sex offender living in 94104 zip code as of May 04, 2024. The ratio of all residents to sex offenders in zip code 94104 is 496 to 1.
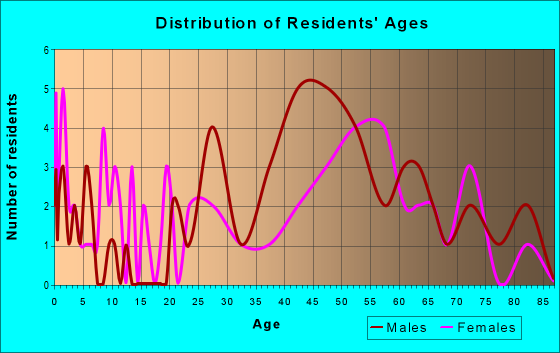
Median resident age:
This zip code:
50.6 years
California median age:
37.9 years
Average household size:
This zip code:
2.0 people
California:
2.8 people
Averages for the 2020 tax year for zip code 94104, filed in 2021:
Average Adjusted Gross Income (AGI) in 2020: $3,076,324 (Individual Income Tax Returns)
Here:
$3,076,324
State:
$95,910
Salary/wage: $422,828 (reported on 69.1% of returns)
Here:
$422,828
State:
$77,331
(% of AGI for various income ranges: 1988.6% for AGIs below $25k, 3936.2% for AGIs $25k-50k, 8996.0% for AGIs $50k-75k, 9430.0% for AGIs $75k-100k, 22498.3% for AGIs $100k-200k, 515856.0% for AGIs over 200k)
Taxable interest for individuals: $65,023 (reported on 57.7% of returns)
This zip code:
$65,023
California:
$2,294
(% of AGI for various income ranges: 150.0% for AGIs below $25k, 32.5% for AGIs $25k-50k, 98.0% for AGIs $50k-75k, 40.0% for AGIs $75k-100k, 413.3% for AGIs $100k-200k, 71946.0% for AGIs over 200k)
Ordinary dividends: $354,804 (reported on 53.6% of returns)
Here:
$354,804
State:
$10,949
(% of AGI for various income ranges: 572.9% for AGIs below $25k, 416.2% for AGIs $25k-50k, 332.0% for AGIs $50k-75k, 890.0% for AGIs $75k-100k, 2208.3% for AGIs $100k-200k, 364012.0% for AGIs over 200k)
Net capital gain/loss in AGI: +$3,732,385 (reported on 54.6% of returns)
Here:
+$3,732,385
State:
+$49,306
(% of AGI for various income ranges: 392.9% for AGIs below $25k, 102.5% for AGIs $25k-50k, 390.0% for AGIs $50k-75k, 1406.7% for AGIs $75k-100k, 3235.0% for AGIs $100k-200k, 3950498.0% for AGIs over 200k)
Profit/loss from business: +$55,157 (reported on 28.9% of returns)
Here:
+$55,157
State:
+$15,671
(% of AGI for various income ranges: 418.6% for AGIs below $25k, 797.5% for AGIs $25k-50k, 2314.0% for AGIs $50k-75k, 1683.3% for AGIs $100k-200k, 24692.0% for AGIs over 200k)
Taxable individual retirement arrangement distribution: $60,971 (reported on 7.2% of returns)
94104:
$60,971
California:
$23,505
(% of AGI for various income ranges: 2933.3% for AGIs $75k-100k, 6776.0% for AGIs over 200k)
Self-employed (Keogh) retirement plans: $62,140 (reported on 5.2% of returns)
94104:
$62,140
California:
$30,163
(% of AGI for various income ranges: 6214.0% for AGIs over 200k)
Total itemized deductions: $1,755,350 (reported on 33.0% of returns)
Here:
$1,755,350
State:
$39,517
(% of AGI for various income ranges: 1510.0% for AGIs below $25k, 2108.0% for AGIs $50k-75k, 4716.7% for AGIs $100k-200k, 1113542.0% for AGIs over 200k)
Charity contributions: $2,104,436 (reported on 25.8% of returns)
Here:
$2,104,436
State:
$12,598
(% of AGI for various income ranges: 116.3% for AGIs $25k-50k, 593.3% for AGIs $100k-200k, 1051320.0% for AGIs over 200k)
Taxes paid: $8,847 (reported on 33.0% of returns)
94104:
$8,847
State:
$8,807
(% of AGI for various income ranges: 292.9% for AGIs below $25k, 420.0% for AGIs $50k-75k, 795.0% for AGIs $100k-200k, 3878.0% for AGIs over 200k)
Earned income credit: $1,267 (reported on 6.2% of returns)
Here:
$1,267
State:
$2,074
(% of AGI for various income ranges: 108.6% for AGIs below $25k)
Percentage of individuals using paid preparers for their 2020 taxes: 90.7%
Here:
91%
State:
92%
(% for various income ranges: 89.5% for AGIs below $25k, 85.7% for AGIs $25k-50k, 88.9% for AGIs $50k-75k, 80.0% for AGIs $75k-100k, 93.3% for AGIs $100k-200k, 94.3% for AGIs over 200k)
Averages for the 2012 tax year for zip code 94104, filed in 2013:
Average Adjusted Gross Income (AGI) in 2012: $589,455 (Individual Income Tax Returns)
Here:
$589,455
State:
$72,726
Salary/wage: $181,232 (reported on 71.5% of returns)
Here:
$181,232
State:
$59,079
(% of AGI for various income ranges: 67.0% for AGIs below $25k, 78.8% for AGIs $25k-50k, 81.7% for AGIs $50k-75k, 73.7% for AGIs $75k-100k, 67.9% for AGIs $100k-200k, 17.7% for AGIs over 200k)
Taxable interest for individuals: $24,435 (reported on 51.8% of returns)
This zip code:
$24,435
California:
$2,146
(% of AGI for various income ranges: 2.7% for AGIs below $25k, 0.6% for AGIs $25k-50k, 1.3% for AGIs $50k-75k, 0.2% for AGIs $75k-100k, 1.7% for AGIs $100k-200k, 2.2% for AGIs over 200k)
Ordinary dividends: $158,779 (reported on 38.0% of returns)
Here:
$158,779
State:
$9,308
(% of AGI for various income ranges: 6.0% for AGIs below $25k, 4.2% for AGIs $25k-50k, 2.9% for AGIs $50k-75k, 3.7% for AGIs $75k-100k, 3.0% for AGIs $100k-200k, 10.8% for AGIs over 200k)
Net capital gain/loss in AGI: +$337,261 (reported on 37.2% of returns)
Here:
+$337,261
State:
+$30,460
(% of AGI for various income ranges: 1.5% for AGIs below $25k, 0.3% for AGIs $25k-50k, 3.4% for AGIs $50k-75k, 0.3% for AGIs $75k-100k, 4.1% for AGIs $100k-200k, 22.9% for AGIs over 200k)
Profit/loss from business: +$57,206 (reported on 23.4% of returns)
Here:
+$57,206
State:
+$17,064
(% of AGI for various income ranges: 18.0% for AGIs below $25k, 16.0% for AGIs $25k-50k, 14.5% for AGIs $50k-75k, 15.0% for AGIs $75k-100k, 6.5% for AGIs $100k-200k, 1.5% for AGIs over 200k)
Taxable individual retirement arrangement distribution: $52,225 (reported on 8.8% of returns)
94104:
$52,225
California:
$19,557
(% of AGI for various income ranges: 7.1% for AGIs below $25k, 2.5% for AGIs $50k-75k, 3.2% for AGIs $100k-200k, 0.6% for AGIs over 200k)
Self-employment retirement plans: $36,414 (reported on 5.1% of returns)
94104:
$36,414
California:
$24,530
Total itemized deductions: $168,783 (16% of AGI, reported on 54.7% of returns)
Here:
$168,783
State:
$34,004
Here:
16.2% of AGI
State:
22.7% of AGI
(% of AGI for various income ranges: 37.7% for AGIs below $25k, 8.8% for AGIs $25k-50k, 14.6% for AGIs $50k-75k, 19.7% for AGIs $75k-100k, 19.7% for AGIs $100k-200k, 15.4% for AGIs over 200k)
Charity contributions: $50,410 (reported on 35.0% of returns)
Here:
$50,410
State:
$4,659
(% of AGI for various income ranges: 2.5% for AGIs below $25k, 1.1% for AGIs $50k-75k, 1.6% for AGIs $75k-100k, 0.7% for AGIs $100k-200k, 3.2% for AGIs over 200k)
Taxes paid: $86,170 (reported on 54.0% of returns)
94104:
$86,170
State:
$14,448
(% of AGI for various income ranges: 4.4% for AGIs below $25k, 1.8% for AGIs $25k-50k, 4.4% for AGIs $50k-75k, 7.1% for AGIs $75k-100k, 9.1% for AGIs $100k-200k, 8.0% for AGIs over 200k)
Earned income credit: $1,311 (reported on 6.6% of returns)
Here:
$1,311
State:
$2,286
(% of AGI for various income ranges: 3.3% for AGIs below $25k)
Percentage of individuals using paid preparers for their 2012 taxes: 61.3%
Here:
61%
State:
64%
(% for various income ranges: 48.4% for AGIs below $25k, 52.4% for AGIs $25k-50k, 52.9% for AGIs $50k-75k, 45.5% for AGIs $75k-100k, 65.2% for AGIs $100k-200k, 85.3% for AGIs over 200k)
Averages for the 2004 tax year for zip code 94104, filed in 2005:
Average Adjusted Gross Income (AGI) in 2004: $331,193 (Individual Income Tax Returns)
Here:
$331,193
State:
$58,600
Salary/wage: $101,227 (reported on 63.5% of returns)
Here:
$101,227
State:
$49,455
(% of AGI for various income ranges: 65.7% for AGIs $10k-25k, 75.8% for AGIs $25k-50k, 72.2% for AGIs $50k-75k, 67.0% for AGIs $75k-100k, 14.5% for AGIs over 100k)
Taxable interest for individuals: $22,631 (reported on 60.4% of returns)
This zip code:
$22,631
California:
$2,365
(% of AGI for various income ranges: 4.4% for AGIs $10k-25k, 4.1% for AGIs $25k-50k, 1.8% for AGIs $50k-75k, 2.8% for AGIs $75k-100k, 3.7% for AGIs over 100k)
Taxable dividends: $140,860 (reported on 46.1% of returns)
Here:
$140,860
State:
$4,746
(% of AGI for various income ranges: 8.5% for AGIs $10k-25k, 4.6% for AGIs $25k-50k, 6.6% for AGIs $50k-75k, 5.6% for AGIs $75k-100k, 19.3% for AGIs over 100k)
Net capital gain/loss: +$199,943 (reported on 41.5% of returns)
Here:
+$199,943
State:
+$23,418
(% of AGI for various income ranges: -0.9% for AGIs $10k-25k, 3.7% for AGIs $25k-50k, 1.9% for AGIs $50k-75k, 0.9% for AGIs $75k-100k, 24.6% for AGIs over 100k)
Profit/loss from business: +$35,923 (reported on 21.1% of returns)
Here:
+$35,923
State:
+$16,826
(% of AGI for various income ranges: 14.1% for AGIs $10k-25k, 11.9% for AGIs $25k-50k, 12.8% for AGIs $50k-75k, 15.1% for AGIs $75k-100k, 1.9% for AGIs over 100k)
IRA payment deduction: $3,524 (reported on 1.7% of returns)
94104:
$3,524
California:
$3,192
Self-employed pension: $26,767 (reported on 4.9% of returns)
Here:
$26,767
California:
$17,688
Total itemized deductions: $103,027 (15% of AGI, reported on 48.5% of returns)
Here:
$103,027
State:
$28,113
Here:
14.8% of AGI
State:
25.3% of AGI
(% of AGI for various income ranges: 36.0% for AGIs $10k-25k, 27.5% for AGIs $25k-50k, 20.4% for AGIs $50k-75k, 21.4% for AGIs $75k-100k, 13.5% for AGIs over 100k)
Charity contributions deductions: $34,235 (4% of AGI, reported on 33.4% of returns)
Here:
$34,235
State:
$3,923
Here:
3.6% of AGI
State:
3.3% of AGI
(% of AGI for various income ranges: 1.2% for AGIs $10k-25k, 0.9% for AGIs $25k-50k, 1.6% for AGIs $50k-75k, 2.4% for AGIs $75k-100k, 3.4% for AGIs over 100k)
Total tax: $84,290 (reported on 79.2% of returns)
94104:
$84,290
State:
$10,761
(% of AGI for various income ranges: 6.2% for AGIs $10k-25k, 9.9% for AGIs $25k-50k, 13.8% for AGIs $50k-75k, 15.3% for AGIs $75k-100k, 19.5% for AGIs over 100k)
Earned income credit: $1,238 (reported on 6.5% of returns)
Here:
$1,238
State:
$1,763
Percentage of individuals using paid preparers for their 2004 taxes: 71.8%
Here:
72%
State:
66%
(% for various income ranges: 72.4% for AGIs below $10k, 66.5% for AGIs $10k-25k, 62.8% for AGIs $25k-50k, 61.0% for AGIs $50k-75k, 70.4% for AGIs $75k-100k, 84.7% for AGIs over 100k)
Likely homosexual households (counted as self-reported same-sex unmarried-partner households)
Lesbian couples: 0.0% of all households
Gay men: 10.3% of all households
Household received Food Stamps/SNAP in the past 12 months: 69 Household did not receive Food Stamps/SNAP in the past 12 months: 221
Women who did not have a birth in the past 12 months: 101 (57 now married, 43 unmarried)
Housing units in zip code 94104 with a mortgage: 41 Median monthly owner costs for units with a mortgage: $3,876 Median monthly owner costs for units without a mortgage: $1,556
Residents with income below the poverty level in 2022:
This zip code:
19.2%
Whole state:
12.2%
Residents with income below 50% of the poverty level in 2022:
This zip code:
19.2%
Whole state:
6.2%
Median number of rooms in houses and condos:
Here:
4.5
State:
6.0
Median number of rooms in apartments:
Here:
1.3
State:
3.9
Notable locations in this zip code not listed on our city pages
Notable locations in zip code 94104: Shell Building (A), Russ Building (B), Pacific Coast Stock Exchange (C), Mills Building (D), Hobart Building (E), Hallidie Building (F), DeYoung Building (G). Display/hide their locations on the map
Size of family households: 68 2-persons, 16 3-persons, 8 4-persons, 17 5-persons
Size of nonfamily households: 120 1-person, 56 2-persons
39 married couples with children.
10 single-parent households (3 men, 7 women).
42.6% of residents of 94104 zip code speak English at home.
3.1% of residents speak Spanish at home (100% very well).
14.4% of residents speak other Indo-European language at home (51% very well, 49% well).
37.9% of residents speak Asian or Pacific Island language at home (6% very well, 18% well, 25% not well, 50% not at all).
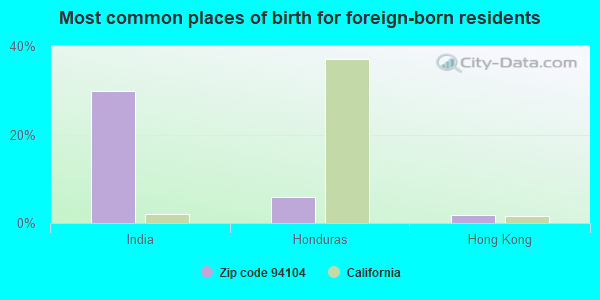
Foreign born population: 268 (48.5%) (43.9% of them are naturalized citizens)
Facilities with environmental interests located in this zip code:
MCKESSON CORP (1 POST ST in SAN FRANCISCO, CA)
STATE MASTER (California - Hazardous Waste Tracking) - HAZARDOU WASTE PROGRAM COMPLIANCE ACTIVITY (Tracking inspections of insecticide, fungicide, and rodenticide, and toxic substances) STATE MASTER (New Jersey environmental info) - NJEMS-002500, PESTICIDES - MANUFACTURE, NJEMS-002908, Small Quantity Generators, between 100 kg and 1000 kg of hazardous waste/month (Resource Conservation and Recovery Act (tracking hazardous waste)) - notification TRANSPORTER (Resource Conservation and Recovery Act (tracking hazardous waste)) - notification Organizations: PENN CHAMP INC SUBSIDIARY OF BISSELL INC, QUALIS INC, CROCKER PLAZA CORP (CONTACT/OWNER)
Alternative names: CROCKER PLAZA CO, MCKESSON PLAZA BLDG, SIMPSON PAPER COMPANY
HYATT REGENCY SAN FRANCISCO (5 EMBACADERO CENTER in SAN FRANCISCO, CA)
STATE MASTER (California - Hazardous Waste Tracking) - HAZARDOU WASTE PROGRAM Small Quantity Generators, between 100 kg and 1000 kg of hazardous waste/month (Resource Conservation and Recovery Act (tracking hazardous waste)) - notification Organizations: CARROLL JIM (CONTACT/OWNER)
KANSAI ENGINEERING INC (818 MISSION ST 3RD FLOOR in SAN FRANCISCO, CA)
(Resource Conservation and Recovery Act (tracking hazardous waste))
CHEVRON CORP (225 BUSH ST in SAN FRANCISCO, CA)
COMPLIANCE ACTIVITY (Tracking inspections of insecticide, fungicide, and rodenticide, and toxic substances) CRITERIA AND HAZARDOUS AIR POLLUTANT INVENTORY (Inventory of air pollution sources) Business SIC classification: REFUSE SYSTEMS Business NAICS classification: SOLID WASTE LANDFILL.
465 CALIFORNIA STREET BUILDING (465 CALIFORNIA STREET in SAN FRANCISCO, CA)
(Resource Conservation and Recovery Act (tracking hazardous waste))
555 CALIFORNIA STREET BUILDING (555 CALIFORNIA STREET in SAN FRANCISCO, CA)
(Resource Conservation and Recovery Act (tracking hazardous waste))
HAYMAN BROS. (580 CALIFORNIA ST 16TH FL in SAN FRANCISCO, CA)
COMPLIANCE ACTIVITY (Tracking inspections of insecticide, fungicide, and rodenticide, and toxic substances)
GILMORE STEEL (120 MONTGOMERY ST in SAN FRANCISCO, CA)
COMPLIANCE ACTIVITY (Tracking inspections of insecticide, fungicide, and rodenticide, and toxic substances)
B OF A WORLD HQ (MILTON MEYER & CO) (555 CALIFORNIA ST in SAN FRANCISCO, CA)
COMPLIANCE ACTIVITY (Tracking inspections of insecticide, fungicide, and rodenticide, and toxic substances)
NORTH POINT THEATER ASSOCIATES (367 PINE STREET, STE. 500 in SAN FRANCISCO, CA)
COMPLIANCE ACTIVITY (Tracking inspections of insecticide, fungicide, and rodenticide, and toxic substances)
NORTH POINT THEATRE ASSOCIATES, LLC (369 PINE STREET., STE #700 in SAN FRANCISCO, CA)
COMPLIANCE ACTIVITY (Tracking inspections of insecticide, fungicide, and rodenticide, and toxic substances)
Housing units lacking complete plumbing facilities: 40.5% Housing units lacking complete kitchen facilities: 61.3%
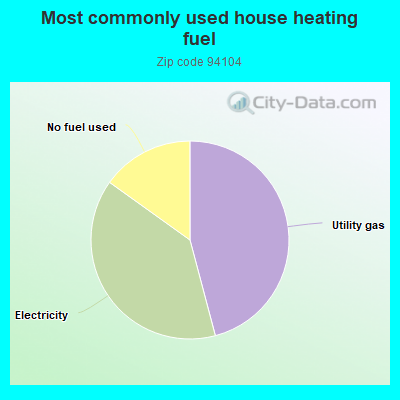
46.2%Utility gas
39.3%Electricity
15.2%No fuel used
Population in 1990: 760.
Place of birth for U.S.-born residents:
This state: 154
Northeast: 24
Midwest: 34
South: 46
West: 21
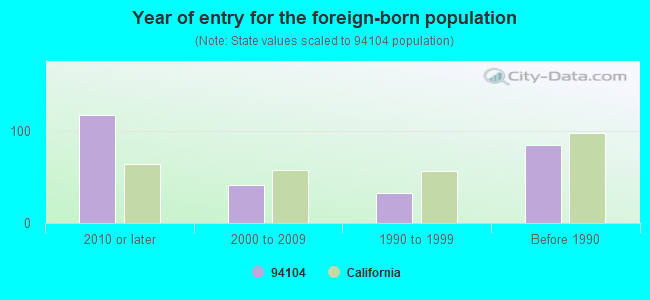
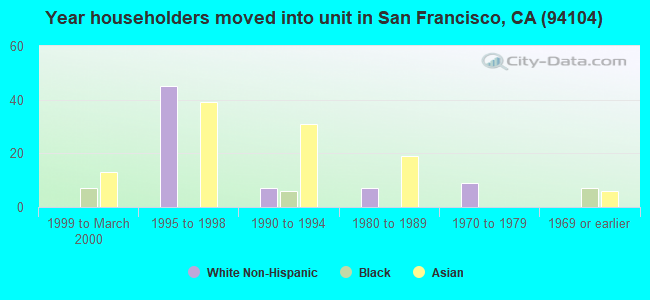
59% of the 94104 zip code residents lived in the same house 5 years ago. Out of people who lived in different houses, 100% lived in this county.
75% of the 94104 zip code residents lived in the same house 1 year ago. Out of people who lived in different houses, 70% moved from this county. Out of people who lived in different houses, 13% moved from different county within same state. Out of people who lived in different houses, 10% moved from abroad.
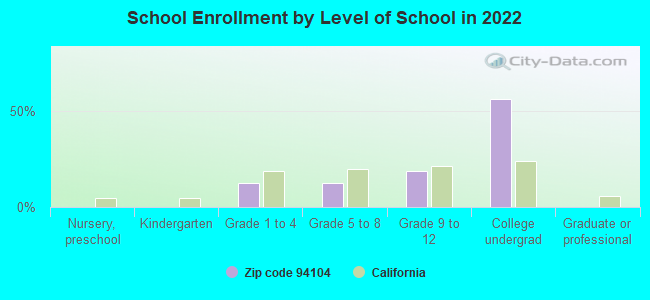
Private vs. public school enrollment:
Students in private schools in grades 1 to 8 (elementary and middle school): 24
Here:
78.1%
California:
10.5%
Students in private schools in grades 9 to 12 (high school): 2
Here:
13.4%
California:
8.5%
Students in private undergraduate colleges:
Here:
0.0%
California:
15.9%
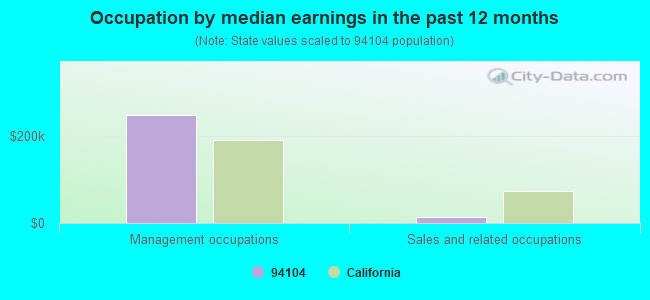
Occupation by median earnings in the past 12 months ($)
248,553Management occupations
14,392Sales and related occupations
Companies with biggest federal contracts located in this zip code:
MC KESSON HBOC, INC (1 POST ST in SAN FRANCISCO, CA) : $1,434,017,810 in 22561 contractsfrom 1999 to 2006
Contracts for Drugs and Biologicals by Defense Logistics Agency Signed by year:2000: $90,352,017; 2001: $105,277,074; 2002: $97,129,504; 2003: $0; 2004: $177,605,847; 2005: $608,100,380; 2006: $329,866,837.
Biggest contracts:
$1,148,121 with Defense Logistics Agency for Drugs and Biologicals. Taking place in AZ. Signed on 2005-08-17. Completion date: 2005-08-26.
$983,284, same as above.Signed on 2005-10-22. Completion date: 2005-11-08.
$983,284, same as above.Signed on 2006-01-11. Completion date: 2006-01-28.
$962,056, same as above.Signed on 2005-04-23. Completion date: 2005-05-10.
CHEVRON U S A INC (345 CALIFORNIA ST STE 3200 in SAN FRANCISCO, CA) : $11,816,001 in 44 contractsfrom 2003 to 2006
Contracts for Maintenance, Repair and Rebuilding of Equipment -- Refrigeration, Air Conditioning, and Air Circulating Equipment, Maintenance, Repair or Alteration of Real Property -- Office Buildings, Maintenance, Repair and Rebuilding of Equipment -- Instruments and Laboratory Equipment, Services -- Basic Research (R&D), and moreby Army, Air Force, Navy Signed by year:2000: $0; 2001: $0; 2002: $0; 2003: $6,258,934; 2004: $1,122,916; 2005: $3,369,167; 2006: $1,064,984.
Biggest contracts:
$1,738,676 with Army for Maintenance, Repair and Rebuilding of Equipment -- Refrigeration, Air Conditioning, and Air Circulating Equipment. Taking place in NJ. Signed on 2003-12-30. Completion date: 2005-01-01.
$1,658,035 with Army for Maintenance, Repair and Rebuilding of Equipment -- Refrigeration, Air Conditioning, and Air Circulating Equipment. Taking place in MN. Signed on 2005-07-26. Completion date: 2005-01-25.
$1,110,000 with Army for Maintenance, Repair and Rebuilding of Equipment -- Refrigeration, Air Conditioning, and Air Circulating Equipment. Taking place in NJ. Signed on 2003-07-01. Completion date: 2003-12-31.
$956,000 with Air Force for Maintenance, Repair or Alteration of Real Property -- Office Buildings. Signed on 2003-09-30. Completion date: 2003-10-17.
HELLMUTH, OBATA & KASSABAUM, I (1 BUSH ST STE 200 in SAN FRANCISCO, CA) : $6,186,379 in 4 contractsfrom 2005 to 2006
$5,850,000 with Navy for Architect - Engineer Services (including landscaping, interior layout, and designing). Taking place in HI. Signed on 2005-07-11. Completion date: 2006-07-10.
$217,500, same as above.Signed on 2006-04-12. Completion date: 2006-07-10.
$64,091, same as above.Signed on 2006-04-27. Completion date: 2007-04-26.
$54,788, same as above.Signed on 2006-04-12. Completion date: 2006-07-10.
W&K CONSULTING ENGINEERS (417 MONTGOMERY STREET, SUI in SAN FRANCISCO, CA) : $2,796,156 in 22 contractsfrom 2000 to 2004
Contracts for Other Architect and Engineering Services, Architect - Engineer Services (including landscaping, interior layout, and designing), Other Professional Services by U.S. Army Corps of Engineers - civil program financing only, Navy, Army Signed by year:2000: $1,343,091; 2001: $701,261; 2002: $589,488; 2003: $0; 2004: $162,316; 2005: $0; 2006: $0.
Biggest contracts:
$500,000 with U.S. Army Corps of Engineers - civil program financing only for Other Architect and Engineering Services. Signed on 2000-06-26. Completion date: 2000-05-31.
$382,873, same as above.Signed on 2001-03-30. Completion date: 2001-07-20.
$349,760, same as above.Signed on 2000-09-08. Completion date: 2000-01-17.
$230,000 with Navy for Other Architect and Engineering Services. Taking place in HI. Signed on 2002-03-14. Completion date: 2002-03-13.
ROCKWOOD ATRIUM, LLC, A DELAWARE LC ( in San Francisco, CA; small business) : $2,711,076 in 14 contractsfrom 2005 to 2006
Contracts for Lease or Rental of Facilities -- Office Buildings by Public Buildings Service Signed by year:2000: $0; 2001: $0; 2002: $0; 2003: $0; 2004: $0; 2005: $1,129,615; 2006: $1,581,461.
Biggest contracts:
$225,923 with Public Buildings Service for Lease or Rental of Facilities -- Office Buildings. Signed on 2006-07-01. Completion date: 2006-09-30.
$225,923, same as above.Signed on 2006-07-01. Completion date: 2006-09-30.
$225,923, same as above.Signed on 2006-07-01. Completion date: 2006-09-30.
$225,923, same as above.Signed on 2006-04-01. Completion date: 2006-09-30.
WINZLER & KELLY CONSULTING ENG (200 PINE ST STE 600 in SAN FRANCISCO, CA) : $2,702,199 in 45 contractsfrom 1999 to 2005
Contracts for Other Professional Services, Other Architect and Engineering Services, Architect - Engineer Services (including landscaping, interior layout, and designing), Engineering and Technical Services by U.S. Army Corps of Engineers - civil program financing only, Navy, Army Signed by year:2000: $1,097,131; 2001: $148,209; 2002: $0; 2003: $149,543; 2004: $49,510; 2005: $972,200; 2006: $0.
Biggest contracts:
$969,639 with U.S. Army Corps of Engineers - civil program financing only for Other Professional Services. Signed on 2005-02-11. Completion date: 2005-02-03.
$555,293 with Navy for Other Architect and Engineering Services. Taking place in HI. Signed on 2000-02-03. Completion date: 2000-07-21.
$272,183 with U.S. Army Corps of Engineers - civil program financing only for Architect - Engineer Services (including landscaping, interior layout, and designing). Signed on 2000-12-11. Completion date: 2000-12-11.
$147,976 with Navy for Other Architect and Engineering Services. Taking place in HI. Signed on 1999-11-16. Completion date: 2000-07-21.
SUMMATION LEGAL TECHNOLOGIES I (550 CALIFORNIA ST # 8 in SAN FRANCISCO, CA) : $1,283,662 in 38 contractsfrom 2000 to 2006
Contracts for ADP Software, Maintenance, Repair and Rebuilding of Equipment -- Automatic Data Processing Equipment (Including Firmware), Software, Supplies and Support Equipment, Legal Services, ADP Supplies, and moreby Internal Revenue Service, National Labor Relations Board, Civilian Health and Medical Program of the Uniformed Services, Office of the, Offices, Boards and Divisions (includes Attorney General, Deputy Attorney General, etc.), and others Signed by year:2000: $25,000; 2001: $43,000; 2002: $169,290; 2003: $424,325; 2004: $114,313; 2005: $413,308; 2006: $94,426.
Biggest contracts:
$330,000 with Internal Revenue Service for ADP Software. Taking place in MD. Signed on 2003-05-15. Completion date: 2003-05-15.
$96,353 with National Labor Relations Board for ADP Software. Signed on 2005-09-21. Effective on 2005-09-20. Completion date: 2005-09-30.
$89,737 with Internal Revenue Service for ADP Software. Taking place in DC. Signed on 2005-09-06. Completion date: 2005-09-06.
$80,557 with Civilian Health and Medical Program of the Uniformed Services, Office of the for ADP Software. Taking place in CO. Signed on 2006-04-19. Completion date: 2007-05-15.
XYTHOS SOFTWARE, INC (ONE BUSH STREET in SAN FRANCISCO, CA) : $1,132,850 in 11 contractsfrom 2003 to 2006
Contracts for ADP Facility Operation and Maintenance Services, ADP Software, Education Services, Other ADP and Telecommunications Services (includes data storage on tapes, compact disks, etc.), and moreby Defense Information Systems Agency, Navy, Air Force, Department of Defense, and others Signed by year:2000: $0; 2001: $0; 2002: $0; 2003: $81,000; 2004: $449,500; 2005: $653,850; 2006: -$51,500.
Biggest contracts:
$449,500 with Defense Information Systems Agency for ADP Facility Operation and Maintenance Services. Signed on 2004-05-25. Completion date: 2005-05-31.
$388,375 with Navy for ADP Software. Taking place in VA. Signed on 2005-03-31. Completion date: 2006-02-28.
$78,400 with Air Force for Education Services. Signed on 2005-08-22. Completion date: 2006-08-22.
$77,675 with Department of Defense for Other ADP and Telecommunications Services (includes data storage on tapes, compact disks, etc.). Taking place in VA. Signed on 2005-06-16. Completion date: 2006-03-31.
INMON CORPORATION (580 CALIFORNIA ST STE 500 in SAN FRANCISCO, CA) : $570,683 in 6 contractsfrom 2004 to 2006
Contracts for ADP Software, ADP Input/Output and Storage Devices, Maintenance, Repair and Rebuilding of Equipment -- Automatic Data Processing Equipment (Including Firmware), Software, Supplies and Support Equipment, Technical Representation Services -- Automatic Data Processing Equipment (Including Firmware), Software, Supplies and Support Equipment by Navy, Federal Technology Service, EXECUTIVE OFFICE OF THE PRESIDENT, National Oceanic and Atmospheric Administration/Under Secretary for Oceans and Atmosphere, and others Signed by year:2000: $0; 2001: $0; 2002: $0; 2003: $0; 2004: $22,022; 2005: $539,861; 2006: $8,800.
Biggest contracts:
$482,250 with Navy for ADP Software. Signed on 2005-03-14. Completion date: 2005-03-14.
$51,011 with Federal Technology Service for ADP Input/Output and Storage Devices. Signed on 2005-09-15. Completion date: 2005-09-30.
$18,018 with EXECUTIVE OFFICE OF THE PRESIDENT for ADP Software. Taking place in DC. Signed on 2004-12-30. Effective on 2004-12-31. Completion date: 2005-12-30.
$8,800 with Navy for ADP Software. Signed on 2006-03-01. Completion date: 2006-03-14.
PG&E ENERGY SERVICES CORPORATI (345 CALIFORNIA ST. in SAN FRANCISCO, CA)
$96,519 with Navy for Maintenance, Repair and Rebuilding of Equipment -- Metalworking Machinery. Signed on 2000-01-20. Completion date: 2000-02-20.
Top industries in this zip code by the number of employees in 2005:
Detailed HMDA statistics for the following Tracts:0117.00
Private Mortgage Insurance Companies Aggregated Statistics For Year 2002 (Based on 2 partial tracts)
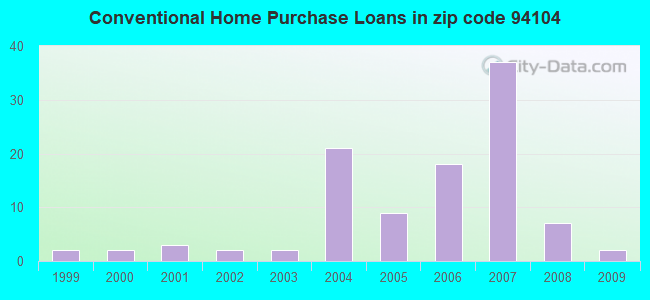
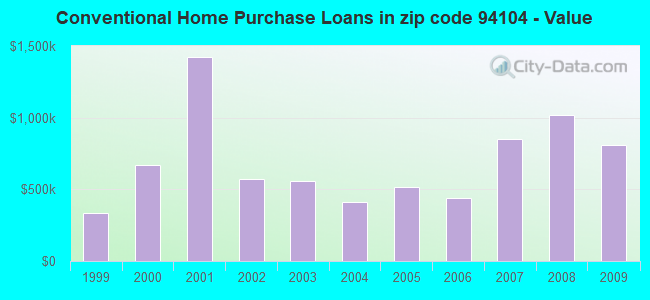
A) Conventional Home Purchase Loans
Number
Average Value
LOANS ORIGINATED
0
$0
APPLICATIONS APPROVED, NOT ACCEPTED
1
$330,650
APPLICATIONS DENIED
0
$0
APPLICATIONS WITHDRAWN
1
$136,750
FILES CLOSED FOR INCOMPLETENESS
0
$0
Detailed PMIC statistics for the following Tracts:0117.00
2005 - 2018 National Fire Incident Reporting System (NFIRS) incidents
According to the data from the years 2005 - 2018 the average number of fires per year is 50. The highest number of reported fire incidents - 85 took place in 2011, and the least - 12 in 2016. The data has a decreasing trend.
When looking into fire subcategories, the most incidents belonged to: Structure Fires (64.0%), and Outside Fires (31.4%).
Fire incident types reported to NFIRS in Zip Code 94104


 Nearest zip codes: 94108, 94105, 94111, 94133, 94103, 94109.


 According to the data from the years 2005 - 2018 the average number of fires per year is 50. The highest number of reported fire incidents - 85 took place in 2011, and the least - 12 in 2016. The data has a decreasing trend.
 When looking into fire subcategories, the most incidents belonged to: Structure Fires (64.0%), and Outside Fires (31.4%).