Estimated zip code population in 2022: 7,082 Zip code population in 2010: 7,089 Zip code population in 2000: 6,857
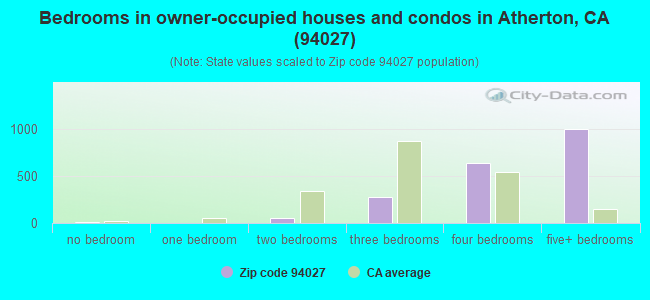
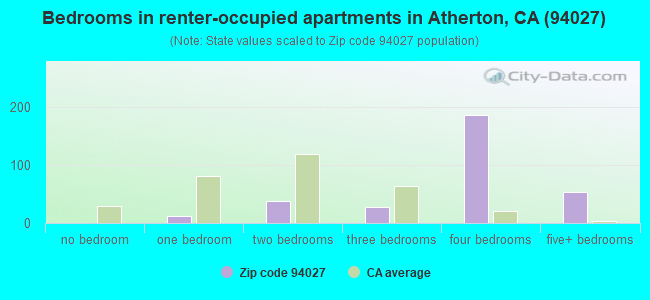
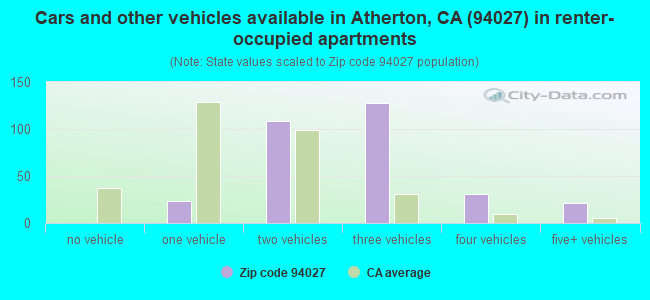
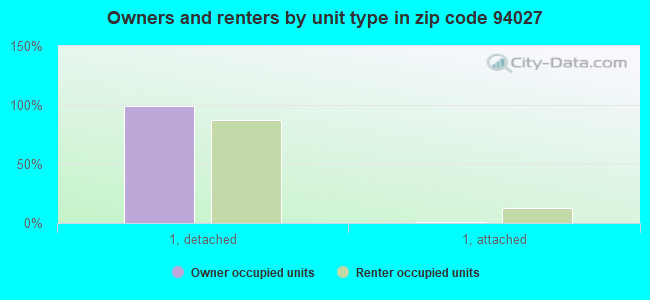
Houses and condos: 2,633 Renter-occupied apartments: 313
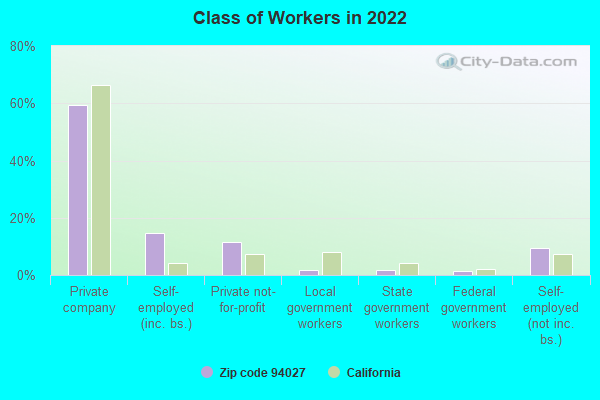
% of renters here:
14%
State:
44%
March 2022 cost of living index in zip code 94027: 131.9 (high, U.S. average is 100)
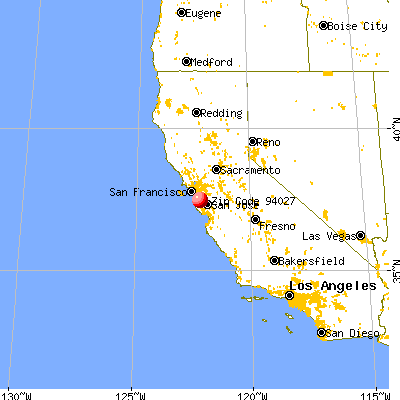
Land area: 5.2 sq. mi. Water area: 0.0 sq. mi.
Population density: 1,363 people per square mile
(low).
OSM Map
General Map
Google Map
MSN Map
OSM Map
General Map
Google Map
MSN Map
OSM Map
General Map
Google Map
MSN Map
OSM Map
General Map
Google Map
MSN Map
Please wait while loading the map...
Real estate property taxes paid for housing units in 2022:
This zip code:
0.5% ($10,292)
California:
0.7% ($4,831)
Median real estate property taxes paid for housing units with mortgages in 2022: $10,330 (0.5%) Median real estate property taxes paid for housing units with no mortgage in 2022: $10,572 (0.5%)
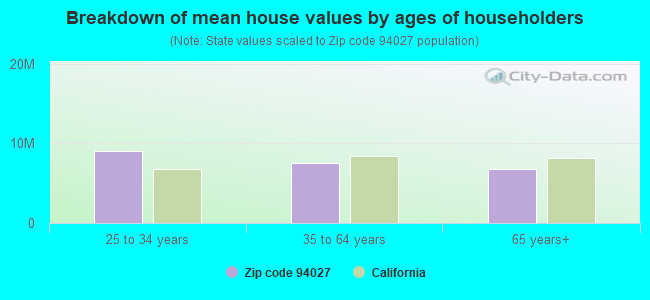
Estimated median house/condo value in 2022: $2,171,698
94027:
$2,171,698
California:
$715,900
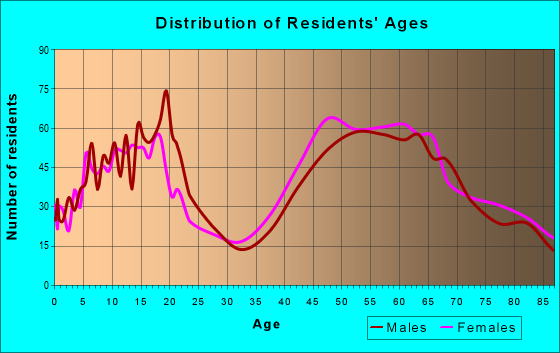
Median resident age:
This zip code:
47.1 years
California median age:
37.9 years
Average household size:
This zip code:
2.9 people
California:
2.8 people
Averages for the 2020 tax year for zip code 94027, filed in 2021:
Average Adjusted Gross Income (AGI) in 2020: $2,216,949 (Individual Income Tax Returns)
Here:
$2,216,949
State:
$95,910
Salary/wage: $1,129,717 (reported on 61.7% of returns)
Here:
$1,129,717
State:
$77,331
(% of AGI for various income ranges: 1538.8% for AGIs below $25k, 4745.5% for AGIs $25k-50k, 7031.1% for AGIs $50k-75k, 10835.7% for AGIs $75k-100k, 19907.9% for AGIs $100k-200k, 926406.1% for AGIs over 200k)
Taxable interest for individuals: $50,362 (reported on 76.4% of returns)
This zip code:
$50,362
California:
$2,294
(% of AGI for various income ranges: 177.1% for AGIs below $25k, 123.6% for AGIs $25k-50k, 274.4% for AGIs $50k-75k, 398.6% for AGIs $75k-100k, 1147.9% for AGIs $100k-200k, 51215.2% for AGIs over 200k)
Ordinary dividends: $185,990 (reported on 77.0% of returns)
Here:
$185,990
State:
$10,949
(% of AGI for various income ranges: 767.1% for AGIs below $25k, 1049.1% for AGIs $25k-50k, 1588.9% for AGIs $50k-75k, 1624.3% for AGIs $75k-100k, 4656.4% for AGIs $100k-200k, 189865.7% for AGIs over 200k)
Net capital gain/loss in AGI: +$1,352,277 (reported on 75.1% of returns)
Here:
+$1,352,277
State:
+$49,306
(% of AGI for various income ranges: 322.9% for AGIs below $25k, 608.2% for AGIs $25k-50k, 998.9% for AGIs $50k-75k, 1621.4% for AGIs $75k-100k, 5688.6% for AGIs $100k-200k, 1376797.8% for AGIs over 200k)
Profit/loss from business: +$190,506 (reported on 22.7% of returns)
Here:
+$190,506
State:
+$15,671
(% of AGI for various income ranges: 318.2% for AGIs below $25k, 708.2% for AGIs $25k-50k, 435.6% for AGIs $50k-75k, 772.9% for AGIs $75k-100k, 1515.0% for AGIs $100k-200k, 56906.5% for AGIs over 200k)
Taxable individual retirement arrangement distribution: $106,239 (reported on 14.1% of returns)
94027:
$106,239
California:
$23,505
(% of AGI for various income ranges: 460.0% for AGIs $25k-50k, 490.0% for AGIs $50k-75k, 720.0% for AGIs $75k-100k, 3251.4% for AGIs $100k-200k, 17713.9% for AGIs over 200k)
Self-employed (Keogh) retirement plans: $56,938 (reported on 7.7% of returns)
94027:
$56,938
California:
$30,163
(% of AGI for various income ranges: 5941.3% for AGIs over 200k)
Total itemized deductions: $364,113 (reported on 47.9% of returns)
Here:
$364,113
State:
$39,517
(% of AGI for various income ranges: 985.9% for AGIs below $25k, 1404.5% for AGIs $25k-50k, 1622.2% for AGIs $50k-75k, 3220.0% for AGIs $75k-100k, 6324.3% for AGIs $100k-200k, 230600.4% for AGIs over 200k)
Charity contributions: $337,847 (reported on 41.9% of returns)
Here:
$337,847
State:
$12,598
(% of AGI for various income ranges: 37.6% for AGIs below $25k, 188.2% for AGIs $25k-50k, 208.6% for AGIs $75k-100k, 1232.9% for AGIs $100k-200k, 191494.3% for AGIs over 200k)
Taxes paid: $9,379 (reported on 47.6% of returns)
94027:
$9,379
State:
$8,807
(% of AGI for various income ranges: 192.9% for AGIs below $25k, 283.6% for AGIs $25k-50k, 221.1% for AGIs $50k-75k, 467.1% for AGIs $75k-100k, 1025.7% for AGIs $100k-200k, 4944.8% for AGIs over 200k)
Earned income credit: $1,080 (reported on 1.6% of returns)
Here:
$1,080
State:
$2,074
(% of AGI for various income ranges: 31.8% for AGIs below $25k)
Percentage of individuals using paid preparers for their 2020 taxes: 91.7%
Here:
92%
State:
92%
(% for various income ranges: 90.7% for AGIs below $25k, 91.7% for AGIs $25k-50k, 94.7% for AGIs $50k-75k, 86.7% for AGIs $75k-100k, 90.5% for AGIs $100k-200k, 92.5% for AGIs over 200k)
Averages for the 2012 tax year for zip code 94027, filed in 2013:
Average Adjusted Gross Income (AGI) in 2012: $1,464,534 (Individual Income Tax Returns)
Here:
$1,464,534
State:
$72,726
Salary/wage: $676,629 (reported on 63.4% of returns)
Here:
$676,629
State:
$59,079
(% of AGI for various income ranges: 61.8% for AGIs below $25k, 58.1% for AGIs $25k-50k, 55.7% for AGIs $50k-75k, 42.3% for AGIs $75k-100k, 39.4% for AGIs $100k-200k, 28.9% for AGIs over 200k)
Taxable interest for individuals: $43,693 (reported on 74.8% of returns)
This zip code:
$43,693
California:
$2,146
(% of AGI for various income ranges: 5.0% for AGIs below $25k, 3.5% for AGIs $25k-50k, 2.6% for AGIs $50k-75k, 5.5% for AGIs $75k-100k, 4.2% for AGIs $100k-200k, 2.2% for AGIs over 200k)
Ordinary dividends: $111,929 (reported on 75.8% of returns)
Here:
$111,929
State:
$9,308
(% of AGI for various income ranges: 25.6% for AGIs below $25k, 11.1% for AGIs $25k-50k, 13.6% for AGIs $50k-75k, 14.2% for AGIs $75k-100k, 13.5% for AGIs $100k-200k, 5.6% for AGIs over 200k)
Net capital gain/loss in AGI: +$993,911 (reported on 72.0% of returns)
Here:
+$993,911
State:
+$30,460
(% of AGI for various income ranges: 3.4% for AGIs below $25k, 3.8% for AGIs $25k-50k, 4.3% for AGIs $50k-75k, 4.4% for AGIs $75k-100k, 8.3% for AGIs $100k-200k, 49.9% for AGIs over 200k)
Profit/loss from business: +$138,807 (reported on 21.7% of returns)
Here:
+$138,807
State:
+$17,064
(% of AGI for various income ranges: 8.7% for AGIs below $25k, 8.7% for AGIs $25k-50k, 3.6% for AGIs $50k-75k, 7.8% for AGIs $75k-100k, 8.7% for AGIs $100k-200k, 1.9% for AGIs over 200k)
Taxable individual retirement arrangement distribution: $80,290 (reported on 19.6% of returns)
94027:
$80,290
California:
$19,557
(% of AGI for various income ranges: 1.7% for AGIs below $25k, 4.1% for AGIs $25k-50k, 4.2% for AGIs $50k-75k, 5.4% for AGIs $75k-100k, 9.8% for AGIs $100k-200k, 0.9% for AGIs over 200k)
Self-employment retirement plans: $43,836 (reported on 8.7% of returns)
94027:
$43,836
California:
$24,530
Total itemized deductions: $358,166 (17% of AGI, reported on 69.9% of returns)
Here:
$358,166
State:
$34,004
Here:
17.2% of AGI
State:
22.7% of AGI
(% of AGI for various income ranges: 43.1% for AGIs below $25k, 26.3% for AGIs $25k-50k, 24.0% for AGIs $50k-75k, 37.6% for AGIs $75k-100k, 35.4% for AGIs $100k-200k, 16.7% for AGIs over 200k)
Charity contributions: $95,531 (reported on 60.2% of returns)
Here:
$95,531
State:
$4,659
(% of AGI for various income ranges: 1.4% for AGIs below $25k, 1.5% for AGIs $25k-50k, 2.0% for AGIs $50k-75k, 4.1% for AGIs $75k-100k, 4.0% for AGIs $100k-200k, 3.9% for AGIs over 200k)
Taxes paid: $211,728 (reported on 69.3% of returns)
94027:
$211,728
State:
$14,448
(% of AGI for various income ranges: 16.1% for AGIs below $25k, 8.4% for AGIs $25k-50k, 8.0% for AGIs $50k-75k, 12.8% for AGIs $75k-100k, 14.2% for AGIs $100k-200k, 10.0% for AGIs over 200k)
Earned income credit: $771 (reported on 2.2% of returns)
Here:
$771
State:
$2,286
(% of AGI for various income ranges: 0.9% for AGIs below $25k)
Percentage of individuals using paid preparers for their 2012 taxes: 76.1%
Here:
76%
State:
64%
(% for various income ranges: 61.4% for AGIs below $25k, 59.3% for AGIs $25k-50k, 69.6% for AGIs $50k-75k, 76.5% for AGIs $75k-100k, 73.8% for AGIs $100k-200k, 88.1% for AGIs over 200k)
Averages for the 2004 tax year for zip code 94027, filed in 2005:
Average Adjusted Gross Income (AGI) in 2004: $709,687 (Individual Income Tax Returns)
Here:
$709,687
State:
$58,600
Salary/wage: $387,555 (reported on 59.2% of returns)
Here:
$387,555
State:
$49,455
(% of AGI for various income ranges: 42.5% for AGIs $10k-25k, 57.1% for AGIs $25k-50k, 49.1% for AGIs $50k-75k, 38.1% for AGIs $75k-100k, 31.4% for AGIs over 100k)
Taxable interest for individuals: $42,281 (reported on 80.3% of returns)
This zip code:
$42,281
California:
$2,365
(% of AGI for various income ranges: 11.7% for AGIs $10k-25k, 4.9% for AGIs $25k-50k, 7.0% for AGIs $50k-75k, 7.3% for AGIs $75k-100k, 4.6% for AGIs over 100k)
Taxable dividends: $52,276 (reported on 79.0% of returns)
Here:
$52,276
State:
$4,746
(% of AGI for various income ranges: 15.4% for AGIs $10k-25k, 9.9% for AGIs $25k-50k, 12.3% for AGIs $50k-75k, 11.8% for AGIs $75k-100k, 5.5% for AGIs over 100k)
Net capital gain/loss: +$376,780 (reported on 74.2% of returns)
Here:
+$376,780
State:
+$23,418
(% of AGI for various income ranges: 11.6% for AGIs $10k-25k, 9.2% for AGIs $25k-50k, 8.7% for AGIs $50k-75k, 14.8% for AGIs $75k-100k, 39.3% for AGIs over 100k)
Profit/loss from business: +$90,271 (reported on 21.3% of returns)
Here:
+$90,271
State:
+$16,826
(% of AGI for various income ranges: 8.0% for AGIs $10k-25k, 4.9% for AGIs $25k-50k, 3.5% for AGIs $50k-75k, 7.4% for AGIs $75k-100k, 2.6% for AGIs over 100k)
IRA payment deduction: $4,490 (reported on 2.9% of returns)
94027:
$4,490
California:
$3,192
(% of AGI for various income ranges: 0.5% for AGIs $25k-50k, 0.6% for AGIs $50k-75k, 0.0% for AGIs over 100k)
Self-employed pension: $30,850 (reported on 8.4% of returns)
Here:
$30,850
California:
$17,688
Total itemized deductions: $205,896 (19% of AGI, reported on 65.5% of returns)
Here:
$205,896
State:
$28,113
Here:
19.1% of AGI
State:
25.3% of AGI
(% of AGI for various income ranges: 44.3% for AGIs $10k-25k, 34.7% for AGIs $25k-50k, 48.4% for AGIs $50k-75k, 30.5% for AGIs $75k-100k, 18.3% for AGIs over 100k)
Charity contributions deductions: $60,322 (5% of AGI, reported on 60.2% of returns)
Here:
$60,322
State:
$3,923
Here:
5.3% of AGI
State:
3.3% of AGI
(% of AGI for various income ranges: 2.7% for AGIs $10k-25k, 2.7% for AGIs $25k-50k, 4.0% for AGIs $50k-75k, 3.8% for AGIs $75k-100k, 5.1% for AGIs over 100k)
Total tax: $185,561 (reported on 82.4% of returns)
94027:
$185,561
State:
$10,761
(% of AGI for various income ranges: 5.5% for AGIs $10k-25k, 8.0% for AGIs $25k-50k, 11.0% for AGIs $50k-75k, 11.3% for AGIs $75k-100k, 21.4% for AGIs over 100k)
Earned income credit: $784 (reported on 1.5% of returns)
Here:
$784
State:
$1,763
Percentage of individuals using paid preparers for their 2004 taxes: 76.1%
Here:
76%
State:
66%
(% for various income ranges: 69.1% for AGIs below $10k, 60.9% for AGIs $10k-25k, 62.7% for AGIs $25k-50k, 73.0% for AGIs $50k-75k, 73.8% for AGIs $75k-100k, 84.2% for AGIs over 100k)
Likely homosexual households (counted as self-reported same-sex unmarried-partner households)
Lesbian couples: 0.0% of all households
Gay men: 0.3% of all households
Household received Food Stamps/SNAP in the past 12 months: 0 Household did not receive Food Stamps/SNAP in the past 12 months: 2,170
Women who had a birth in the past 12 months: 17 (17 now married, 0 unmarried) Women who did not have a birth in the past 12 months: 1,376 (448 now married, 931 unmarried)
Housing units in zip code 94027 with a mortgage: 1,002 (126 second mortgage, 5 home equity loan, 115 both second mortgage and home equity loan) Houses without a mortgage: 32
Median monthly owner costs for units with a mortgage: $3,876 Median monthly owner costs for units without a mortgage: $1,556
Residents with income below the poverty level in 2022:
This zip code:
4.0%
Whole state:
12.2%
Residents with income below 50% of the poverty level in 2022:
This zip code:
1.5%
Whole state:
6.2%
Median number of rooms in houses and condos:
Here:
10.0
State:
6.0
Median number of rooms in apartments:
Here:
10.0
State:
3.9
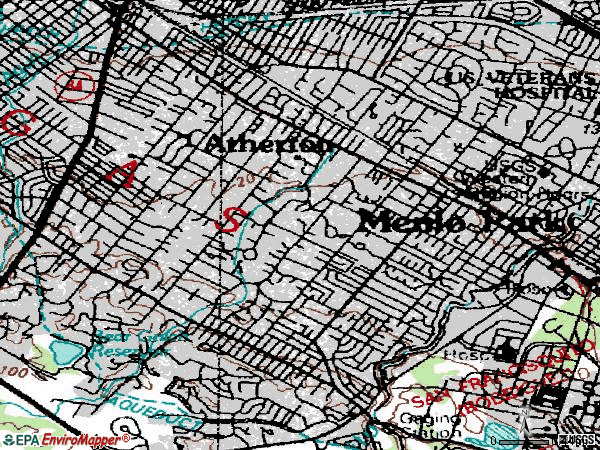
Notable locations in this zip code not listed on our city pages
Notable locations in zip code 94027: Menlo Circus Club (A), Atherton City Hall (B), Atherton Branch San Mateo County Library (C), Bowman Library (D), O'Brien Hall (E), Michaels Hall (F), Kratt Hall (G), Howard Hall (H), Haynes-Prim Pavilion Sports Center (I), Florence Moore Science Building (J), El Camino Hall (K), Brawner Hall (L), Menlo Park Fire Protection District Station 3 (M). Display/hide their locations on the map
1,237 married couples with children.
95 single-parent households (42 men, 53 women).
73.9% of residents of 94027 zip code speak English at home.
4.9% of residents speak Spanish at home (93% very well, 7% well).
10.1% of residents speak other Indo-European language at home (92% very well, 8% well).
11.4% of residents speak Asian or Pacific Island language at home (75% very well, 19% well, 5% not well, 1% not at all).
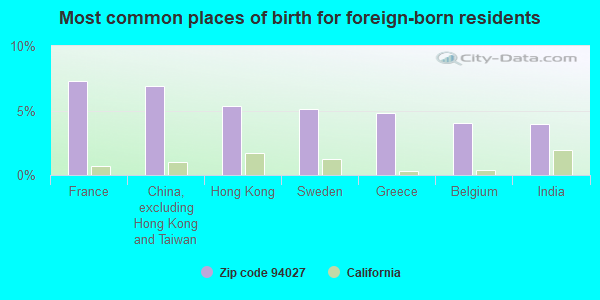
Foreign born population: 1,477 (20.9%) (56.5% of them are naturalized citizens)
This zip code:
20.9%
Whole state:
26.7%
7%France
7%China, excluding Hong Kong and Taiwan
5%Hong Kong
5%Sweden
5%Greece
4%Belgium
4%India
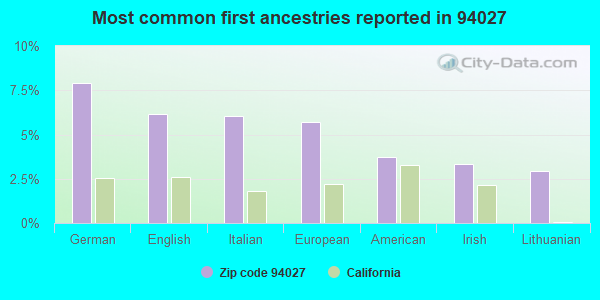
8%German
6%English
6%Italian
6%European
4%American
3%Irish
3%Lithuanian
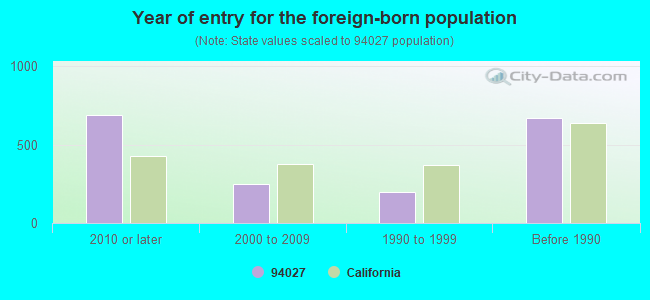
Year of entry for the foreign-born population
6882010 or later
2512000 to 2009
1961990 to 1999
672Before 1990
Facilities with environmental interests located in this zip code:
ENCINAL ELEMENTARY (195 ENCINAL AVE. in ATHERTON, CA)
(National Center for Education Statistics) - STATE ID-6044135 Organizations: MENLO PARK CITY ELEMENTARY (SCHOOL DISTRICT)
LAS LOMITAS ELEMENTARY (299 ALAMEDA DE LAS PULGAS in ATHERTON, CA)
(National Center for Education Statistics) - STATE ID-6044127
LAUREL ELEMENTARY (95 EDGE ROAD in ATHERTON, CA)
(National Center for Education Statistics) - STATE ID-6044168 Organizations: MENLO PARK CITY ELEMENTARY (SCHOOL DISTRICT)
MENLO-ATHERTON HIGH (555 MIDDLEFIELD ROAD in ATHERTON, CA)
(National Center for Education Statistics) - STATE ID-4133716 Organizations: SEQUOIA UNION HIGH (SCHOOL DISTRICT)
CALIFORNIA WATER SERVICE COMPA (MOORE RD, STATION 5 F in ATHERTON, CA)
CRITERIA AND HAZARDOUS AIR POLLUTANT INVENTORY (Inventory of air pollution sources) Business SIC classification: WATER SUPPLY
CALIFORNIA WATER SERVICE COMPA (120 RESERVOIR ROAD in ATHERTON, CA)
CRITERIA AND HAZARDOUS AIR POLLUTANT INVENTORY (Inventory of air pollution sources) Business SIC classification: WATER SUPPLY
Housing units lacking complete plumbing facilities: 0.3% Housing units lacking complete kitchen facilities: 1.3%
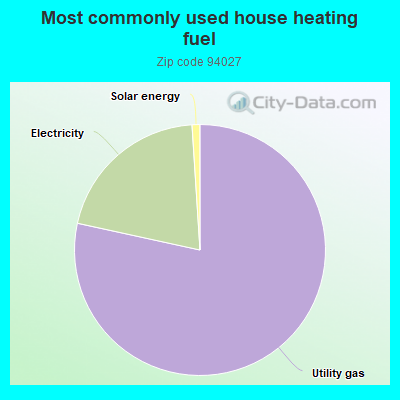
78.2%Utility gas
20.5%Electricity
1.0%Solar energy
Population in 1990: 7,312.
Place of birth for U.S.-born residents:
This state: 3,053
Northeast: 1,074
Midwest: 617
South: 267
West: 274
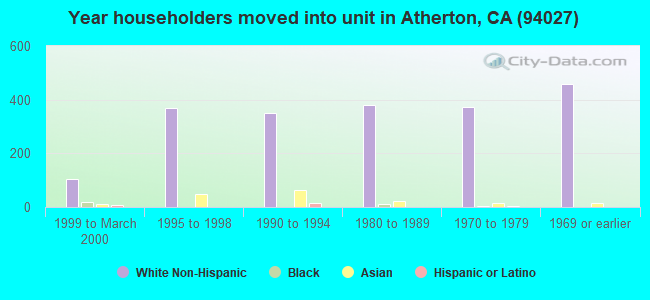
69% of the 94027 zip code residents lived in the same house 5 years ago. Out of people who lived in different houses, 43% lived in this county. Out of people who lived in different counties, 50% lived in California.
86% of the 94027 zip code residents lived in the same house 1 year ago. Out of people who lived in different houses, 54% moved from this county. Out of people who lived in different houses, 17% moved from different county within same state. Out of people who lived in different houses, 18% moved from different state. Out of people who lived in different houses, 10% moved from abroad.
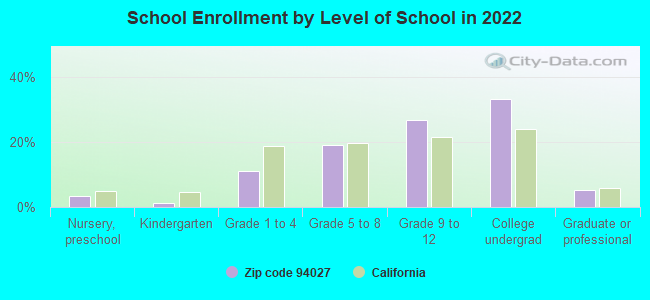
Private vs. public school enrollment:
Students in private schools in grades 1 to 8 (elementary and middle school): 447
Here:
60.8%
California:
10.5%
Students in private schools in grades 9 to 12 (high school): 489
Here:
78.1%
California:
8.5%
Students in private undergraduate colleges: 627
Here:
78.1%
California:
15.9%
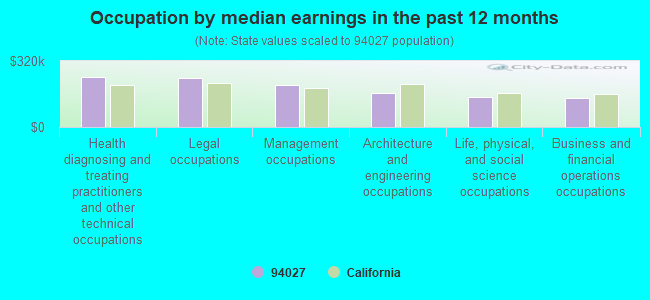
Occupation by median earnings in the past 12 months ($)
241,865Health diagnosing and treating practitioners and other technical occupations
237,352Legal occupations
204,152Management occupations
166,058Architecture and engineering occupations
144,333Life, physical, and social science occupations
141,419Business and financial operations occupations
Companies with federal contracts located in this zip code:
REACT NETWORK SERVICES INC (174 FAIR OAKS LN in ATHERTON, CA; small business)
$16,000 with Army for ADP Software. Signed on 2005-05-31. Completion date: 2005-06-10.
LIM, KOI LING (1975 IVY LN in MENLO PARK, CA; small business)
$3,500 with Geological Survey for Natural Resource Studies. Signed on 2003-06-15. Completion date: 2003-08-15.
Top industries in this zip code by the number of employees in 2005:
Educational Services: Colleges, Universities, and Professional Schools (250-499 employees: 1 establishment)
Educational Services: Elementary and Secondary Schools (100-249: 2, 1-4: 1)
Administrative and Support and Waste Management and Remediation Services: Temporary Help Services (50-99: 1)
Arts, Entertainment, and Recreation: Golf Courses and Country Clubs (50-99: 1)
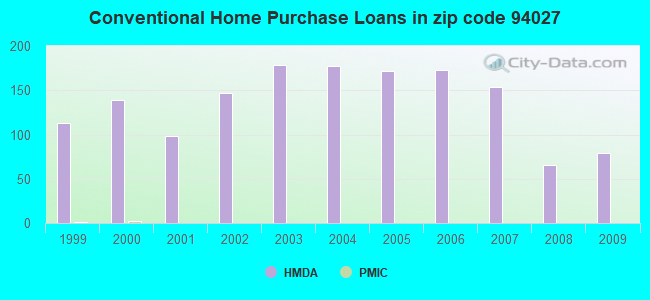
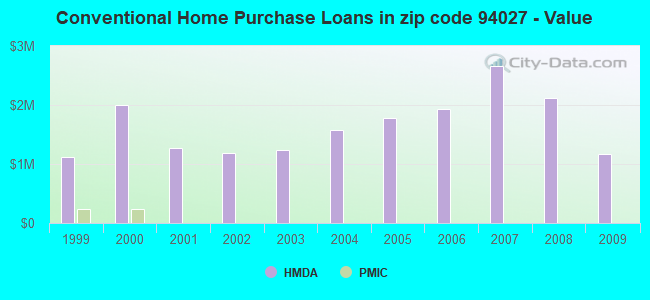
Detailed PMIC statistics for the following Tracts:6114.00
2006 - 2018 National Fire Incident Reporting System (NFIRS) incidents
According to the data from the years 2006 - 2018 the average number of fire incidents per year is 8. The highest number of fire incidents - 15 took place in 2007, and the least - 1 in 2006. The data has an increasing trend.
When looking into fire subcategories, the most incidents belonged to: Outside Fires (42.3%), and Structure Fires (35.6%).
Fire incident types reported to NFIRS in Zip Code 94027


 Nearest zip codes: 94025, 94061, 94063, 94305, 94301, 94028.


 According to the data from the years 2006 - 2018 the average number of fire incidents per year is 8. The highest number of fire incidents - 15 took place in 2007, and the least - 1 in 2006. The data has an increasing trend.
 When looking into fire subcategories, the most incidents belonged to: Outside Fires (42.3%), and Structure Fires (35.6%).