Estimated zip code population in 2022: 19,817 Zip code population in 2010: 17,547 Zip code population in 2000: 14,189
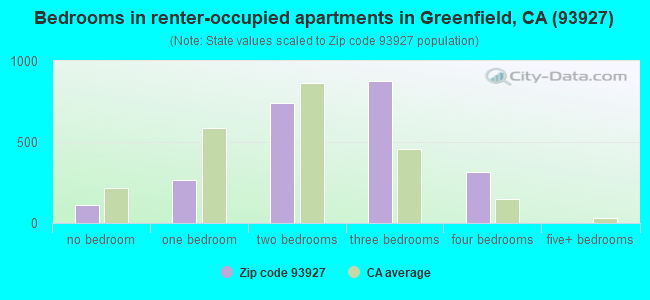
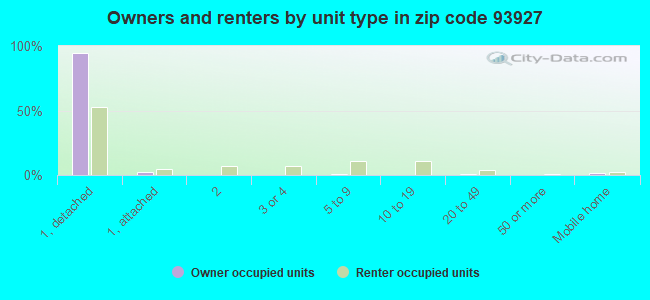
Houses and condos: 4,893 Renter-occupied apartments: 2,306
% of renters here:
50%
State:
44%
March 2022 cost of living index in zip code 93927: 104.5 (near average, U.S. average is 100)
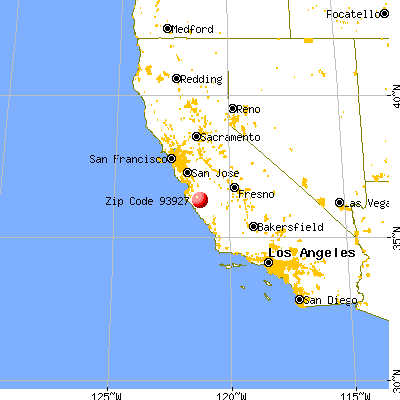
Land area: 263.9 sq. mi. Water area: 1.1 sq. mi.
Population density: 75 people per square mile
(very low).
OSM Map
General Map
Google Map
MSN Map
OSM Map
General Map
Google Map
MSN Map
OSM Map
General Map
Google Map
MSN Map
OSM Map
General Map
Google Map
MSN Map
Please wait while loading the map...
Real estate property taxes paid for housing units in 2022:
This zip code:
0.7% ($3,292)
California:
0.7% ($4,831)
Median real estate property taxes paid for housing units with mortgages in 2022: $3,313 (0.7%) Median real estate property taxes paid for housing units with no mortgage in 2022: $3,337 (0.8%)
Business Search- 14 Million verified businesses
Males: 9,658
(48.7%)
Females: 10,158
(51.3%)
For population 25 years and over in 93927:
High school or higher: 47.4%
Bachelor's degree or higher: 8.4%
Graduate or professional degree: 1.2%
Unemployed: 1.1%
Mean travel time to work (commute): 24.7 minutes
For population 15 years and over in 93927:
Never married: 42.9%
Now married: 47.8%
Separated: 1.5%
Widowed: 3.7%
Divorced: 4.0%
Zip code 93927 compared to state average:
Median house value below state average.
Unemployed percentage significantly below state average.
Black race population percentage significantly below state average.
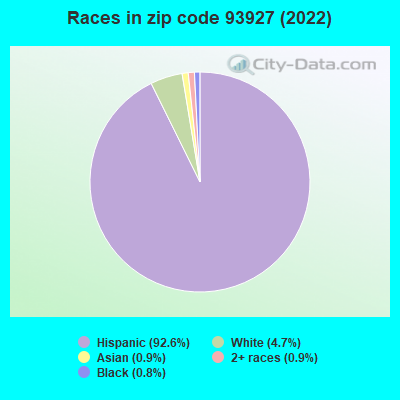
Hispanic race population percentage above state average.
Median age significantly below state average.
Foreign-born population percentage above state average.
Length of stay since moving in significantly above state average.
House age below state average.
Percentage of population with a bachelor's degree or higher significantly below state average.
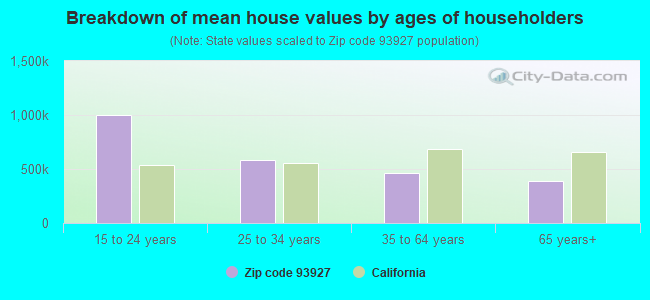
Estimated median house/condo value in 2022: $458,337
93927:
$458,337
California:
$715,900
According to our research of California and other state lists, there were 22 registered sex offenders living in 93927 zip code as of May 24, 2024. The ratio of all residents to sex offenders in zip code 93927 is 858 to 1. The ratio of registered sex offenders to all residents in this zip code is near the state average.
Median resident age:
This zip code:
28.1 years
California median age:
37.9 years
Average household size:
This zip code:
4.3 people
California:
2.8 people
Averages for the 2020 tax year for zip code 93927, filed in 2021:
Average Adjusted Gross Income (AGI) in 2020: $44,371 (Individual Income Tax Returns)
Here:
$44,371
State:
$95,910
Salary/wage: $39,116 (reported on 93.8% of returns)
Here:
$39,116
State:
$77,331
(% of AGI for various income ranges: 2551.0% for AGIs below $25k, 6117.4% for AGIs $25k-50k, 10086.5% for AGIs $50k-75k, 13827.7% for AGIs $75k-100k, 21415.6% for AGIs $100k-200k)
Taxable interest for individuals: $446 (reported on 16.1% of returns)
This zip code:
$446
California:
$2,294
(% of AGI for various income ranges: 3.3% for AGIs below $25k, 2.3% for AGIs $25k-50k, 8.0% for AGIs $50k-75k, 10.3% for AGIs $75k-100k, 34.4% for AGIs $100k-200k)
Ordinary dividends: $2,557 (reported on 2.6% of returns)
Here:
$2,557
State:
$10,949
(% of AGI for various income ranges: 1.4% for AGIs below $25k, 1.3% for AGIs $25k-50k, 6.2% for AGIs $50k-75k, 7.1% for AGIs $75k-100k, 39.6% for AGIs $100k-200k)
Net capital gain/loss in AGI: +$10,865 (reported on 3.0% of returns)
Here:
+$10,865
State:
+$49,306
(% of AGI for various income ranges: 0.5% for AGIs $25k-50k, 14.7% for AGIs $50k-75k, 44.8% for AGIs $75k-100k, 149.6% for AGIs $100k-200k)
Profit/loss from business: +$8,474 (reported on 6.6% of returns)
Here:
+$8,474
State:
+$15,671
(% of AGI for various income ranges: 39.0% for AGIs below $25k, 83.1% for AGIs $25k-50k, 107.7% for AGIs $50k-75k, 276.8% for AGIs $75k-100k, 464.1% for AGIs $100k-200k)
Taxable individual retirement arrangement distribution: $12,508 (reported on 1.4% of returns)
93927:
$12,508
California:
$23,505
(% of AGI for various income ranges: 20.3% for AGIs below $25k, 56.6% for AGIs $50k-75k, 285.2% for AGIs $100k-200k)
Total itemized deductions: $31,010 (reported on 4.7% of returns)
Here:
$31,010
State:
$39,517
(% of AGI for various income ranges: 92.1% for AGIs $25k-50k, 355.4% for AGIs $50k-75k, 757.4% for AGIs $75k-100k, 1251.5% for AGIs $100k-200k)
Charity contributions: $3,488 (reported on 3.8% of returns)
Here:
$3,488
State:
$12,598
(% of AGI for various income ranges: 6.5% for AGIs $25k-50k, 25.8% for AGIs $50k-75k, 61.0% for AGIs $75k-100k, 187.0% for AGIs $100k-200k)
Taxes paid: $8,210 (reported on 4.7% of returns)
93927:
$8,210
State:
$8,807
(% of AGI for various income ranges: 24.7% for AGIs $25k-50k, 107.0% for AGIs $50k-75k, 247.7% for AGIs $75k-100k, 401.1% for AGIs $100k-200k)
Earned income credit: $2,546 (reported on 20.3% of returns)
Here:
$2,546
State:
$2,074
(% of AGI for various income ranges: 172.9% for AGIs below $25k, 114.9% for AGIs $25k-50k, 2.4% for AGIs $50k-75k)
Percentage of individuals using paid preparers for their 2020 taxes: 89.5%
Here:
90%
State:
92%
(% for various income ranges: 87.3% for AGIs below $25k, 89.9% for AGIs $25k-50k, 90.4% for AGIs $50k-75k, 92.9% for AGIs $75k-100k, 94.2% for AGIs $100k-200k, 100.0% for AGIs over 200k)
Averages for the 2012 tax year for zip code 93927, filed in 2013:
Average Adjusted Gross Income (AGI) in 2012: $33,107 (Individual Income Tax Returns)
Here:
$33,107
State:
$72,726
Salary/wage: $30,291 (reported on 95.2% of returns)
Here:
$30,291
State:
$59,079
(% of AGI for various income ranges: 89.4% for AGIs below $25k, 91.2% for AGIs $25k-50k, 89.3% for AGIs $50k-75k, 89.3% for AGIs $75k-100k, 99.4% for AGIs $100k-200k)
Taxable interest for individuals: $571 (reported on 13.6% of returns)
This zip code:
$571
California:
$2,146
(% of AGI for various income ranges: 0.2% for AGIs $100k-200k, 3.5% for AGIs over 200k)
Ordinary dividends: $2,041 (reported on 2.3% of returns)
Here:
$2,041
State:
$9,308
(% of AGI for various income ranges: 0.3% for AGIs $50k-75k, 0.6% for AGIs $100k-200k)
Net capital gain/loss in AGI: +$3,290 (reported on 1.3% of returns)
Here:
+$3,290
State:
+$30,460
(% of AGI for various income ranges: 1.3% for AGIs below $25k, 1.3% for AGIs $100k-200k)
Profit/loss from business: +$9,945 (reported on 6.3% of returns)
Here:
+$9,945
State:
+$17,064
(% of AGI for various income ranges: 2.5% for AGIs below $25k, 1.4% for AGIs $25k-50k, 1.9% for AGIs $50k-75k, 1.5% for AGIs $75k-100k, 3.0% for AGIs $100k-200k)
Taxable individual retirement arrangement distribution: $9,900 (reported on 1.2% of returns)
93927:
$9,900
California:
$19,557
(% of AGI for various income ranges: 0.4% for AGIs $25k-50k, 0.5% for AGIs $50k-75k, 1.3% for AGIs $75k-100k)
Total itemized deductions: $21,998 (31% of AGI, reported on 16.8% of returns)
Here:
$21,998
State:
$34,004
Here:
30.8% of AGI
State:
22.7% of AGI
(% of AGI for various income ranges: 2.5% for AGIs below $25k, 7.6% for AGIs $25k-50k, 16.2% for AGIs $50k-75k, 18.7% for AGIs $75k-100k, 20.9% for AGIs $100k-200k, 23.3% for AGIs over 200k)
Charity contributions: $1,808 (reported on 13.8% of returns)
Here:
$1,808
State:
$4,659
(% of AGI for various income ranges: 0.1% for AGIs below $25k, 0.4% for AGIs $25k-50k, 0.8% for AGIs $50k-75k, 1.8% for AGIs $75k-100k, 1.7% for AGIs $100k-200k, 2.3% for AGIs over 200k)
Taxes paid: $5,521 (reported on 16.8% of returns)
93927:
$5,521
State:
$14,448
(% of AGI for various income ranges: 0.4% for AGIs below $25k, 1.5% for AGIs $25k-50k, 3.6% for AGIs $50k-75k, 4.6% for AGIs $75k-100k, 6.7% for AGIs $100k-200k, 9.2% for AGIs over 200k)
Earned income credit: $2,609 (reported on 23.9% of returns)
Here:
$2,609
State:
$2,286
(% of AGI for various income ranges: 5.6% for AGIs below $25k, 1.6% for AGIs $25k-50k)
Percentage of individuals using paid preparers for their 2012 taxes: 81.7%
Here:
82%
State:
64%
(% for various income ranges: 82.9% for AGIs below $25k, 83.2% for AGIs $25k-50k, 75.9% for AGIs $50k-75k, 75.9% for AGIs $75k-100k, 70.0% for AGIs $100k-200k, 100.0% for AGIs over 200k)
Averages for the 2004 tax year for zip code 93927, filed in 2005:
Average Adjusted Gross Income (AGI) in 2004: $33,721 (Individual Income Tax Returns)
Here:
$33,721
State:
$58,600
Salary/wage: $28,905 (reported on 93.4% of returns)
Here:
$28,905
State:
$49,455
(% of AGI for various income ranges: 109.0% for AGIs below $10k, 86.6% for AGIs $10k-25k, 89.9% for AGIs $25k-50k, 87.6% for AGIs $50k-75k, 87.3% for AGIs $75k-100k, 40.4% for AGIs over 100k)
Taxable interest for individuals: $1,558 (reported on 23.8% of returns)
This zip code:
$1,558
California:
$2,365
(% of AGI for various income ranges: 2.2% for AGIs below $10k, 0.4% for AGIs $10k-25k, 0.5% for AGIs $25k-50k, 0.9% for AGIs $50k-75k, 0.6% for AGIs $75k-100k, 3.2% for AGIs over 100k)
Taxable dividends: $2,081 (reported on 5.2% of returns)
Here:
$2,081
State:
$4,746
(% of AGI for various income ranges: 1.1% for AGIs below $10k, 0.3% for AGIs $10k-25k, 0.1% for AGIs $25k-50k, 0.2% for AGIs $50k-75k, 0.1% for AGIs $75k-100k, 0.9% for AGIs over 100k)
Net capital gain/loss: +$11,173 (reported on 4.1% of returns)
Here:
+$11,173
State:
+$23,418
(% of AGI for various income ranges: -0.1% for AGIs below $10k, -0.0% for AGIs $10k-25k, 0.0% for AGIs $25k-50k, 0.9% for AGIs $50k-75k, 0.0% for AGIs $75k-100k, 6.5% for AGIs over 100k)
Profit/loss from business: +$10,487 (reported on 7.8% of returns)
Here:
+$10,487
State:
+$16,826
(% of AGI for various income ranges: 0.1% for AGIs below $10k, 2.6% for AGIs $10k-25k, 1.9% for AGIs $25k-50k, 2.8% for AGIs $50k-75k, 2.6% for AGIs $75k-100k, 2.9% for AGIs over 100k)
IRA payment deduction: $2,385 (reported on 0.9% of returns)
93927:
$2,385
California:
$3,192
Total itemized deductions: $20,022 (31% of AGI, reported on 25.4% of returns)
Here:
$20,022
State:
$28,113
Here:
31.1% of AGI
State:
25.3% of AGI
(% of AGI for various income ranges: 7.1% for AGIs below $10k, 7.3% for AGIs $10k-25k, 15.0% for AGIs $25k-50k, 18.8% for AGIs $50k-75k, 21.6% for AGIs $75k-100k, 16.9% for AGIs over 100k)
Charity contributions deductions: $1,422 (2% of AGI, reported on 21.2% of returns)
Here:
$1,422
State:
$3,923
Here:
2.1% of AGI
State:
3.3% of AGI
(% of AGI for various income ranges: 0.3% for AGIs $10k-25k, 0.6% for AGIs $25k-50k, 1.2% for AGIs $50k-75k, 1.4% for AGIs $75k-100k, 1.5% for AGIs over 100k)
Total tax: $4,811 (reported on 50.2% of returns)
93927:
$4,811
State:
$10,761
(% of AGI for various income ranges: 1.8% for AGIs below $10k, 1.9% for AGIs $10k-25k, 3.4% for AGIs $25k-50k, 6.3% for AGIs $50k-75k, 8.4% for AGIs $75k-100k, 20.4% for AGIs over 100k)
Earned income credit: $2,049 (reported on 28.4% of returns)
Here:
$2,049
State:
$1,763
Percentage of individuals using paid preparers for their 2004 taxes: 78.4%
Here:
78%
State:
66%
(% for various income ranges: 68.9% for AGIs below $10k, 81.7% for AGIs $10k-25k, 79.8% for AGIs $25k-50k, 76.5% for AGIs $50k-75k, 73.9% for AGIs $75k-100k, 82.8% for AGIs over 100k)
Likely homosexual households (counted as self-reported same-sex unmarried-partner households)
Lesbian couples: 0.2% of all households
Gay men: 0.0% of all households
Household received Food Stamps/SNAP in the past 12 months: 552 Household did not receive Food Stamps/SNAP in the past 12 months: 4,014
Women who had a birth in the past 12 months: 322 (265 now married, 56 unmarried) Women who did not have a birth in the past 12 months: 4,740 (1,884 now married, 2,856 unmarried)
Housing units in zip code 93927 with a mortgage: 1,615 (149 second mortgage, 119 both second mortgage and home equity loan) Houses without a mortgage: 21
Median monthly owner costs for units with a mortgage: $1,888 Median monthly owner costs for units without a mortgage: $631
Residents with income below the poverty level in 2022:
This zip code:
11.8%
Whole state:
12.2%
Residents with income below 50% of the poverty level in 2022:
This zip code:
7.6%
Whole state:
6.2%
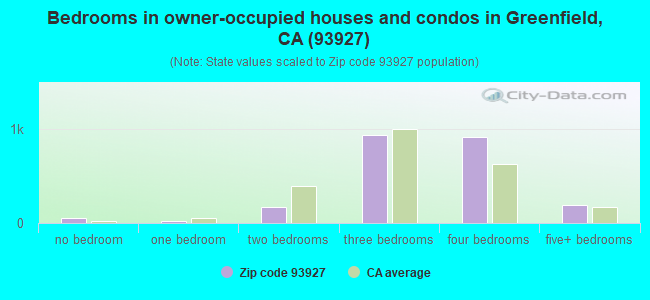
Median number of rooms in houses and condos:
Here:
5.7
State:
6.0
Median number of rooms in apartments:
Here:
4.6
State:
3.9
Notable locations in this zip code not listed on our city pages
Notable locations in zip code 93927: Horse Pasture Camp (A), Herbert Ranch (B), Bell Ranch (C), Rancho Palo Escrito (D), Reliz Canyon Camp Ground (E), Piney Creek Campground (F), Rio Alto Gun Club (G), Rocky Creek Camp (H), The Indian (I), Fritch Ranch (J), Leigh Ranch (K), Last Chance Rustic Campsite (L), Arroyo Seco Recreation Site (M), Rocky Creek Campground (N), Girl Scout Camp (O), Piney Creek Campground (P), Lower Piney Creek Campground (Q), Koester Ranch (R), Abbott Ranch (S), Greenfield Memorial Building (T). Display/hide their locations on the map
Streams, rivers, and creeks: Calaboose Creek (A), Basin Creek (B), Horse Run (C), Vaqueros Creek (D), Willow Creek (E), Tassajara Creek (F), Tash Creek (G), Sweetwater Creek (H), Sand Creek (I). Display/hide their locations on the map
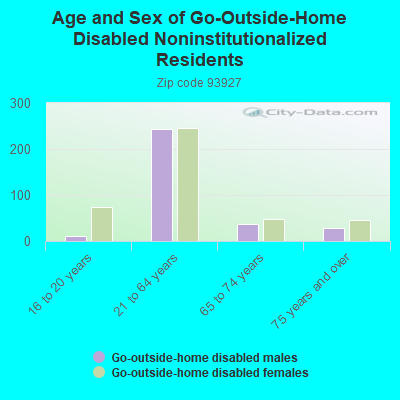
In group quarters: 72 (-1 institutionalized population)
Size of family households: 738 2-persons, 538 3-persons, 703 4-persons, 674 5-persons, 579 6-persons, 697 7-or-more-persons
Size of nonfamily households: 463 1-person, 130 2-persons
3,553 married couples with children.
2,098 single-parent households (801 men, 1,297 women).
17.3% of residents of 93927 zip code speak English at home.
81.6% of residents speak Spanish at home (48% very well, 13% well, 16% not well, 23% not at all).
0.1% of residents speak other Indo-European language at home (100% very well).
0.6% of residents speak Asian or Pacific Island language at home (89% very well, 11% well).
1.5% of residents speak other language at home (19% well, 12% not well, 69% not at all).
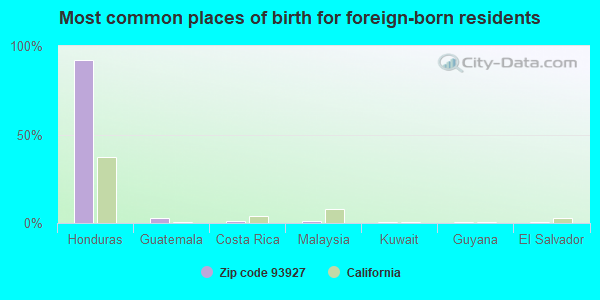
Foreign born population: 8,069 (40.7%) (16.3% of them are naturalized citizens)
This zip code:
40.7%
Whole state:
26.7%
92%Honduras
3%Guatemala
1%Costa Rica
1%Malaysia
0%Kuwait
0%Guyana
0%El Salvador
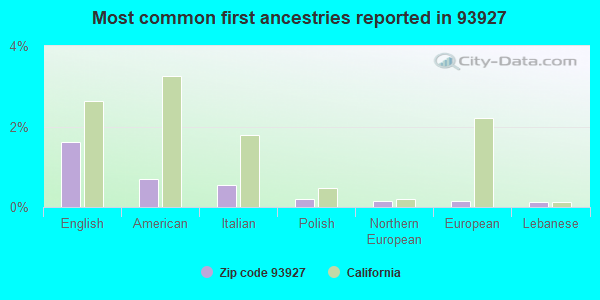
2%English
1%American
1%Italian
0%Polish
0%Northern European
0%European
0%Lebanese
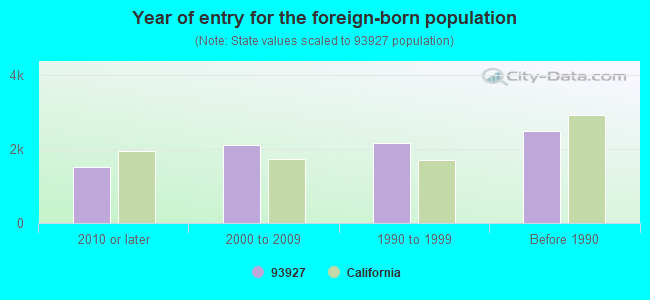
Year of entry for the foreign-born population
1,5242010 or later
2,1092000 to 2009
2,1661990 to 1999
2,481Before 1990
Facilities with environmental interests located in this zip code:
GREENFIELD ELEMENTARY (490 EL CAMINO REAL in GREENFIELD, CA)
(National Center for Education Statistics) - STATE ID-6026116 Organizations: GREENFIELD UNION ELEMENTARY (SCHOOL DISTRICT)
GREENFIELD HIGH (2025 EL CAMINO in GREENFIELD, CA)
(National Center for Education Statistics) - STATE ID-2730174 Organizations: KING CITY JOINT UNION HIGH (SCHOOL DISTRICT)
GREENFIELD PRIMARY (801 WALNUT AVE. in GREENFIELD, CA)
(National Center for Education Statistics) - STATE ID-6111637 Organizations: GREENFIELD UNION ELEMENTARY (SCHOOL DISTRICT)
GRANITE CONSTRUCTION CO-ARROYO (45135 ARROYO SECO ROAD in GREENFIELD, CA)
CRITERIA AND HAZARDOUS AIR POLLUTANT INVENTORY (Inventory of air pollution sources) AIR MAJOR ("Best Available" air pollution technologies tracking) Business SIC classification: ASPHALT PAVING MIXTURES AND BLOCKS; CONSTRUCTION MACHINERY AND EQUIPMENT Alternative names: GRANITE CONSTRUCTION COMPANY, GRANITE CONSTRUCTION COMPANY
GRANITE CONSTRUCTION CO-METZ (18A METZ ROAD in GREENFIELD, CA)
CRITERIA AND HAZARDOUS AIR POLLUTANT INVENTORY (Inventory of air pollution sources) Business SIC classification: CONSTRUCTION MACHINERY AND EQUIPMENT; GASOLINE SERVICE STATIONS
INTEGRATED CROP MANAGEMENT CONSULTANTS (PO BOX 3230 in GREENFIELD, CA)
COMPLIANCE ACTIVITY (Tracking inspections of insecticide, fungicide, and rodenticide, and toxic substances)
ALLREDS CHEVRON SERVICE (202 EL CAMINO REAL in GREENFIELD, CA)
CRITERIA AND HAZARDOUS AIR POLLUTANT INVENTORY (Inventory of air pollution sources) Business SIC classification: GASOLINE SERVICE STATIONS
FASTRIP OIL CO., LP (145 EL CAMINO REAL in GREENFIELD, CA)
CRITERIA AND HAZARDOUS AIR POLLUTANT INVENTORY (Inventory of air pollution sources) Business SIC classification: GASOLINE SERVICE STATIONS
G. N. REEN, INC. (845 WALNUT AVE. in GREENFIELD, CA)
CRITERIA AND HAZARDOUS AIR POLLUTANT INVENTORY (Inventory of air pollution sources) Business SIC classification: PETROLEUM BULK STATIONS AND TERMINALS
GREENFIELD DISPOSAL SITE (ARROYO SECO RD., SOUTH SIDE, 6 in GREENFIELD, CA)
CRITERIA AND HAZARDOUS AIR POLLUTANT INVENTORY (Inventory of air pollution sources) Business SIC classification: REFUSE SYSTEMS Business NAICS classification: SOLID WASTE LANDFILL.
GREENFIELD LIQUOR SHOP, INC. (231 EL CAMINO REAL in GREENFIELD, CA)
CRITERIA AND HAZARDOUS AIR POLLUTANT INVENTORY (Inventory of air pollution sources) Business SIC classification: GASOLINE SERVICE STATIONS
KYUNG HO MIN (348 EL CAMINO REAL in GREENFIELD, CA)
CRITERIA AND HAZARDOUS AIR POLLUTANT INVENTORY (Inventory of air pollution sources) Business SIC classification: GASOLINE SERVICE STATIONS
LONG BEACH OIL DEVELOPMENT CO (ARROYO SECO RD & CENTRAL AVE in GREENFIELD, CA)
CRITERIA AND HAZARDOUS AIR POLLUTANT INVENTORY (Inventory of air pollution sources) Business SIC classification: CRUDE PETROLEUM AND NATURAL GAS
Housing units lacking complete plumbing facilities: 0.8% Housing units lacking complete kitchen facilities: 0.7%
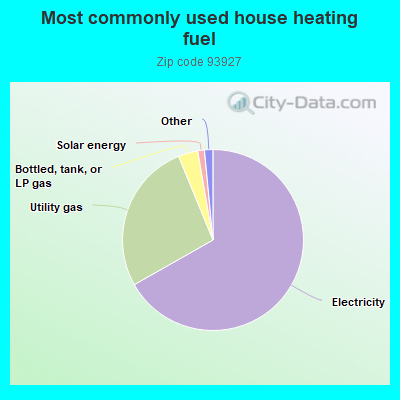
66.8%Electricity
27.0%Utility gas
3.5%Bottled, tank, or LP gas
1.2%Solar energy
0.8%Wood
0.6%No fuel used
Population in 1990: 8,728. Population change in the 1990s: +5,461 (+62.6%).
Place of birth for U.S.-born residents:
This state: 11,135
Northeast: 61
Midwest: 125
South: 124
West: 133
57% of the 93927 zip code residents lived in the same house 5 years ago. Out of people who lived in different houses, 89% lived in this county. Out of people who lived in different counties, 50% lived in California.
96% of the 93927 zip code residents lived in the same house 1 year ago. Out of people who lived in different houses, 76% moved from this county. Out of people who lived in different houses, 12% moved from different county within same state. Out of people who lived in different houses, 3% moved from different state. Out of people who lived in different houses, 16% moved from abroad.
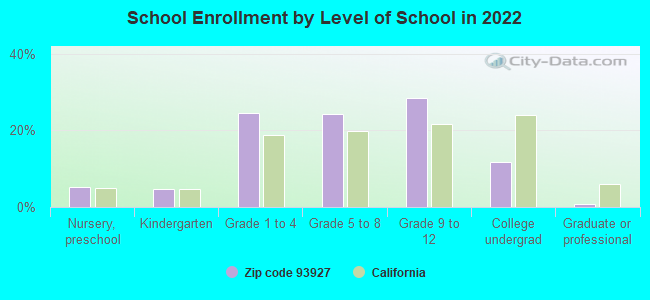
Private vs. public school enrollment:
Students in private schools in grades 1 to 8 (elementary and middle school): 29
Here:
1.0%
California:
10.5%
Students in private schools in grades 9 to 12 (high school):
Here:
0.0%
California:
8.5%
Students in private undergraduate colleges: 9
Here:
1.4%
California:
15.9%
Occupation by median earnings in the past 12 months ($)
119,204Law enforcement workers including supervisors
69,923Installation, maintenance, and repair occupations
60,144Health diagnosing and treating practitioners and other technical occupations
59,443Education, training, and library occupations
57,645Health technologists and technicians
50,953Management occupations
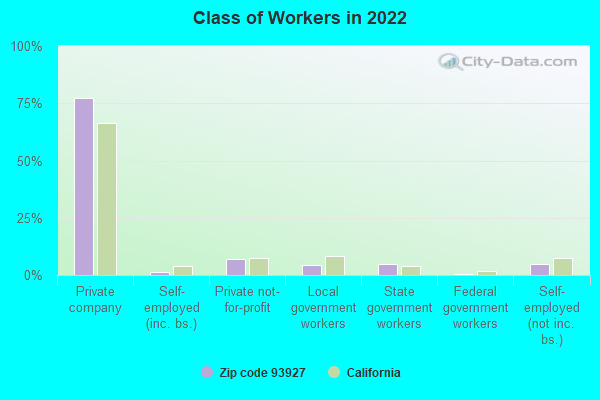
Top industries in this zip code by the number of employees in 2005:
2004 - 2018 National Fire Incident Reporting System (NFIRS) incidents
According to the data from the years 2004 - 2018 the average number of fire incidents per year is 57. The highest number of fires - 85 took place in 2011, and the least - 8 in 2004. The data has a rising trend.
When looking into fire subcategories, the most reports belonged to: Outside Fires (43.1%), and Structure Fires (33.3%).
Fire incident types reported to NFIRS in Zip Code 93927


 Nearest zip codes: 93960, 93920, 93928, 93926, 93924, 93925.
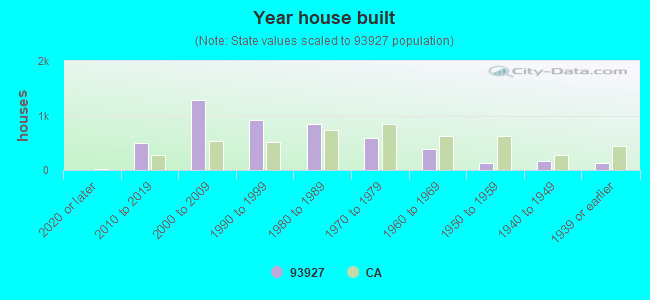


 According to the data from the years 2004 - 2018 the average number of fire incidents per year is 57. The highest number of fires - 85 took place in 2011, and the least - 8 in 2004. The data has a rising trend.
 When looking into fire subcategories, the most reports belonged to: Outside Fires (43.1%), and Structure Fires (33.3%).