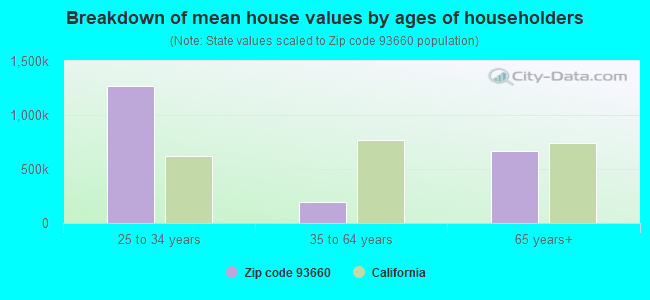
Estimated median house/condo value in 2022: $276,131
93660:
$276,131
California:
$715,900
According to our research of California and other state lists, there were 5 registered sex offenders living in 93660 zip code as of May 17, 2024. The ratio of all residents to sex offenders in zip code 93660 is 930 to 1. The ratio of registered sex offenders to all residents in this zip code is near the state average.
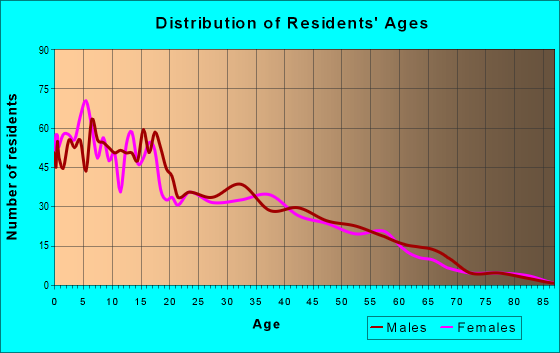
Median resident age:
This zip code:
26.7 years
California median age:
37.9 years
Average household size:
This zip code:
4.2 people
California:
2.8 people
Averages for the 2020 tax year for zip code 93660, filed in 2021:
Average Adjusted Gross Income (AGI) in 2020: $34,322 (Individual Income Tax Returns)
Here:
$34,322
State:
$95,910
Salary/wage: $29,835 (reported on 91.1% of returns)
Here:
$29,835
State:
$77,331
(% of AGI for various income ranges: 1860.5% for AGIs below $25k, 4990.9% for AGIs $25k-50k, 8825.6% for AGIs $50k-75k, 9270.0% for AGIs $75k-100k)
Taxable interest for individuals: $126 (reported on 12.1% of returns)
This zip code:
$126
California:
$2,294
(% of AGI for various income ranges: 0.2% for AGIs below $25k, 3.2% for AGIs $25k-50k, 1.9% for AGIs $50k-75k, 5.0% for AGIs $75k-100k)
Ordinary dividends: $1,050 (reported on 1.1% of returns)
Here:
$1,050
State:
$10,949
(% of AGI for various income ranges: 5.1% for AGIs below $25k)
Net capital gain/loss in AGI: +$3,900 (reported on 1.6% of returns)
Here:
+$3,900
State:
+$49,306
(% of AGI for various income ranges: 26.6% for AGIs $25k-50k)
Profit/loss from business: +$11,567 (reported on 7.9% of returns)
Here:
+$11,567
State:
+$15,671
(% of AGI for various income ranges: 112.4% for AGIs below $25k, 171.6% for AGIs $25k-50k, 324.4% for AGIs $50k-75k)
Earned income credit: $2,429 (reported on 32.6% of returns)
Here:
$2,429
State:
$2,074
(% of AGI for various income ranges: 191.5% for AGIs below $25k, 163.9% for AGIs $25k-50k)
Percentage of individuals using paid preparers for their 2020 taxes: 92.6%
Here:
93%
State:
92%
(% for various income ranges: 92.2% for AGIs below $25k, 93.2% for AGIs $25k-50k, 92.9% for AGIs $50k-75k, 87.5% for AGIs $75k-100k, 100.0% for AGIs $100k-200k)
Averages for the 2012 tax year for zip code 93660, filed in 2013:
Average Adjusted Gross Income (AGI) in 2012: $28,205 (Individual Income Tax Returns)
Here:
$28,205
State:
$72,726
Salary/wage: $24,665 (reported on 94.7% of returns)
Here:
$24,665
State:
$59,079
(% of AGI for various income ranges: 82.5% for AGIs below $25k, 91.4% for AGIs $25k-50k, 90.1% for AGIs $50k-75k, 36.9% for AGIs $75k-100k)
Taxable interest for individuals: $554 (reported on 8.7% of returns)
This zip code:
$554
California:
$2,146
(% of AGI for various income ranges: 0.1% for AGIs below $25k, 0.8% for AGIs $50k-75k)
Profit/loss from business: +$6,740 (reported on 6.7% of returns)
Here:
+$6,740
State:
+$17,064
Total itemized deductions: $16,720 (27% of AGI, reported on 6.7% of returns)
Here:
$16,720
State:
$34,004
Here:
26.7% of AGI
State:
22.7% of AGI
Charity contributions: $1,317 (reported on 4.0% of returns)
Here:
$1,317
State:
$4,659
Taxes paid: $4,700 (reported on 6.7% of returns)
93660:
$4,700
State:
$14,448
Earned income credit: $2,846 (reported on 44.7% of returns)
Here:
$2,846
State:
$2,286
(% of AGI for various income ranges: 10.8% for AGIs below $25k, 3.4% for AGIs $25k-50k)
Percentage of individuals using paid preparers for their 2012 taxes: 80.7%
Here:
81%
State:
64%
(% for various income ranges: 80.5% for AGIs below $25k, 81.4% for AGIs $25k-50k, 72.7% for AGIs $50k-75k, 100.0% for AGIs $75k-100k)
Averages for the 2004 tax year for zip code 93660, filed in 2005:
Average Adjusted Gross Income (AGI) in 2004: $25,979 (Individual Income Tax Returns)
Here:
$25,979
State:
$58,600
Salary/wage: $21,436 (reported on 95.3% of returns)
Here:
$21,436
State:
$49,455
(% of AGI for various income ranges: 85.3% for AGIs below $10k, 87.5% for AGIs $10k-25k, 87.2% for AGIs $25k-50k, 68.2% for AGIs $50k-75k)
Taxable interest for individuals: $967 (reported on 14.4% of returns)
This zip code:
$967
California:
$2,365
(% of AGI for various income ranges: 0.2% for AGIs $10k-25k, 0.3% for AGIs $25k-50k, 0.2% for AGIs $50k-75k, 3.0% for AGIs over 100k)
Taxable dividends: $2,632 (reported on 3.0% of returns)
Here:
$2,632
State:
$4,746
Net capital gain/loss: +$6,824 (reported on 1.3% of returns)
Here:
+$6,824
State:
+$23,418
Profit/loss from business: +$7,712 (reported on 5.7% of returns)
Here:
+$7,712
State:
+$16,826
Total itemized deductions: $14,586 (25% of AGI, reported on 5.5% of returns)
Here:
$14,586
State:
$28,113
Here:
24.8% of AGI
State:
25.3% of AGI
Charity contributions deductions: $1,473 (3% of AGI, reported on 4.3% of returns)
Here:
$1,473
State:
$3,923
Here:
2.8% of AGI
State:
3.3% of AGI
Total tax: $2,822 (reported on 37.1% of returns)
93660:
$2,822
State:
$10,761
(% of AGI for various income ranges: 1.1% for AGIs below $10k, 1.4% for AGIs $10k-25k, 2.7% for AGIs $25k-50k, 7.1% for AGIs $50k-75k, 15.0% for AGIs over 100k)
Earned income credit: $2,154 (reported on 50.4% of returns)
Here:
$2,154
State:
$1,763
Percentage of individuals using paid preparers for their 2004 taxes: 69.2%
Here:
69%
State:
66%
(% for various income ranges: 59.7% for AGIs below $10k, 68.2% for AGIs $10k-25k, 72.3% for AGIs $25k-50k, 70.9% for AGIs $50k-75k, 100.0% for AGIs over 100k)
Household received Food Stamps/SNAP in the past 12 months: 357 Household did not receive Food Stamps/SNAP in the past 12 months: 627
Women who had a birth in the past 12 months: 93 (83 now married, 10 unmarried) Women who did not have a birth in the past 12 months: 855 (363 now married, 490 unmarried)
Housing units in zip code 93660 with a mortgage: 362 Residents with income below the poverty level in 2022:
This zip code:
31.1%
Whole state:
12.2%
Residents with income below 50% of the poverty level in 2022:
This zip code:
24.7%
Whole state:
6.2%
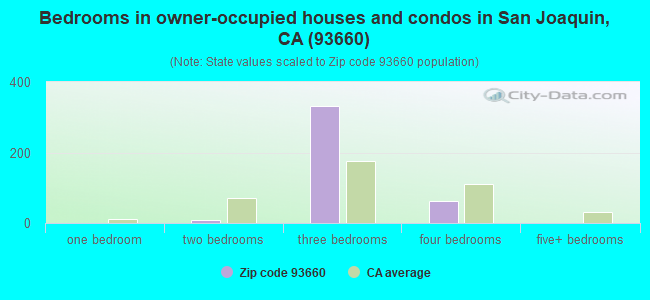
Median number of rooms in houses and condos:
Here:
5.3
State:
6.0
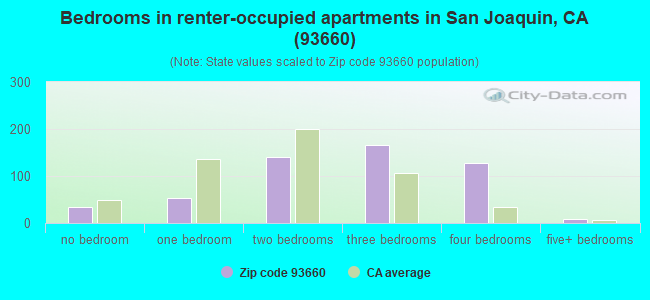
Median number of rooms in apartments:
Here:
4.8
State:
3.9
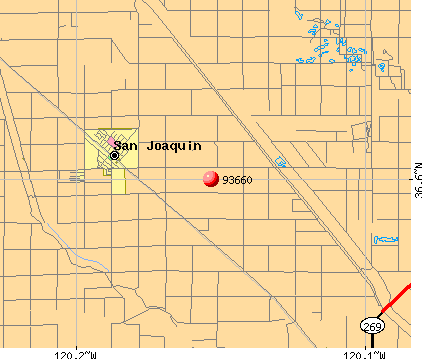
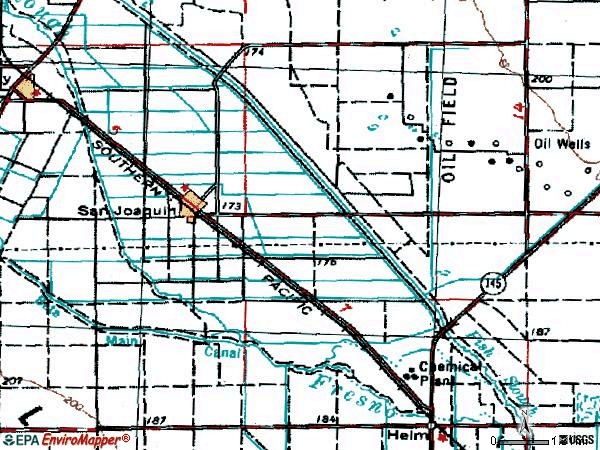
Notable locations in this zip code not listed on our city pages
Notable locations in zip code 93660: Deadmans Corners (A), Bar None Dairy (B), San Joaquin Substation (C), San Joaquin City Hall (D). Display/hide their locations on the map
Size of family households: 180 2-persons, 99 3-persons, 142 4-persons, 233 5-persons, 110 6-persons, 68 7-or-more-persons
Size of nonfamily households: 74 1-person, 12 4-persons
802 married couples with children.
412 single-parent households (43 men, 369 women).
18.1% of residents of 93660 zip code speak English at home.
81.2% of residents speak Spanish at home (43% very well, 28% well, 11% not well, 18% not at all).
0.6% of residents speak other language at home (100% very well).
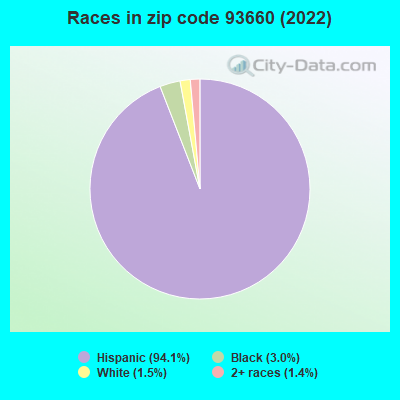
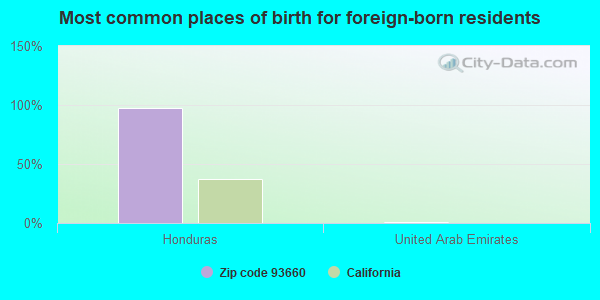
Foreign born population: 1,595 (41.0%) (32.2% of them are naturalized citizens)
This zip code:
41.0%
Whole state:
26.7%
97%Honduras
1%United Arab Emirates
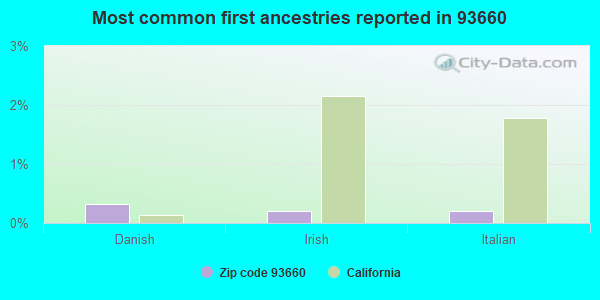
0%Danish
0%Irish
0%Italian
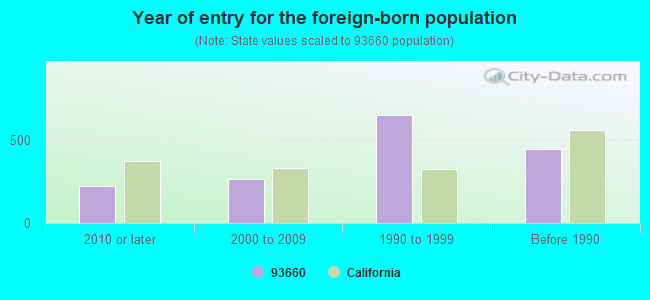
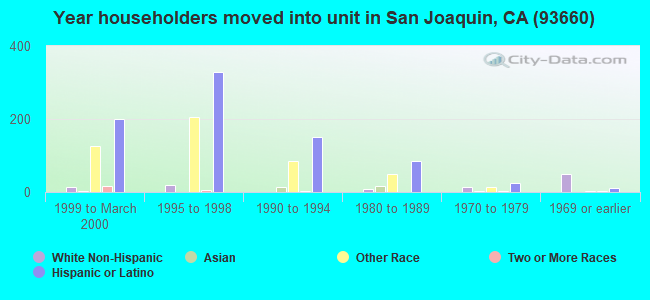
Year of entry for the foreign-born population
2232010 or later
2612000 to 2009
6471990 to 1999
444Before 1990
Facilities with environmental interests located in this zip code:
FRESNO COGEN PARTNERS (8105 SOUTH LASSEN AVENUE in SAN JOAQUIN, CA)
AIR MAJOR (AIRS/AFS) CRITERIA AND HAZARDOUS AIR POLLUTANT INVENTORY (Inventory of air pollution sources) AIR MAJOR ("Best Available" air pollution technologies tracking) Business SIC classification: ELECTRIC AND OTHER SERVICES COMBINED Alternative names: FRESNO COGENERATION PARTNERS, L.P., FRESNO COGENERATION PARTNERS, L.P.
HIGHWAY OVER CROSSINGS (HIGHWAY 99 POSTMILES 32.5/35.6 in SAN JOAQUIN, CA)
Small Quantity Generators, between 100 kg and 1000 kg of hazardous waste/month (Resource Conservation and Recovery Act (tracking hazardous waste))
ANDERSON CLAYTON CORPORATION NAPA GIN (23923 WEST HUNTSMAN in SAN JOAQUIN, CA)
CRITERIA AND HAZARDOUS AIR POLLUTANT INVENTORY (Inventory of air pollution sources)
Housing units lacking complete plumbing facilities: 2.4% Housing units lacking complete kitchen facilities: 1.9%
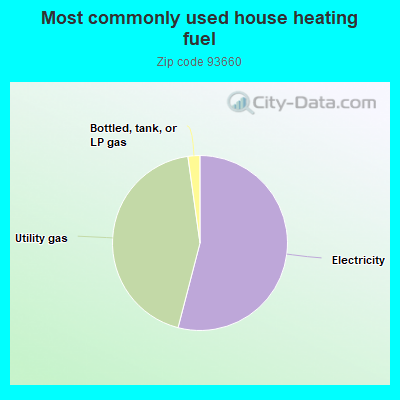
54.1%Electricity
43.8%Utility gas
2.2%Bottled, tank, or LP gas
Population in 1990: 2,727. Population change in the 1990s: +1,584 (+58.1%).
Place of birth for U.S.-born residents:
This state: 2,225
Midwest: 11
South: 38
West: 30
54% of the 93660 zip code residents lived in the same house 5 years ago. Out of people who lived in different houses, 90% lived in this county. Out of people who lived in different counties, 50% lived in California.
94% of the 93660 zip code residents lived in the same house 1 year ago. Out of people who lived in different houses, 91% moved from this county. Out of people who lived in different houses, 9% moved from different state.
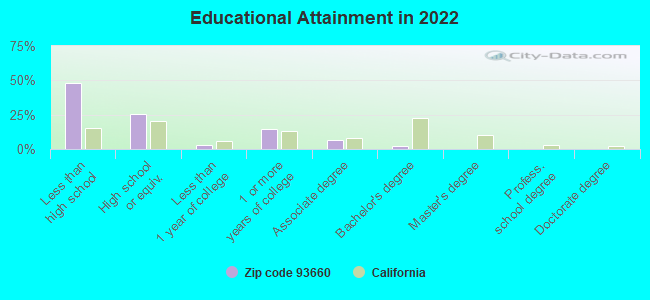
Private vs. public school enrollment:
Students in private schools in grades 1 to 8 (elementary and middle school):
Here:
0.0%
California:
10.5%
Students in private schools in grades 9 to 12 (high school):
Here:
0.0%
California:
8.5%
Students in private undergraduate colleges: 13
Here:
5.6%
California:
15.9%
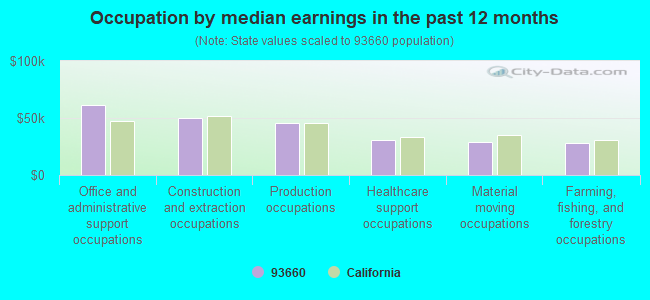
Occupation by median earnings in the past 12 months ($)
61,111Office and administrative support occupations
49,771Construction and extraction occupations
45,685Production occupations
30,271Healthcare support occupations
28,844Material moving occupations
28,410Farming, fishing, and forestry occupations
Top industries in this zip code by the number of employees in 2005:
Utilities: Electric Power Distribution (500-999 employees: 1 establishment)
Health Care and Social Assistance: All Other Outpatient Care Centers (20-49: 1)
Administrative and Support and Waste Management and Remediation Services: Convention and Trade Show Organizers (20-49: 1)
Health Care and Social Assistance: Offices of Physicians (except Mental Health Specialists) (5-9: 1)
Fatal accident statistics in 2011:
Fatal accident count: 2
Vehicles involved in fatal accidents: 4
Fatal accidents caused by drunken drivers: 2
Fatalities: 2
Persons involved in fatal accidents: 13
Pedestrians involved in fatal accidents: 0
Home Mortgage Disclosure Act Aggregated Statistics For Year 2009 (Based on 4 partial tracts)
A) FHA, FSA/RHS & VA Home Purchase Loans
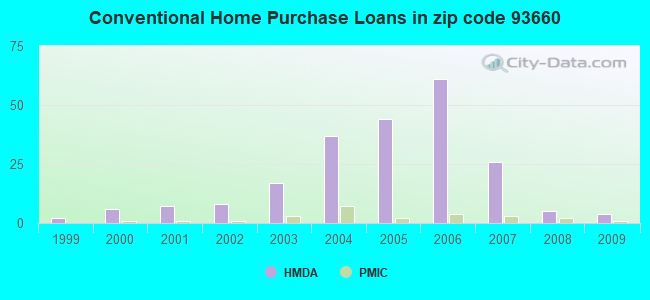
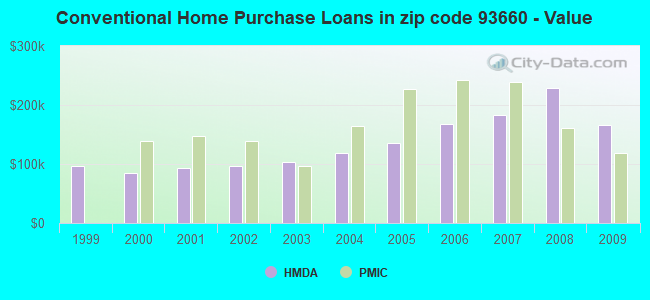
B) Conventional Home Purchase Loans
C) Refinancings
D) Home Improvement Loans
F) Non-occupant Loans on < 5 Family Dwellings (A B C & D)
G) Loans On Manufactured Home Dwelling (A B C & D)
Number
Average Value
Number
Average Value
Number
Average Value
Number
Average Value
Number
Average Value
Number
Average Value
LOANS ORIGINATED
5
$116,924
4
$166,562
7
$200,563
0
$0
1
$116,330
0
$0
APPLICATIONS APPROVED, NOT ACCEPTED
1
$91,870
1
$104,870
2
$258,240
0
$0
0
$0
0
$0
APPLICATIONS DENIED
5
$123,346
3
$105,663
8
$166,742
2
$77,670
1
$72,080
1
$56,970
APPLICATIONS WITHDRAWN
1
$132,950
1
$149,900
3
$154,027
0
$0
0
$0
0
$0
FILES CLOSED FOR INCOMPLETENESS
1
$39,290
0
$0
1
$71,820
0
$0
0
$0
0
$0
Aggregated Statistics For Year 2008 (Based on 4 partial tracts)
A) FHA, FSA/RHS & VA Home Purchase Loans
B) Conventional Home Purchase Loans
C) Refinancings
D) Home Improvement Loans
F) Non-occupant Loans on < 5 Family Dwellings (A B C & D)
G) Loans On Manufactured Home Dwelling (A B C & D)
Number
Average Value
Number
Average Value
Number
Average Value
Number
Average Value
Number
Average Value
Number
Average Value
LOANS ORIGINATED
4
$163,010
5
$228,696
11
$168,598
3
$68,737
1
$149,990
0
$0
APPLICATIONS APPROVED, NOT ACCEPTED
0
$0
2
$218,355
7
$153,414
1
$77,060
1
$107,370
0
$0
APPLICATIONS DENIED
2
$247,345
5
$219,276
21
$176,063
3
$64,567
2
$180,085
1
$120,990
APPLICATIONS WITHDRAWN
0
$0
1
$208,330
6
$180,040
1
$331,850
0
$0
0
$0
FILES CLOSED FOR INCOMPLETENESS
1
$135,590
1
$201,490
3
$160,930
1
$37,170
0
$0
0
$0
Aggregated Statistics For Year 2007 (Based on 4 partial tracts)
A) FHA, FSA/RHS & VA Home Purchase Loans
B) Conventional Home Purchase Loans
C) Refinancings
D) Home Improvement Loans
F) Non-occupant Loans on < 5 Family Dwellings (A B C & D)
G) Loans On Manufactured Home Dwelling (A B C & D)
Number
Average Value
Number
Average Value
Number
Average Value
Number
Average Value
Number
Average Value
Number
Average Value
LOANS ORIGINATED
1
$258,210
26
$182,713
33
$195,719
6
$131,583
6
$153,977
1
$52,310
APPLICATIONS APPROVED, NOT ACCEPTED
0
$0
7
$168,894
13
$172,392
1
$134,180
1
$202,370
0
$0
APPLICATIONS DENIED
1
$92,240
17
$190,466
42
$223,501
6
$112,567
5
$242,834
1
$163,070
APPLICATIONS WITHDRAWN
0
$0
3
$190,877
12
$217,221
2
$136,745
1
$255,250
0
$0
FILES CLOSED FOR INCOMPLETENESS
0
$0
3
$177,163
7
$262,779
0
$0
0
$0
0
$0
Aggregated Statistics For Year 2006 (Based on 4 partial tracts)
A) FHA, FSA/RHS & VA Home Purchase Loans
B) Conventional Home Purchase Loans
C) Refinancings
D) Home Improvement Loans
F) Non-occupant Loans on < 5 Family Dwellings (A B C & D)
G) Loans On Manufactured Home Dwelling (A B C & D)
Number
Average Value
Number
Average Value
Number
Average Value
Number
Average Value
Number
Average Value
Number
Average Value
LOANS ORIGINATED
1
$122,260
61
$168,462
52
$156,650
6
$100,248
9
$166,318
2
$69,450
APPLICATIONS APPROVED, NOT ACCEPTED
0
$0
18
$152,991
14
$160,129
5
$66,924
4
$156,820
0
$0
APPLICATIONS DENIED
0
$0
30
$150,973
34
$173,186
10
$107,229
5
$191,256
3
$76,453
APPLICATIONS WITHDRAWN
0
$0
16
$171,598
28
$163,831
3
$119,173
4
$161,012
0
$0
FILES CLOSED FOR INCOMPLETENESS
0
$0
4
$104,302
6
$175,757
0
$0
1
$146,150
0
$0
Aggregated Statistics For Year 2005 (Based on 4 partial tracts)
A) FHA, FSA/RHS & VA Home Purchase Loans
B) Conventional Home Purchase Loans
C) Refinancings
D) Home Improvement Loans
F) Non-occupant Loans on < 5 Family Dwellings (A B C & D)
G) Loans On Manufactured Home Dwelling (A B C & D)
Number
Average Value
Number
Average Value
Number
Average Value
Number
Average Value
Number
Average Value
Number
Average Value
LOANS ORIGINATED
2
$117,380
44
$135,964
56
$148,340
6
$98,437
9
$147,554
1
$146,820
APPLICATIONS APPROVED, NOT ACCEPTED
0
$0
12
$124,518
13
$122,170
3
$56,133
2
$134,955
1
$62,020
APPLICATIONS DENIED
0
$0
23
$136,092
44
$147,442
8
$106,401
4
$184,712
1
$89,530
APPLICATIONS WITHDRAWN
0
$0
15
$134,318
36
$165,348
3
$114,870
5
$124,960
0
$0
FILES CLOSED FOR INCOMPLETENESS
0
$0
2
$128,980
7
$143,356
0
$0
0
$0
0
$0
Aggregated Statistics For Year 2004 (Based on 4 partial tracts)
A) FHA, FSA/RHS & VA Home Purchase Loans
B) Conventional Home Purchase Loans
C) Refinancings
D) Home Improvement Loans
F) Non-occupant Loans on < 5 Family Dwellings (A B C & D)
G) Loans On Manufactured Home Dwelling (A B C & D)
Number
Average Value
Number
Average Value
Number
Average Value
Number
Average Value
Number
Average Value
Number
Average Value
LOANS ORIGINATED
7
$118,973
37
$118,594
35
$110,531
3
$94,010
3
$112,397
1
$66,760
APPLICATIONS APPROVED, NOT ACCEPTED
1
$79,040
7
$169,117
17
$105,356
3
$72,713
0
$0
1
$45,570
APPLICATIONS DENIED
1
$67,390
15
$141,513
41
$123,014
8
$101,508
2
$109,995
2
$125,185
APPLICATIONS WITHDRAWN
1
$167,780
6
$93,202
19
$131,723
1
$93,920
3
$58,553
2
$72,050
FILES CLOSED FOR INCOMPLETENESS
0
$0
1
$178,070
5
$131,152
0
$0
0
$0
0
$0
Aggregated Statistics For Year 2003 (Based on 4 partial tracts)
A) FHA, FSA/RHS & VA Home Purchase Loans
B) Conventional Home Purchase Loans
C) Refinancings
D) Home Improvement Loans
F) Non-occupant Loans on < 5 Family Dwellings (A B C & D)
Number
Average Value
Number
Average Value
Number
Average Value
Number
Average Value
Number
Average Value
LOANS ORIGINATED
6
$78,875
17
$103,502
40
$109,893
1
$27,500
5
$102,498
APPLICATIONS APPROVED, NOT ACCEPTED
0
$0
3
$204,440
9
$116,859
1
$24,300
1
$89,790
APPLICATIONS DENIED
2
$82,200
8
$120,106
24
$113,788
2
$29,420
2
$226,980
APPLICATIONS WITHDRAWN
0
$0
2
$141,525
18
$118,549
1
$19,640
2
$86,815
FILES CLOSED FOR INCOMPLETENESS
0
$0
0
$0
4
$78,822
0
$0
0
$0
Aggregated Statistics For Year 2002 (Based on 4 partial tracts)
A) FHA, FSA/RHS & VA Home Purchase Loans
B) Conventional Home Purchase Loans
C) Refinancings
D) Home Improvement Loans
F) Non-occupant Loans on < 5 Family Dwellings (A B C & D)
Number
Average Value
Number
Average Value
Number
Average Value
Number
Average Value
Number
Average Value
LOANS ORIGINATED
6
$93,357
8
$96,204
19
$111,186
1
$103,270
2
$51,850
APPLICATIONS APPROVED, NOT ACCEPTED
0
$0
1
$45,020
4
$83,900
0
$0
0
$0
APPLICATIONS DENIED
1
$143,050
4
$98,728
14
$101,544
2
$30,790
2
$39,290
APPLICATIONS WITHDRAWN
1
$48,050
1
$59,170
10
$91,214
0
$0
0
$0
FILES CLOSED FOR INCOMPLETENESS
1
$43,520
1
$1,510
2
$167,870
0
$0
0
$0
Aggregated Statistics For Year 2001 (Based on 4 partial tracts)
A) FHA, FSA/RHS & VA Home Purchase Loans
B) Conventional Home Purchase Loans
C) Refinancings
D) Home Improvement Loans
F) Non-occupant Loans on < 5 Family Dwellings (A B C & D)
Number
Average Value
Number
Average Value
Number
Average Value
Number
Average Value
Number
Average Value
LOANS ORIGINATED
7
$71,080
7
$93,586
14
$103,740
2
$29,960
1
$75,580
APPLICATIONS APPROVED, NOT ACCEPTED
0
$0
2
$86,035
3
$107,207
0
$0
0
$0
APPLICATIONS DENIED
0
$0
5
$101,734
19
$81,158
2
$9,265
1
$76,840
APPLICATIONS WITHDRAWN
4
$77,555
1
$43,850
12
$128,853
0
$0
1
$226,700
FILES CLOSED FOR INCOMPLETENESS
0
$0
0
$0
2
$204,590
0
$0
0
$0
Aggregated Statistics For Year 2000 (Based on 4 partial tracts)
A) FHA, FSA/RHS & VA Home Purchase Loans
B) Conventional Home Purchase Loans
C) Refinancings
D) Home Improvement Loans
F) Non-occupant Loans on < 5 Family Dwellings (A B C & D)
Number
Average Value
Number
Average Value
Number
Average Value
Number
Average Value
Number
Average Value
LOANS ORIGINATED
10
$78,346
6
$85,003
5
$86,584
2
$48,785
1
$96,260
APPLICATIONS APPROVED, NOT ACCEPTED
0
$0
2
$72,200
3
$81,050
1
$12,410
0
$0
APPLICATIONS DENIED
1
$42,910
3
$65,767
14
$65,859
2
$30,245
1
$46,540
APPLICATIONS WITHDRAWN
2
$76,005
1
$50,800
8
$75,394
1
$7,090
0
$0
FILES CLOSED FOR INCOMPLETENESS
0
$0
0
$0
1
$114,470
0
$0
0
$0
Aggregated Statistics For Year 1999 (Based on 2 partial tracts)
A) FHA, FSA/RHS & VA Home Purchase Loans
B) Conventional Home Purchase Loans
C) Refinancings
D) Home Improvement Loans
F) Non-occupant Loans on < 5 Family Dwellings (A B C & D)
Detailed PMIC statistics for the following Tracts:0039.00
, 0082.00
2006 - 2018 National Fire Incident Reporting System (NFIRS) incidents
Based on the data from the years 2006 - 2018 the average number of fires per year is 13. The highest number of fires - 22 took place in 2017, and the least - 2 in 2006. The data has a growing trend.
When looking into fire subcategories, the most reports belonged to: Outside Fires (50.0%), and Structure Fires (21.8%).
Fire incident types reported to NFIRS in Zip Code 93660
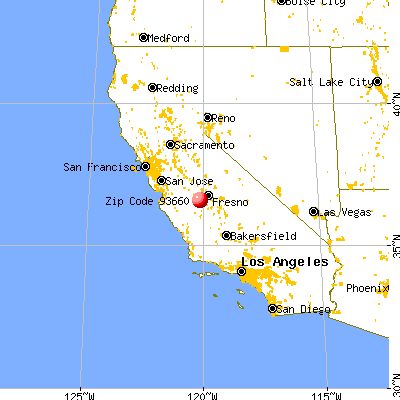


 Nearest zip codes: 93668, 93630, 93627, 93608, 93624, 93606.


 Based on the data from the years 2006 - 2018 the average number of fires per year is 13. The highest number of fires - 22 took place in 2017, and the least - 2 in 2006. The data has a growing trend.
 When looking into fire subcategories, the most reports belonged to: Outside Fires (50.0%), and Structure Fires (21.8%).