Estimated zip code population in 2022: 4,848 Zip code population in 2010: 5,640 Zip code population in 2000: 5,434
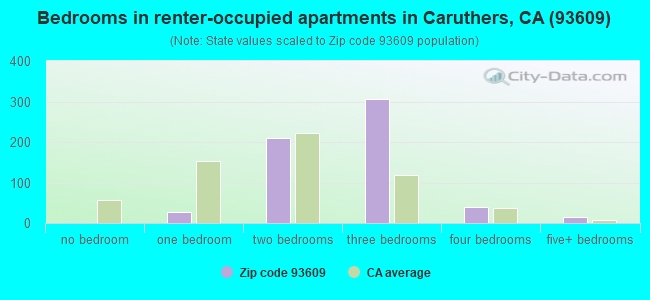
Houses and condos: 1,491 Renter-occupied apartments: 598
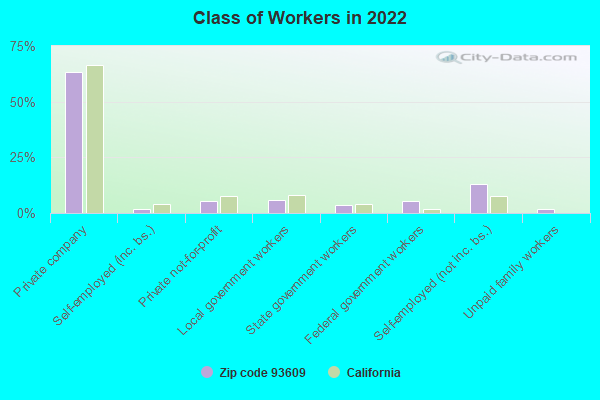
% of renters here:
45%
State:
44%
March 2022 cost of living index in zip code 93609: 94.7 (less than average, U.S. average is 100)
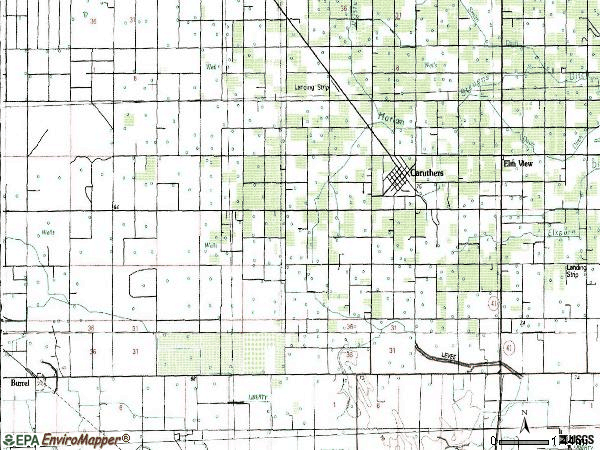
Land area: 61.5 sq. mi. Water area: 0.0 sq. mi.
Population density: 79 people per square mile
(very low).
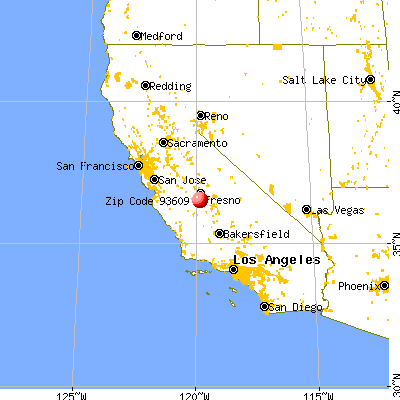
OSM Map
General Map
Google Map
MSN Map
OSM Map
General Map
Google Map
MSN Map
OSM Map
General Map
Google Map
MSN Map
OSM Map
General Map
Google Map
MSN Map
Please wait while loading the map...
Real estate property taxes paid for housing units in 2022:
This zip code:
0.6% ($1,559)
California:
0.7% ($4,831)
Median real estate property taxes paid for housing units with mortgages in 2022: $1,605 (0.5%) Median real estate property taxes paid for housing units with no mortgage in 2022: $1,530 (0.8%)
Business Search- 14 Million verified businesses
Males: 2,564
(52.9%)
Females: 2,283
(47.1%)
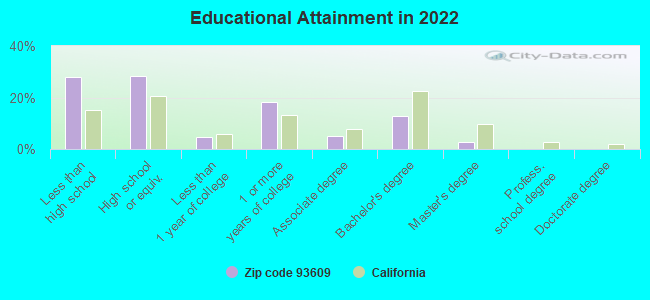
For population 25 years and over in 93609:
High school or higher: 70.5%
Bachelor's degree or higher: 15.4%
Graduate or professional degree: 2.9%
Unemployed: 6.0%
Mean travel time to work (commute): 24.0 minutes
For population 15 years and over in 93609:
Never married: 49.1%
Now married: 44.4%
Separated: 0.8%
Widowed: 1.1%
Divorced: 4.6%
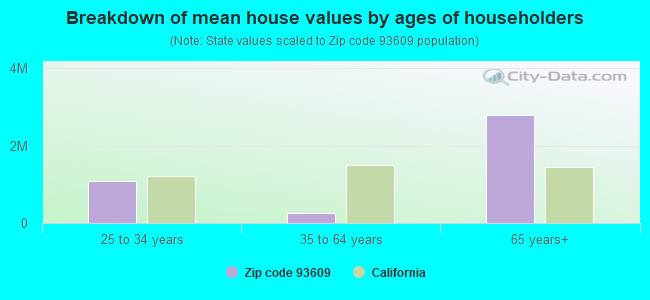
Zip code 93609 compared to state average:
Median house value significantly below state average.
Median age below state average.
Length of stay since moving in above state average.
Percentage of population with a bachelor's degree or higher significantly below state average.
Averages for the 2020 tax year for zip code 93609, filed in 2021:
Average Adjusted Gross Income (AGI) in 2020: $46,178 (Individual Income Tax Returns)
Here:
$46,178
State:
$95,910
Salary/wage: $40,108 (reported on 89.1% of returns)
Here:
$40,108
State:
$77,331
(% of AGI for various income ranges: 1725.4% for AGIs below $25k, 5255.1% for AGIs $25k-50k, 7990.0% for AGIs $50k-75k, 13297.8% for AGIs $75k-100k, 18980.0% for AGIs $100k-200k)
Taxable interest for individuals: $1,332 (reported on 22.3% of returns)
This zip code:
$1,332
California:
$2,294
(% of AGI for various income ranges: 6.8% for AGIs below $25k, 4.9% for AGIs $25k-50k, 54.8% for AGIs $50k-75k, 86.7% for AGIs $75k-100k, 115.0% for AGIs $100k-200k)
Ordinary dividends: $37,567 (reported on 5.0% of returns)
Here:
$37,567
State:
$10,949
(% of AGI for various income ranges: 14.8% for AGIs below $25k, 24.8% for AGIs $50k-75k, 5471.2% for AGIs $100k-200k)
Net capital gain/loss in AGI: +$20,040 (reported on 6.3% of returns)
Here:
+$20,040
State:
+$49,306
(% of AGI for various income ranges: 6.4% for AGIs below $25k, 10.6% for AGIs $25k-50k, 113.0% for AGIs $50k-75k, 338.8% for AGIs $100k-200k)
Profit/loss from business: +$9,460 (reported on 10.5% of returns)
Here:
+$9,460
State:
+$15,671
(% of AGI for various income ranges: 95.8% for AGIs below $25k, 144.7% for AGIs $25k-50k, 185.2% for AGIs $50k-75k, 307.8% for AGIs $75k-100k, 592.5% for AGIs $100k-200k)
Taxable individual retirement arrangement distribution: $8,350 (reported on 2.5% of returns)
93609:
$8,350
California:
$23,505
(% of AGI for various income ranges: 42.4% for AGIs $25k-50k, 366.2% for AGIs $100k-200k)
Total itemized deductions: $34,320 (reported on 4.2% of returns)
Here:
$34,320
State:
$39,517
(% of AGI for various income ranges: 392.6% for AGIs $50k-75k, 563.3% for AGIs $75k-100k, 2527.5% for AGIs $100k-200k)
Charity contributions: $16,738 (reported on 3.4% of returns)
Here:
$16,738
State:
$12,598
(% of AGI for various income ranges: 62.2% for AGIs $50k-75k, 1495.0% for AGIs $100k-200k)
Taxes paid: $7,500 (reported on 4.2% of returns)
93609:
$7,500
State:
$8,807
(% of AGI for various income ranges: 93.5% for AGIs $50k-75k, 166.7% for AGIs $75k-100k, 481.2% for AGIs $100k-200k)
Earned income credit: $2,322 (reported on 20.6% of returns)
Here:
$2,322
State:
$2,074
(% of AGI for various income ranges: 128.0% for AGIs below $25k, 101.6% for AGIs $25k-50k)
Percentage of individuals using paid preparers for their 2020 taxes: 90.3%
Here:
90%
State:
92%
(% for various income ranges: 88.5% for AGIs below $25k, 90.1% for AGIs $25k-50k, 94.3% for AGIs $50k-75k, 87.5% for AGIs $75k-100k, 93.3% for AGIs $100k-200k, 100.0% for AGIs over 200k)
Averages for the 2012 tax year for zip code 93609, filed in 2013:
Average Adjusted Gross Income (AGI) in 2012: $47,516 (Individual Income Tax Returns)
Here:
$47,516
State:
$72,726
Salary/wage: $30,821 (reported on 89.4% of returns)
Here:
$30,821
State:
$59,079
(% of AGI for various income ranges: 83.3% for AGIs below $25k, 88.2% for AGIs $25k-50k, 80.8% for AGIs $50k-75k, 72.7% for AGIs $75k-100k, 63.4% for AGIs $100k-200k, 8.3% for AGIs over 200k)
Taxable interest for individuals: $1,398 (reported on 20.8% of returns)
This zip code:
$1,398
California:
$2,146
(% of AGI for various income ranges: 0.5% for AGIs below $25k, 0.2% for AGIs $25k-50k, 0.2% for AGIs $50k-75k, 0.9% for AGIs $75k-100k, 1.3% for AGIs $100k-200k, 0.8% for AGIs over 200k)
Ordinary dividends: $2,742 (reported on 5.3% of returns)
Here:
$2,742
State:
$9,308
(% of AGI for various income ranges: 0.2% for AGIs $25k-50k, 0.6% for AGIs $50k-75k, 1.6% for AGIs $100k-200k)
Net capital gain/loss in AGI: +$21,130 (reported on 4.4% of returns)
Here:
+$21,130
State:
+$30,460
(% of AGI for various income ranges: 15.7% for AGIs $100k-200k)
Profit/loss from business: +$12,867 (reported on 9.3% of returns)
Here:
+$12,867
State:
+$17,064
(% of AGI for various income ranges: 4.5% for AGIs below $25k, 2.7% for AGIs $25k-50k, 1.2% for AGIs $50k-75k, 5.0% for AGIs $75k-100k, 5.2% for AGIs $100k-200k)
Taxable individual retirement arrangement distribution: $10,300 (reported on 3.5% of returns)
93609:
$10,300
California:
$19,557
Total itemized deductions: $29,119 (20% of AGI, reported on 16.4% of returns)
Here:
$29,119
State:
$34,004
Here:
19.6% of AGI
State:
22.7% of AGI
(% of AGI for various income ranges: 1.9% for AGIs below $25k, 5.3% for AGIs $25k-50k, 10.4% for AGIs $50k-75k, 15.5% for AGIs $75k-100k, 13.9% for AGIs $100k-200k, 14.2% for AGIs over 200k)
Charity contributions: $4,661 (reported on 12.4% of returns)
Here:
$4,661
State:
$4,659
(% of AGI for various income ranges: 0.2% for AGIs below $25k, 0.4% for AGIs $25k-50k, 1.6% for AGIs $50k-75k, 2.8% for AGIs $75k-100k, 2.3% for AGIs $100k-200k, 1.2% for AGIs over 200k)
Taxes paid: $12,376 (reported on 16.4% of returns)
93609:
$12,376
State:
$14,448
(% of AGI for various income ranges: 0.2% for AGIs below $25k, 1.0% for AGIs $25k-50k, 2.1% for AGIs $50k-75k, 3.5% for AGIs $75k-100k, 5.0% for AGIs $100k-200k, 9.3% for AGIs over 200k)
Earned income credit: $2,497 (reported on 30.5% of returns)
Here:
$2,497
State:
$2,286
(% of AGI for various income ranges: 8.1% for AGIs below $25k, 1.8% for AGIs $25k-50k)
Percentage of individuals using paid preparers for their 2012 taxes: 70.8%
Here:
71%
State:
64%
(% for various income ranges: 70.3% for AGIs below $25k, 70.4% for AGIs $25k-50k, 68.4% for AGIs $50k-75k, 72.7% for AGIs $75k-100k, 72.7% for AGIs $100k-200k, 100.0% for AGIs over 200k)
Averages for the 2004 tax year for zip code 93609, filed in 2005:
Average Adjusted Gross Income (AGI) in 2004: $33,115 (Individual Income Tax Returns)
Here:
$33,115
State:
$58,600
Salary/wage: $27,388 (reported on 88.2% of returns)
Here:
$27,388
State:
$49,455
(% of AGI for various income ranges: 85.3% for AGIs $10k-25k, 86.2% for AGIs $25k-50k, 83.3% for AGIs $50k-75k, 77.8% for AGIs $75k-100k, 20.7% for AGIs over 100k)
Taxable interest for individuals: $2,317 (reported on 30.2% of returns)
This zip code:
$2,317
California:
$2,365
(% of AGI for various income ranges: 1.0% for AGIs $10k-25k, 0.6% for AGIs $25k-50k, 0.9% for AGIs $50k-75k, 0.8% for AGIs $75k-100k, 4.0% for AGIs over 100k)
Taxable dividends: $1,749 (reported on 8.3% of returns)
Here:
$1,749
State:
$4,746
(% of AGI for various income ranges: 0.3% for AGIs $10k-25k, 0.3% for AGIs $25k-50k, 0.2% for AGIs $50k-75k, 0.1% for AGIs $75k-100k, 0.6% for AGIs over 100k)
Net capital gain/loss: +$6,057 (reported on 7.6% of returns)
Here:
+$6,057
State:
+$23,418
(% of AGI for various income ranges: 0.0% for AGIs $10k-25k, -0.3% for AGIs $25k-50k, 1.9% for AGIs $50k-75k, 2.1% for AGIs $75k-100k, 2.1% for AGIs over 100k)
Profit/loss from business: +$10,010 (reported on 9.7% of returns)
Here:
+$10,010
State:
+$16,826
(% of AGI for various income ranges: 3.6% for AGIs $10k-25k, 4.0% for AGIs $25k-50k, 1.0% for AGIs $50k-75k, 3.1% for AGIs over 100k)
Profit/loss from farming: +$3,818 (reported on 6.6% of returns)
Here:
+$3,818
State:
-$7,562
(% of AGI for various income ranges: 0.5% for AGIs $10k-25k, -0.6% for AGIs $25k-50k, 1.8% for AGIs $50k-75k, 1.8% for AGIs over 100k)
IRA payment deduction: $3,500 (reported on 1.4% of returns)
93609:
$3,500
California:
$3,192
Total itemized deductions: $21,616 (21% of AGI, reported on 17.5% of returns)
Here:
$21,616
State:
$28,113
Here:
20.8% of AGI
State:
25.3% of AGI
(% of AGI for various income ranges: 4.7% for AGIs $10k-25k, 8.5% for AGIs $25k-50k, 13.2% for AGIs $50k-75k, 16.9% for AGIs $75k-100k, 12.2% for AGIs over 100k)
Charity contributions deductions: $2,935 (3% of AGI, reported on 15.5% of returns)
Here:
$2,935
State:
$3,923
Here:
2.7% of AGI
State:
3.3% of AGI
(% of AGI for various income ranges: 0.4% for AGIs $10k-25k, 1.0% for AGIs $25k-50k, 2.3% for AGIs $50k-75k, 2.1% for AGIs $75k-100k, 1.2% for AGIs over 100k)
Total tax: $7,791 (reported on 56.3% of returns)
93609:
$7,791
State:
$10,761
(% of AGI for various income ranges: 2.7% for AGIs $10k-25k, 4.6% for AGIs $25k-50k, 7.7% for AGIs $50k-75k, 9.4% for AGIs $75k-100k, 26.5% for AGIs over 100k)
Earned income credit: $2,033 (reported on 32.4% of returns)
Here:
$2,033
State:
$1,763
Percentage of individuals using paid preparers for their 2004 taxes: 70.0%
Here:
70%
State:
66%
(% for various income ranges: 67.3% for AGIs below $10k, 65.6% for AGIs $10k-25k, 73.8% for AGIs $25k-50k, 75.4% for AGIs $50k-75k, 72.6% for AGIs $75k-100k, 91.4% for AGIs over 100k)
Household received Food Stamps/SNAP in the past 12 months: 423 Household did not receive Food Stamps/SNAP in the past 12 months: 959
Women who had a birth in the past 12 months: 85 (47 now married, 38 unmarried) Women who did not have a birth in the past 12 months: 1,369 (425 now married, 948 unmarried)
Housing units in zip code 93609 with a mortgage: 388 (9 second mortgage, 9 both second mortgage and home equity loan) Median monthly owner costs for units with a mortgage: $1,488 Median monthly owner costs for units without a mortgage: $503
Residents with income below the poverty level in 2022:
This zip code:
15.1%
Whole state:
12.2%
Residents with income below 50% of the poverty level in 2022:
This zip code:
7.1%
Whole state:
6.2%
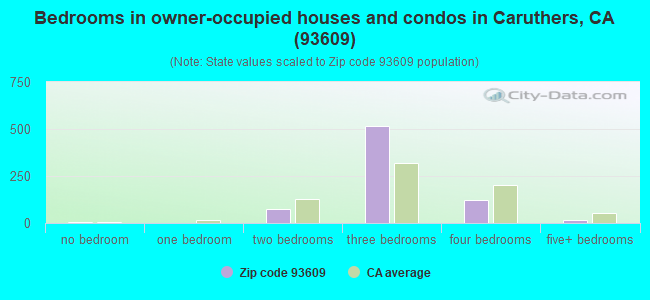
Median number of rooms in houses and condos:
Here:
5.5
State:
6.0
Median number of rooms in apartments:
Here:
5.0
State:
3.9
Notable locations in this zip code not listed on our city pages
Notable locations in zip code 93609: Caruthers Substation (A), Fresno County Fire Protection District Station 90 Caruthers (B). Display/hide their locations on the map
In group quarters: 35 (-1 institutionalized population)
Size of family households: 305 2-persons, 301 3-persons, 202 4-persons, 195 5-persons, 84 6-persons, 87 7-or-more-persons
Size of nonfamily households: 125 1-person, 14 2-persons
522 married couples with children.
513 single-parent households (280 men, 233 women).
36.5% of residents of 93609 zip code speak English at home.
58.8% of residents speak Spanish at home (65% very well, 14% well, 9% not well, 11% not at all).
3.4% of residents speak other Indo-European language at home (77% very well, 4% well, 8% not well, 11% not at all).
1.0% of residents speak Asian or Pacific Island language at home (85% very well, 15% not at all).
0.4% of residents speak other language at home (35% very well, 65% not at all).
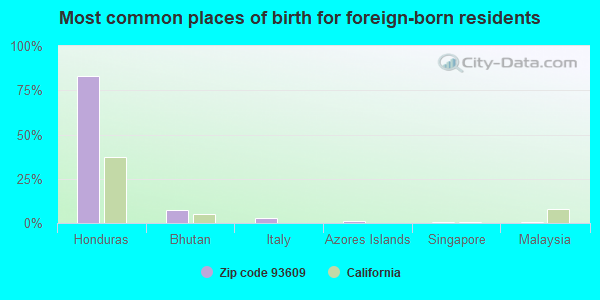
Foreign born population: 1,321 (27.3%) (30.7% of them are naturalized citizens)
This zip code:
27.3%
Whole state:
26.7%
83%Honduras
8%Bhutan
3%Italy
1%Azores Islands
1%Singapore
1%Malaysia
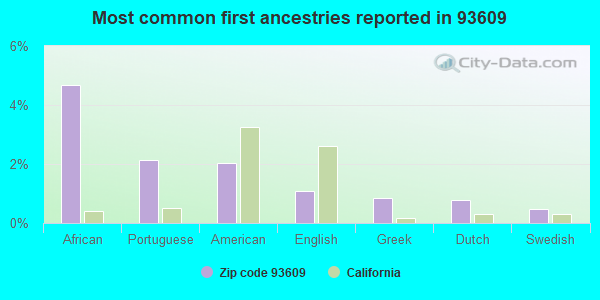
5%African
2%Portuguese
2%American
1%English
1%Greek
1%Dutch
0%Swedish
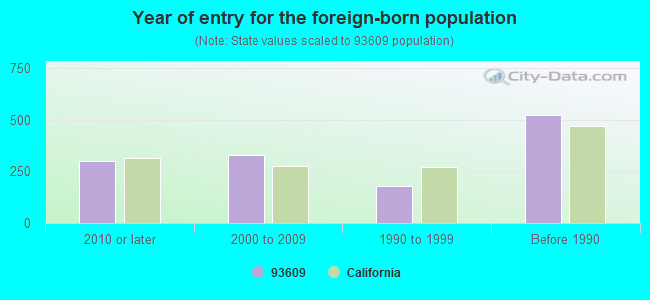
Year of entry for the foreign-born population
3022010 or later
3312000 to 2009
1781990 to 1999
524Before 1990
Facilities with environmental interests located in this zip code:
ALVINA ELEMENTARY CHARTER (295 W. SAGINAW AVE. in CARUTHERS, CA)
(National Center for Education Statistics) - STATE ID-6005730
MARC HIGH (2580 W. TAHOE in CARUTHERS, CA)
(National Center for Education Statistics) - STATE ID-1030543 Organizations: CARUTHERS UNIFIED (SCHOOL DISTRICT)
CARUTHERS ELEMENTARY (S QUICE AVE. & W SANDY AVE. in CARUTHERS, CA)
(National Center for Education Statistics) - STATE ID-6005813 Organizations: CARUTHERS UNIFIED (SCHOOL DISTRICT)
CARUTHERS HIGH (2580 W. TAHOE AVE. in CARUTHERS, CA)
(National Center for Education Statistics) - STATE ID-1030535 Organizations: CARUTHERS UNIFIED (SCHOOL DISTRICT)
CARUTHERS PUMP (2199 W SUPERIOR in CARUTHERS, CA)
Small Quantity Generators, between 100 kg and 1000 kg of hazardous waste/month (Resource Conservation and Recovery Act (tracking hazardous waste)) - notification Organizations: CARUTHERS PUMP INC (CONTACT/OWNER)
GILL'S TEXACO (2459 TAHOE in CARUTHERS, CA)
CRITERIA AND HAZARDOUS AIR POLLUTANT INVENTORY (Inventory of air pollution sources) Business SIC classification: GASOLINE SERVICE STATIONS
H&R GUNLUND RANCHES, INC (3675 W SAGINAW in CARUTHERS, CA)
CRITERIA AND HAZARDOUS AIR POLLUTANT INVENTORY (Inventory of air pollution sources) Alternative names: H&R GUNLAND RANCHES, INC
HAGGMARK DEHYDRATOR (12057 S HUGHES in CARUTHERS, CA)
CRITERIA AND HAZARDOUS AIR POLLUTANT INVENTORY (Inventory of air pollution sources) Business SIC classification: NONCLASSIFIABLE ESTABLISHMENTS
JACO OIL COMPANY (TAHOE & HENDERSON RD in CARUTHERS, CA)
CRITERIA AND HAZARDOUS AIR POLLUTANT INVENTORY (Inventory of air pollution sources) Business SIC classification: GASOLINE SERVICE STATIONS
Housing units lacking complete plumbing facilities: 0.6% Housing units lacking complete kitchen facilities: 5.5%
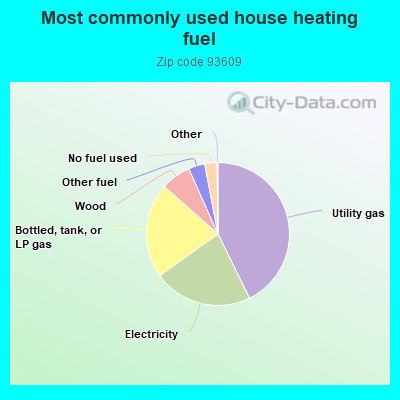
42.9%Utility gas
22.5%Electricity
21.5%Bottled, tank, or LP gas
6.8%Wood
3.7%Other fuel
2.8%No fuel used
Population in 1990: 4,558. Population change in the 1990s: +876 (+19.2%).
Place of birth for U.S.-born residents:
This state: 3,231
Midwest: 20
South: 161
West: 112
61% of the 93609 zip code residents lived in the same house 5 years ago. Out of people who lived in different houses, 77% lived in this county. Out of people who lived in different counties, 50% lived in California.
96% of the 93609 zip code residents lived in the same house 1 year ago. Out of people who lived in different houses, 77% moved from this county. Out of people who lived in different houses, 29% moved from different county within same state.
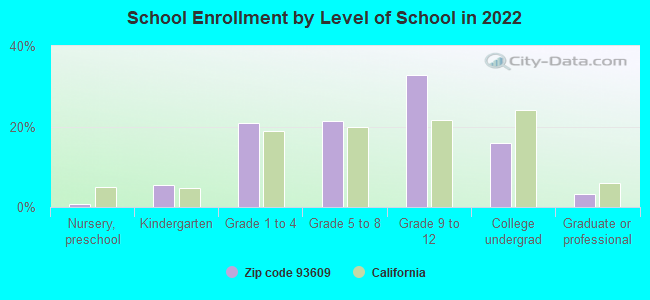
Private vs. public school enrollment:
Students in private schools in grades 1 to 8 (elementary and middle school):
Here:
0.0%
California:
10.5%
Students in private schools in grades 9 to 12 (high school):
Here:
0.0%
California:
8.5%
Students in private undergraduate colleges: 30
Here:
14.3%
California:
15.9%
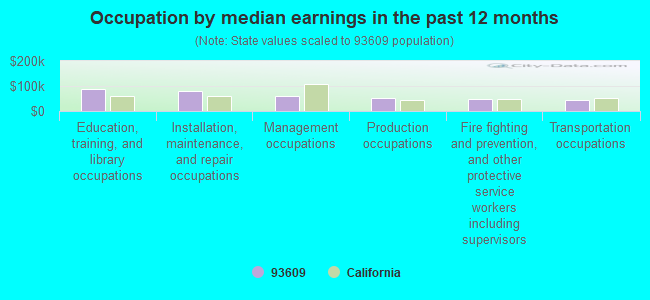
Occupation by median earnings in the past 12 months ($)
87,609Education, training, and library occupations
81,511Installation, maintenance, and repair occupations
60,096Management occupations
51,499Production occupations
46,542Fire fighting and prevention, and other protective service workers including supervisors
43,054Transportation occupations
Top industries in this zip code by the number of employees in 2005:
Construction: New Single-Family Housing Construction (except Operative Builders) (50-99 employees: 1 establishment, 1-4 employees: 1 establishment)
Administrative and Support and Waste Management and Remediation Services: Janitorial Services (20-49: 1, 10-19: 1)
Construction: Water and Sewer Line and Related Structures Construction (20-49: 1, 10-19: 1)
Construction: Highway, Street, and Bridge Construction (20-49: 1)
Construction: Other Heavy and Civil Engineering Construction (20-49: 1)
People in group quarters in 2010:
20 people in workers' group living quarters and job corps centers
11 people in emergency and transitional shelters (with sleeping facilities) for people experiencing homelessness
People in group quarters in 2000:
148 people in unknown juvenile institutions
41 people in agriculture workers' dormitories on farms
12 people in other noninstitutional group quarters
Fatal accident statistics in 2014:
Fatal accident count: 2
Vehicles involved in fatal accidents: 3
Fatal accidents caused by drunken drivers: 0
Fatalities: 2
Persons involved in fatal accidents: 3
Pedestrians involved in fatal accidents: 1
Fatal accident statistics in 2013:
Fatal accident count: 1
Vehicles involved in fatal accidents: 2
Fatal accidents caused by drunken drivers: 1
Fatalities: 1
Persons involved in fatal accidents: 3
Pedestrians involved in fatal accidents: 0
Home Mortgage Disclosure Act Aggregated Statistics For Year 2009 (Based on 4 partial tracts)
A) FHA, FSA/RHS & VA Home Purchase Loans
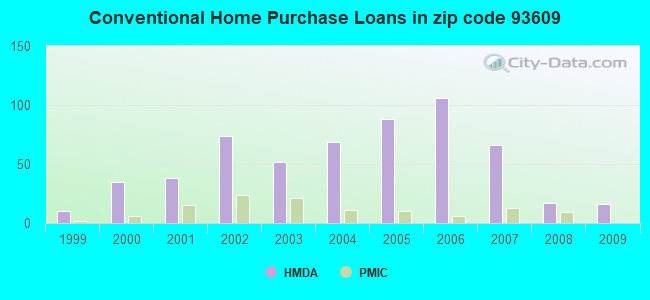
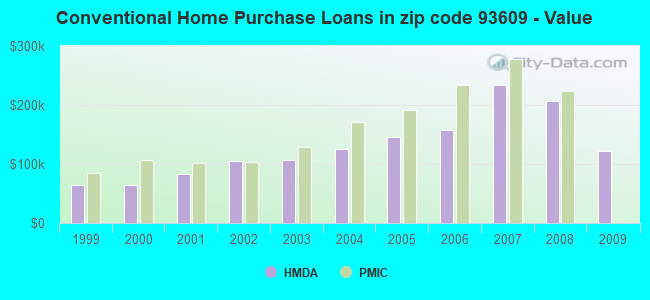
B) Conventional Home Purchase Loans
C) Refinancings
D) Home Improvement Loans
F) Non-occupant Loans on < 5 Family Dwellings (A B C & D)
G) Loans On Manufactured Home Dwelling (A B C & D)
Number
Average Value
Number
Average Value
Number
Average Value
Number
Average Value
Number
Average Value
Number
Average Value
LOANS ORIGINATED
17
$150,334
16
$121,262
43
$194,762
5
$166,712
3
$189,530
6
$142,960
APPLICATIONS APPROVED, NOT ACCEPTED
0
$0
2
$112,580
6
$256,073
0
$0
0
$0
0
$0
APPLICATIONS DENIED
4
$130,778
9
$531,530
60
$217,966
8
$301,639
5
$285,646
0
$0
APPLICATIONS WITHDRAWN
5
$207,774
7
$141,817
16
$202,410
0
$0
2
$163,675
0
$0
FILES CLOSED FOR INCOMPLETENESS
2
$154,855
0
$0
15
$257,760
0
$0
0
$0
0
$0
Aggregated Statistics For Year 2008 (Based on 4 partial tracts)
A) FHA, FSA/RHS & VA Home Purchase Loans
B) Conventional Home Purchase Loans
C) Refinancings
D) Home Improvement Loans
F) Non-occupant Loans on < 5 Family Dwellings (A B C & D)
G) Loans On Manufactured Home Dwelling (A B C & D)
Number
Average Value
Number
Average Value
Number
Average Value
Number
Average Value
Number
Average Value
Number
Average Value
LOANS ORIGINATED
22
$113,665
17
$206,925
82
$205,419
14
$102,029
10
$315,284
10
$106,255
APPLICATIONS APPROVED, NOT ACCEPTED
2
$129,195
6
$104,072
22
$153,688
0
$0
2
$87,605
1
$59,860
APPLICATIONS DENIED
4
$178,828
18
$286,368
89
$176,653
17
$105,554
13
$177,124
6
$100,955
APPLICATIONS WITHDRAWN
4
$102,205
2
$221,225
21
$262,529
5
$156,096
2
$84,065
2
$86,720
FILES CLOSED FOR INCOMPLETENESS
2
$115,920
7
$171,164
6
$212,323
0
$0
0
$0
2
$89,375
Aggregated Statistics For Year 2007 (Based on 4 partial tracts)
A) FHA, FSA/RHS & VA Home Purchase Loans
B) Conventional Home Purchase Loans
C) Refinancings
D) Home Improvement Loans
F) Non-occupant Loans on < 5 Family Dwellings (A B C & D)
G) Loans On Manufactured Home Dwelling (A B C & D)
Number
Average Value
Number
Average Value
Number
Average Value
Number
Average Value
Number
Average Value
Number
Average Value
LOANS ORIGINATED
7
$93,746
66
$233,988
208
$170,654
32
$106,447
17
$178,957
5
$121,838
APPLICATIONS APPROVED, NOT ACCEPTED
0
$0
10
$258,596
46
$179,491
5
$79,670
0
$0
0
$0
APPLICATIONS DENIED
1
$118,230
54
$200,372
153
$222,102
34
$154,760
15
$221,818
6
$109,805
APPLICATIONS WITHDRAWN
4
$153,972
15
$244,838
50
$177,616
4
$141,938
7
$259,149
2
$92,915
FILES CLOSED FOR INCOMPLETENESS
0
$0
4
$345,552
29
$202,846
2
$246,885
5
$221,224
1
$204,490
Aggregated Statistics For Year 2006 (Based on 4 partial tracts)
B) Conventional Home Purchase Loans
C) Refinancings
D) Home Improvement Loans
F) Non-occupant Loans on < 5 Family Dwellings (A B C & D)
G) Loans On Manufactured Home Dwelling (A B C & D)
Number
Average Value
Number
Average Value
Number
Average Value
Number
Average Value
Number
Average Value
LOANS ORIGINATED
106
$158,408
179
$174,559
39
$103,217
15
$137,358
5
$116,934
APPLICATIONS APPROVED, NOT ACCEPTED
35
$137,627
48
$157,184
4
$201,758
11
$94,198
1
$139,430
APPLICATIONS DENIED
95
$148,173
165
$206,675
28
$77,377
19
$161,244
9
$79,957
APPLICATIONS WITHDRAWN
39
$155,537
108
$158,795
11
$67,635
5
$166,010
2
$68,135
FILES CLOSED FOR INCOMPLETENESS
9
$88,687
18
$145,112
2
$265,470
0
$0
0
$0
Aggregated Statistics For Year 2005 (Based on 4 partial tracts)
A) FHA, FSA/RHS & VA Home Purchase Loans
B) Conventional Home Purchase Loans
C) Refinancings
D) Home Improvement Loans
E) Loans on Dwellings For 5+ Families
F) Non-occupant Loans on < 5 Family Dwellings (A B C & D)
G) Loans On Manufactured Home Dwelling (A B C & D)
Number
Average Value
Number
Average Value
Number
Average Value
Number
Average Value
Number
Average Value
Number
Average Value
Number
Average Value
LOANS ORIGINATED
4
$161,938
88
$145,550
270
$147,888
40
$114,749
2
$1,980,405
19
$156,021
6
$115,835
APPLICATIONS APPROVED, NOT ACCEPTED
0
$0
20
$179,144
45
$171,159
13
$62,221
0
$0
6
$248,097
3
$64,060
APPLICATIONS DENIED
0
$0
53
$144,848
148
$142,591
47
$69,091
0
$0
18
$176,217
12
$64,768
APPLICATIONS WITHDRAWN
0
$0
35
$145,056
138
$155,278
17
$77,704
0
$0
5
$106,970
4
$151,102
FILES CLOSED FOR INCOMPLETENESS
0
$0
3
$213,660
21
$122,717
2
$80,525
0
$0
1
$243,530
2
$101,925
Aggregated Statistics For Year 2004 (Based on 4 partial tracts)
A) FHA, FSA/RHS & VA Home Purchase Loans
B) Conventional Home Purchase Loans
C) Refinancings
D) Home Improvement Loans
F) Non-occupant Loans on < 5 Family Dwellings (A B C & D)
G) Loans On Manufactured Home Dwelling (A B C & D)
Number
Average Value
Number
Average Value
Number
Average Value
Number
Average Value
Number
Average Value
Number
Average Value
LOANS ORIGINATED
2
$102,650
69
$124,943
208
$115,550
31
$110,371
21
$100,516
1
$107,820
APPLICATIONS APPROVED, NOT ACCEPTED
0
$0
12
$155,518
60
$129,252
4
$167,290
7
$149,927
1
$104,850
APPLICATIONS DENIED
4
$133,178
44
$158,921
191
$103,062
32
$89,434
11
$136,890
5
$91,366
APPLICATIONS WITHDRAWN
2
$139,815
22
$152,965
142
$118,292
12
$43,556
3
$118,260
2
$130,840
FILES CLOSED FOR INCOMPLETENESS
0
$0
2
$162,820
13
$135,443
4
$54,302
0
$0
0
$0
Aggregated Statistics For Year 2003 (Based on 4 partial tracts)
A) FHA, FSA/RHS & VA Home Purchase Loans
B) Conventional Home Purchase Loans
C) Refinancings
D) Home Improvement Loans
F) Non-occupant Loans on < 5 Family Dwellings (A B C & D)
Number
Average Value
Number
Average Value
Number
Average Value
Number
Average Value
Number
Average Value
LOANS ORIGINATED
14
$94,510
52
$106,618
243
$100,172
10
$48,180
17
$74,850
APPLICATIONS APPROVED, NOT ACCEPTED
0
$0
12
$137,358
46
$128,880
6
$25,082
4
$51,768
APPLICATIONS DENIED
0
$0
18
$67,827
135
$115,846
39
$36,124
6
$114,767
APPLICATIONS WITHDRAWN
2
$76,100
10
$106,961
82
$110,730
9
$52,898
6
$97,160
FILES CLOSED FOR INCOMPLETENESS
0
$0
9
$79,641
14
$82,327
2
$32,740
2
$37,165
Aggregated Statistics For Year 2002 (Based on 4 partial tracts)
A) FHA, FSA/RHS & VA Home Purchase Loans
B) Conventional Home Purchase Loans
C) Refinancings
D) Home Improvement Loans
F) Non-occupant Loans on < 5 Family Dwellings (A B C & D)
Number
Average Value
Number
Average Value
Number
Average Value
Number
Average Value
Number
Average Value
LOANS ORIGINATED
14
$105,809
74
$105,197
110
$99,662
9
$31,179
10
$60,649
APPLICATIONS APPROVED, NOT ACCEPTED
4
$46,458
15
$126,663
30
$82,864
2
$8,850
0
$0
APPLICATIONS DENIED
0
$0
22
$103,210
77
$104,669
13
$41,996
0
$0
APPLICATIONS WITHDRAWN
2
$76,985
3
$39,857
63
$88,251
2
$8,850
2
$72,255
FILES CLOSED FOR INCOMPLETENESS
0
$0
4
$56,868
7
$138,161
0
$0
0
$0
Aggregated Statistics For Year 2001 (Based on 4 partial tracts)
A) FHA, FSA/RHS & VA Home Purchase Loans
B) Conventional Home Purchase Loans
C) Refinancings
D) Home Improvement Loans
F) Non-occupant Loans on < 5 Family Dwellings (A B C & D)
Number
Average Value
Number
Average Value
Number
Average Value
Number
Average Value
Number
Average Value
LOANS ORIGINATED
13
$83,674
38
$83,574
107
$83,316
9
$13,766
16
$54,736
APPLICATIONS APPROVED, NOT ACCEPTED
0
$0
4
$62,478
29
$102,738
0
$0
0
$0
APPLICATIONS DENIED
0
$0
10
$84,279
96
$85,751
19
$21,579
4
$45,162
APPLICATIONS WITHDRAWN
2
$69,020
5
$134,506
86
$110,432
2
$39,835
0
$0
FILES CLOSED FOR INCOMPLETENESS
0
$0
2
$126,540
19
$108,164
0
$0
0
$0
Aggregated Statistics For Year 2000 (Based on 4 partial tracts)
A) FHA, FSA/RHS & VA Home Purchase Loans
B) Conventional Home Purchase Loans
C) Refinancings
D) Home Improvement Loans
F) Non-occupant Loans on < 5 Family Dwellings (A B C & D)
Number
Average Value
Number
Average Value
Number
Average Value
Number
Average Value
Number
Average Value
LOANS ORIGINATED
13
$84,031
35
$63,758
46
$91,801
9
$27,150
2
$34,510
APPLICATIONS APPROVED, NOT ACCEPTED
2
$107,075
8
$110,319
16
$124,198
5
$32,918
4
$146,982
APPLICATIONS DENIED
5
$83,606
27
$56,683
70
$76,367
12
$15,436
8
$107,850
APPLICATIONS WITHDRAWN
2
$96,705
6
$43,140
19
$95,618
0
$0
6
$127,047
FILES CLOSED FOR INCOMPLETENESS
2
$107,075
0
$0
14
$77,303
0
$0
2
$51,515
Aggregated Statistics For Year 1999 (Based on 2 partial tracts)
A) FHA, FSA/RHS & VA Home Purchase Loans
B) Conventional Home Purchase Loans
C) Refinancings
D) Home Improvement Loans
F) Non-occupant Loans on < 5 Family Dwellings (A B C & D)
Detailed PMIC statistics for the following Tracts:0075.00
, 0076.00
2006 - 2018 National Fire Incident Reporting System (NFIRS) incidents
According to the data from the years 2006 - 2018 the average number of fires per year is 56. The highest number of fire incidents - 86 took place in 2007, and the least - 14 in 2006. The data has a growing trend.
When looking into fire subcategories, the most incidents belonged to: Outside Fires (48.8%), and Mobile Property/Vehicle Fires (32.6%).
Fire incident types reported to NFIRS in Zip Code 93609


+$3,818
-$7,562
(% of AGI for various income ranges: 0.5% for AGIs $10k-25k, -0.6% for AGIs $25k-50k, 1.8% for AGIs $50k-75k, 1.8% for AGIs over 100k)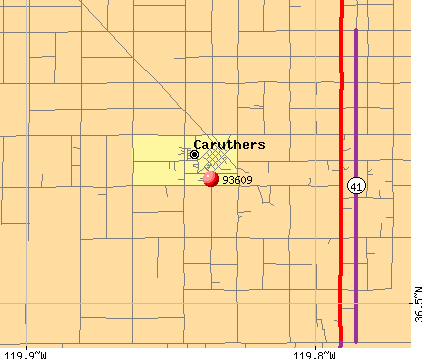 Nearest zip codes: 93652, 93656, 93706, 93242, 93725, 93627.


 According to the data from the years 2006 - 2018 the average number of fires per year is 56. The highest number of fire incidents - 86 took place in 2007, and the least - 14 in 2006. The data has a growing trend.
 When looking into fire subcategories, the most incidents belonged to: Outside Fires (48.8%), and Mobile Property/Vehicle Fires (32.6%).