Estimated zip code population in 2022: 6,227 Zip code population in 2010: 5,255 Zip code population in 2000: 5,704
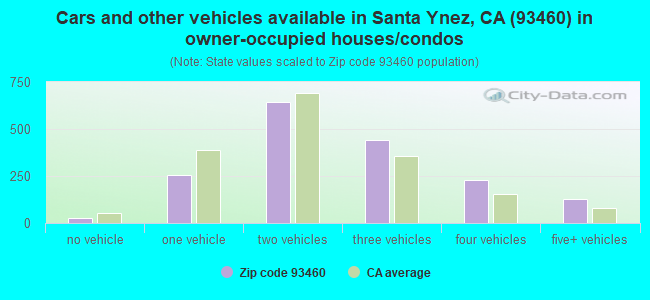
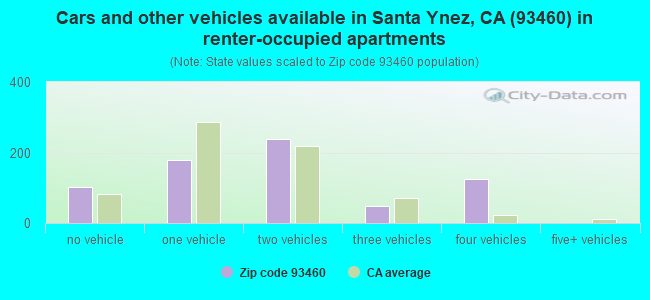
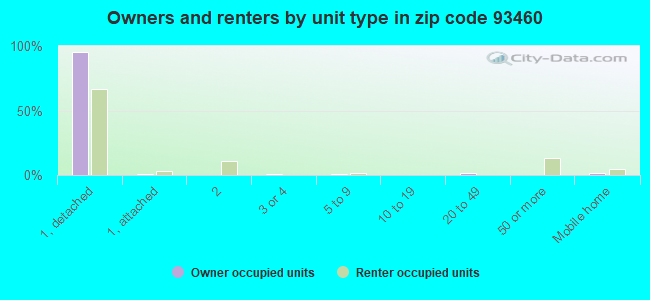
Houses and condos: 2,745 Renter-occupied apartments: 694
% of renters here:
29%
State:
44%
March 2022 cost of living index in zip code 93460: 114.3 (more than average, U.S. average is 100)
Land area: 123.4 sq. mi. Water area: 1.1 sq. mi.
Population density: 50 people per square mile
(very low).
OSM Map
General Map
Google Map
MSN Map
OSM Map
General Map
Google Map
MSN Map
OSM Map
General Map
Google Map
MSN Map
OSM Map
General Map
Google Map
MSN Map
Please wait while loading the map...
Real estate property taxes paid for housing units in 2022:
This zip code:
0.8% ($10,292)
California:
0.7% ($4,831)
Median real estate property taxes paid for housing units with mortgages in 2022: $10,330 (0.8%) Median real estate property taxes paid for housing units with no mortgage in 2022: $10,572 (0.9%)
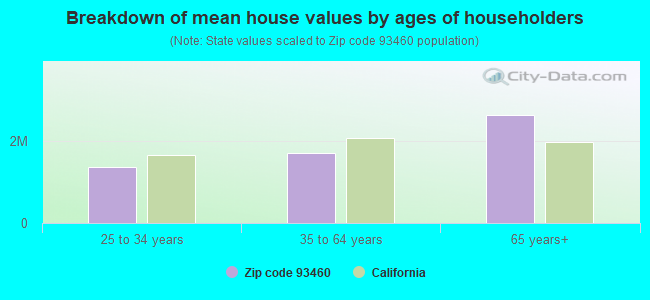
Estimated median house/condo value in 2022: $1,239,496
93460:
$1,239,496
California:
$715,900
According to our research of California and other state lists, there was 1 registered sex offender living in 93460 zip code as of May 09, 2024. The ratio of all residents to sex offenders in zip code 93460 is 4,866 to 1. The ratio of registered sex offenders to all residents in this zip code is much lower than the state average.
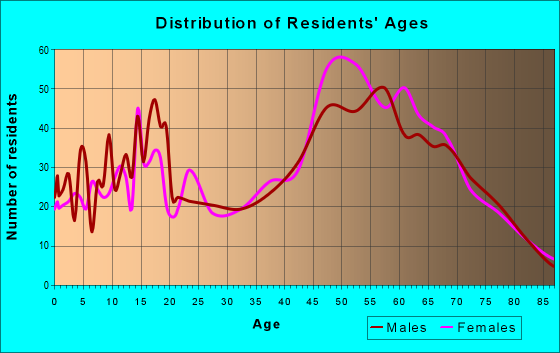
Median resident age:
This zip code:
45.6 years
California median age:
37.9 years
Average household size:
This zip code:
2.5 people
California:
2.8 people
Averages for the 2020 tax year for zip code 93460, filed in 2021:
Average Adjusted Gross Income (AGI) in 2020: $168,213 (Individual Income Tax Returns)
Here:
$168,213
State:
$95,910
Salary/wage: $93,921 (reported on 69.1% of returns)
Here:
$93,921
State:
$77,331
(% of AGI for various income ranges: 1423.4% for AGIs below $25k, 4298.3% for AGIs $25k-50k, 8358.8% for AGIs $50k-75k, 11612.0% for AGIs $75k-100k, 20231.9% for AGIs $100k-200k, 96941.0% for AGIs over 200k)
Taxable interest for individuals: $3,802 (reported on 46.8% of returns)
This zip code:
$3,802
California:
$2,294
(% of AGI for various income ranges: 44.9% for AGIs below $25k, 61.7% for AGIs $25k-50k, 48.1% for AGIs $50k-75k, 182.0% for AGIs $75k-100k, 493.3% for AGIs $100k-200k, 3354.0% for AGIs over 200k)
Ordinary dividends: $18,299 (reported on 31.9% of returns)
Here:
$18,299
State:
$10,949
(% of AGI for various income ranges: 88.8% for AGIs below $25k, 222.3% for AGIs $25k-50k, 417.5% for AGIs $50k-75k, 1016.0% for AGIs $75k-100k, 1059.0% for AGIs $100k-200k, 11530.0% for AGIs over 200k)
Net capital gain/loss in AGI: +$76,317 (reported on 32.6% of returns)
Here:
+$76,317
State:
+$49,306
(% of AGI for various income ranges: 33.7% for AGIs below $25k, 139.7% for AGIs $25k-50k, 301.2% for AGIs $50k-75k, 724.0% for AGIs $75k-100k, 1800.5% for AGIs $100k-200k, 64668.0% for AGIs over 200k)
Profit/loss from business: +$25,462 (reported on 25.2% of returns)
Here:
+$25,462
State:
+$15,671
(% of AGI for various income ranges: 312.2% for AGIs below $25k, 699.0% for AGIs $25k-50k, 1028.1% for AGIs $50k-75k, 1722.0% for AGIs $75k-100k, 2417.1% for AGIs $100k-200k, 6258.0% for AGIs over 200k)
Taxable individual retirement arrangement distribution: $32,582 (reported on 12.1% of returns)
93460:
$32,582
California:
$23,505
(% of AGI for various income ranges: 53.7% for AGIs below $25k, 164.0% for AGIs $25k-50k, 287.5% for AGIs $50k-75k, 667.0% for AGIs $75k-100k, 1378.6% for AGIs $100k-200k, 6344.0% for AGIs over 200k)
Self-employed (Keogh) retirement plans: $34,467 (reported on 2.1% of returns)
93460:
$34,467
California:
$30,163
(% of AGI for various income ranges: 637.0% for AGIs $75k-100k, 1431.0% for AGIs over 200k)
Total itemized deductions: $56,173 (reported on 26.6% of returns)
Here:
$56,173
State:
$39,517
(% of AGI for various income ranges: 407.1% for AGIs below $25k, 498.0% for AGIs $25k-50k, 1389.4% for AGIs $50k-75k, 2070.0% for AGIs $75k-100k, 3955.2% for AGIs $100k-200k, 26368.0% for AGIs over 200k)
Charity contributions: $17,705 (reported on 21.3% of returns)
Here:
$17,705
State:
$12,598
(% of AGI for various income ranges: 14.1% for AGIs below $25k, 27.7% for AGIs $25k-50k, 180.6% for AGIs $50k-75k, 163.0% for AGIs $75k-100k, 439.0% for AGIs $100k-200k, 9108.0% for AGIs over 200k)
Taxes paid: $8,756 (reported on 26.6% of returns)
93460:
$8,756
State:
$8,807
(% of AGI for various income ranges: 60.5% for AGIs below $25k, 83.3% for AGIs $25k-50k, 316.2% for AGIs $50k-75k, 519.0% for AGIs $75k-100k, 1030.0% for AGIs $100k-200k, 2881.0% for AGIs over 200k)
Earned income credit: $1,880 (reported on 8.9% of returns)
Here:
$1,880
State:
$2,074
(% of AGI for various income ranges: 62.2% for AGIs below $25k, 71.7% for AGIs $25k-50k)
Percentage of individuals using paid preparers for their 2020 taxes: 92.6%
Here:
93%
State:
92%
(% for various income ranges: 91.9% for AGIs below $25k, 92.6% for AGIs $25k-50k, 90.9% for AGIs $50k-75k, 95.7% for AGIs $75k-100k, 92.6% for AGIs $100k-200k, 93.2% for AGIs over 200k)
Averages for the 2012 tax year for zip code 93460, filed in 2013:
Average Adjusted Gross Income (AGI) in 2012: $137,829 (Individual Income Tax Returns)
Here:
$137,829
State:
$72,726
Salary/wage: $65,070 (reported on 70.4% of returns)
Here:
$65,070
State:
$59,079
(% of AGI for various income ranges: 66.8% for AGIs below $25k, 72.3% for AGIs $25k-50k, 61.8% for AGIs $50k-75k, 53.4% for AGIs $75k-100k, 58.7% for AGIs $100k-200k, 18.3% for AGIs over 200k)
Taxable interest for individuals: $5,227 (reported on 45.4% of returns)
This zip code:
$5,227
California:
$2,146
(% of AGI for various income ranges: 2.3% for AGIs below $25k, 1.3% for AGIs $25k-50k, 1.7% for AGIs $50k-75k, 1.1% for AGIs $75k-100k, 1.8% for AGIs $100k-200k, 1.8% for AGIs over 200k)
Ordinary dividends: $13,720 (reported on 30.3% of returns)
Here:
$13,720
State:
$9,308
(% of AGI for various income ranges: 4.3% for AGIs below $25k, 2.5% for AGIs $25k-50k, 3.0% for AGIs $50k-75k, 3.2% for AGIs $75k-100k, 4.3% for AGIs $100k-200k, 2.7% for AGIs over 200k)
Net capital gain/loss in AGI: +$39,404 (reported on 28.2% of returns)
Here:
+$39,404
State:
+$30,460
(% of AGI for various income ranges: 0.1% for AGIs $25k-50k, 2.2% for AGIs $50k-75k, 1.7% for AGIs $75k-100k, 3.1% for AGIs $100k-200k, 11.3% for AGIs over 200k)
Profit/loss from business: +$26,035 (reported on 26.1% of returns)
Here:
+$26,035
State:
+$17,064
(% of AGI for various income ranges: 17.1% for AGIs below $25k, 8.7% for AGIs $25k-50k, 10.8% for AGIs $50k-75k, 11.1% for AGIs $75k-100k, 7.0% for AGIs $100k-200k, 2.6% for AGIs over 200k)
Taxable individual retirement arrangement distribution: $24,708 (reported on 13.7% of returns)
93460:
$24,708
California:
$19,557
(% of AGI for various income ranges: 3.3% for AGIs below $25k, 2.2% for AGIs $25k-50k, 3.6% for AGIs $50k-75k, 5.6% for AGIs $75k-100k, 2.9% for AGIs $100k-200k, 2.0% for AGIs over 200k)
Self-employment retirement plans: $18,333 (reported on 2.1% of returns)
93460:
$18,333
California:
$24,530
Total itemized deductions: $64,067 (26% of AGI, reported on 47.2% of returns)
Here:
$64,067
State:
$34,004
Here:
25.7% of AGI
State:
22.7% of AGI
(% of AGI for various income ranges: 23.0% for AGIs below $25k, 15.4% for AGIs $25k-50k, 19.8% for AGIs $50k-75k, 24.5% for AGIs $75k-100k, 23.5% for AGIs $100k-200k, 22.0% for AGIs over 200k)
Charity contributions: $8,409 (reported on 38.7% of returns)
Here:
$8,409
State:
$4,659
(% of AGI for various income ranges: 1.1% for AGIs below $25k, 1.0% for AGIs $25k-50k, 1.1% for AGIs $50k-75k, 1.8% for AGIs $75k-100k, 2.2% for AGIs $100k-200k, 2.7% for AGIs over 200k)
Taxes paid: $26,453 (reported on 46.8% of returns)
93460:
$26,453
State:
$14,448
(% of AGI for various income ranges: 4.8% for AGIs below $25k, 4.1% for AGIs $25k-50k, 5.8% for AGIs $50k-75k, 7.0% for AGIs $75k-100k, 9.1% for AGIs $100k-200k, 10.0% for AGIs over 200k)
Earned income credit: $1,828 (reported on 11.3% of returns)
Here:
$1,828
State:
$2,286
(% of AGI for various income ranges: 3.7% for AGIs below $25k, 1.0% for AGIs $25k-50k)
Percentage of individuals using paid preparers for their 2012 taxes: 67.3%
Here:
67%
State:
64%
(% for various income ranges: 57.3% for AGIs below $25k, 66.1% for AGIs $25k-50k, 68.6% for AGIs $50k-75k, 65.4% for AGIs $75k-100k, 71.1% for AGIs $100k-200k, 90.9% for AGIs over 200k)
Averages for the 2004 tax year for zip code 93460, filed in 2005:
Average Adjusted Gross Income (AGI) in 2004: $89,656 (Individual Income Tax Returns)
Here:
$89,656
State:
$58,600
Salary/wage: $58,206 (reported on 71.1% of returns)
Here:
$58,206
State:
$49,455
(% of AGI for various income ranges: 69.0% for AGIs $10k-25k, 71.0% for AGIs $25k-50k, 60.1% for AGIs $50k-75k, 62.3% for AGIs $75k-100k, 34.3% for AGIs over 100k)
Taxable interest for individuals: $5,188 (reported on 57.4% of returns)
This zip code:
$5,188
California:
$2,365
(% of AGI for various income ranges: 3.4% for AGIs $10k-25k, 2.3% for AGIs $25k-50k, 2.8% for AGIs $50k-75k, 2.8% for AGIs $75k-100k, 2.8% for AGIs over 100k)
Taxable dividends: $12,643 (reported on 38.5% of returns)
Here:
$12,643
State:
$4,746
(% of AGI for various income ranges: 3.6% for AGIs $10k-25k, 3.1% for AGIs $25k-50k, 3.6% for AGIs $50k-75k, 2.7% for AGIs $75k-100k, 5.2% for AGIs over 100k)
Net capital gain/loss: +$40,824 (reported on 35.0% of returns)
Here:
+$40,824
State:
+$23,418
(% of AGI for various income ranges: -0.1% for AGIs $10k-25k, 1.3% for AGIs $25k-50k, 2.8% for AGIs $50k-75k, 1.8% for AGIs $75k-100k, 19.3% for AGIs over 100k)
Profit/loss from business: +$25,159 (reported on 26.0% of returns)
Here:
+$25,159
State:
+$16,826
(% of AGI for various income ranges: 14.7% for AGIs $10k-25k, 9.6% for AGIs $25k-50k, 11.5% for AGIs $50k-75k, 10.7% for AGIs $75k-100k, 5.1% for AGIs over 100k)
IRA payment deduction: $3,854 (reported on 5.3% of returns)
93460:
$3,854
California:
$3,192
(% of AGI for various income ranges: 0.3% for AGIs $10k-25k, 0.6% for AGIs $25k-50k, 0.7% for AGIs $50k-75k, 0.4% for AGIs $75k-100k, 0.1% for AGIs over 100k)
Self-employed pension: $19,330 (reported on 3.6% of returns)
Here:
$19,330
California:
$17,688
(% of AGI for various income ranges: 1.2% for AGIs $10k-25k, 0.8% for AGIs $50k-75k, 1.0% for AGIs $75k-100k, 0.7% for AGIs over 100k)
Total itemized deductions: $40,354 (24% of AGI, reported on 47.5% of returns)
Here:
$40,354
State:
$28,113
Here:
24.4% of AGI
State:
25.3% of AGI
(% of AGI for various income ranges: 24.4% for AGIs $10k-25k, 20.3% for AGIs $25k-50k, 27.7% for AGIs $50k-75k, 28.6% for AGIs $75k-100k, 17.6% for AGIs over 100k)
Charity contributions deductions: $5,328 (3% of AGI, reported on 42.8% of returns)
Here:
$5,328
State:
$3,923
Here:
3.1% of AGI
State:
3.3% of AGI
(% of AGI for various income ranges: 1.7% for AGIs $10k-25k, 1.4% for AGIs $25k-50k, 2.2% for AGIs $50k-75k, 2.4% for AGIs $75k-100k, 2.5% for AGIs over 100k)
Total tax: $20,709 (reported on 78.8% of returns)
93460:
$20,709
State:
$10,761
(% of AGI for various income ranges: 5.1% for AGIs $10k-25k, 7.5% for AGIs $25k-50k, 9.5% for AGIs $50k-75k, 10.0% for AGIs $75k-100k, 20.0% for AGIs over 100k)
Earned income credit: $1,504 (reported on 9.3% of returns)
Here:
$1,504
State:
$1,763
Percentage of individuals using paid preparers for their 2004 taxes: 72.5%
Here:
73%
State:
66%
(% for various income ranges: 59.7% for AGIs below $10k, 71.8% for AGIs $10k-25k, 71.9% for AGIs $25k-50k, 74.3% for AGIs $50k-75k, 78.9% for AGIs $75k-100k, 81.2% for AGIs over 100k)
Likely homosexual households (counted as self-reported same-sex unmarried-partner households)
Lesbian couples: 0.0% of all households
Gay men: 0.7% of all households
Household received Food Stamps/SNAP in the past 12 months: 31 Household did not receive Food Stamps/SNAP in the past 12 months: 2,337
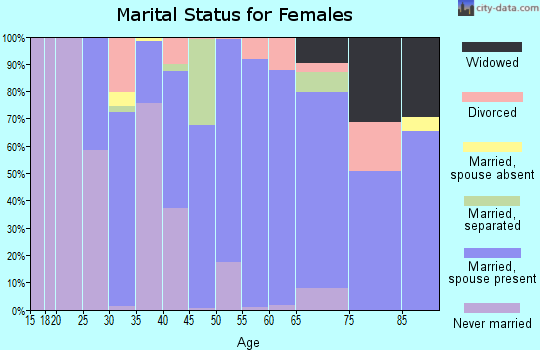
Women who had a birth in the past 12 months: 57 (0 now married, 58 unmarried) Women who did not have a birth in the past 12 months: 1,032 (510 now married, 518 unmarried)
Housing units in zip code 93460 with a mortgage: 1,021 (141 second mortgage, 90 both second mortgage and home equity loan) Houses without a mortgage: 4
Median monthly owner costs for units with a mortgage: $3,639 Median monthly owner costs for units without a mortgage: $1,189
Residents with income below the poverty level in 2022:
This zip code:
12.7%
Whole state:
12.2%
Residents with income below 50% of the poverty level in 2022:
This zip code:
3.3%
Whole state:
6.2%
Median number of rooms in houses and condos:
Here:
6.5
State:
6.0
Median number of rooms in apartments:
Here:
4.5
State:
3.9
Notable locations in this zip code not listed on our city pages
Creeks: Lisque Creek (A), Alamo Pintado Creek (B), Calabazal Creek (C), Figueroa Creek (D), Santa Agueda Creek (E), Quiota Creek (F), Zanja de Cota Creek (G). Display/hide their locations on the map
690 married couples with children.
276 single-parent households (222 men, 54 women).
79.1% of residents of 93460 zip code speak English at home.
14.2% of residents speak Spanish at home (48% very well, 12% well, 24% not well, 16% not at all).
3.8% of residents speak other Indo-European language at home (100% very well).
1.7% of residents speak Asian or Pacific Island language at home (82% very well, 1% well, 17% not well).
0.9% of residents speak other language at home (91% very well, 7% well, 2% not well).
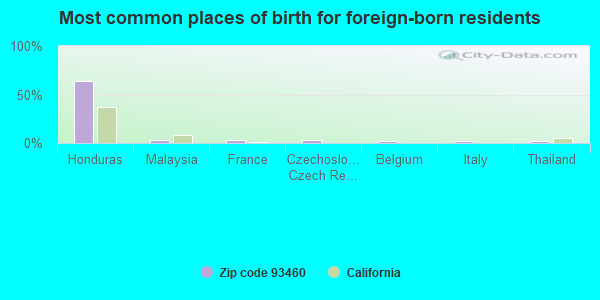
Foreign born population: 1,027 (16.5%) (50.3% of them are naturalized citizens)
This zip code:
16.5%
Whole state:
26.7%
64%Honduras
3%Malaysia
3%France
3%Czechoslovakia (includes Czech Republic and Slovakia)
2%Belgium
2%Italy
2%Thailand
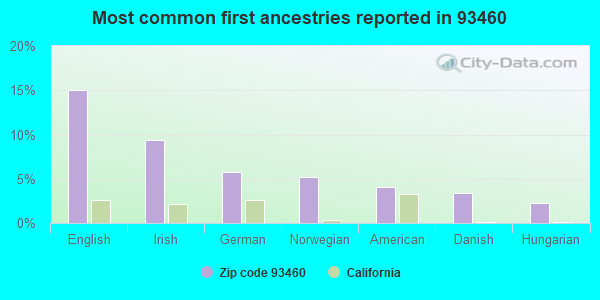
15%English
9%Irish
6%German
5%Norwegian
4%American
3%Danish
2%Hungarian
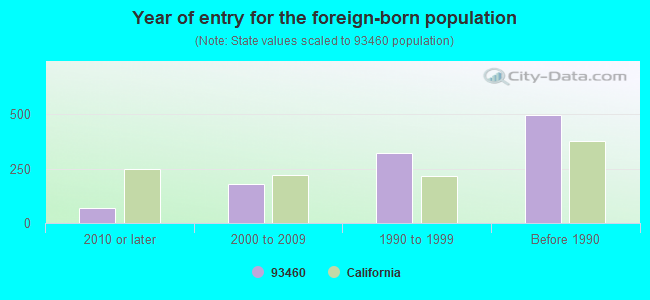
Year of entry for the foreign-born population
682010 or later
1792000 to 2009
3221990 to 1999
496Before 1990
Facilities with environmental interests located in this zip code:
BALLARD CANYON ROAD (W OF CHALK HILL RD in SANTA YNEZ, CA)
CRITERIA AND HAZARDOUS AIR POLLUTANT INVENTORY (Inventory of air pollution sources) Business SIC classification: REFUSE SYSTEMS Business NAICS classification: SOLID WASTE LANDFILL.
Housing units lacking complete plumbing facilities: 1.0% Housing units lacking complete kitchen facilities: 2.8%
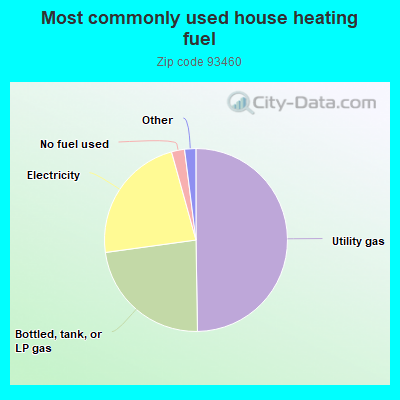
49.8%Utility gas
23.1%Bottled, tank, or LP gas
22.9%Electricity
2.3%No fuel used
0.7%Wood
0.7%Solar energy
Population in 1990: 5,659. Population change in the 1990s: +45 (+0.8%).
Place of birth for U.S.-born residents:
This state: 3,917
Northeast: 170
Midwest: 480
South: 179
West: 355
60% of the 93460 zip code residents lived in the same house 5 years ago. Out of people who lived in different houses, 63% lived in this county. Out of people who lived in different counties, 50% lived in California.
90% of the 93460 zip code residents lived in the same house 1 year ago. Out of people who lived in different houses, 28% moved from this county. Out of people who lived in different houses, 30% moved from different county within same state. Out of people who lived in different houses, 37% moved from different state. Out of people who lived in different houses, 9% moved from abroad.
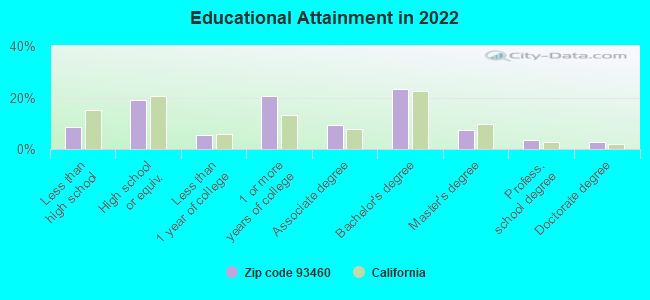
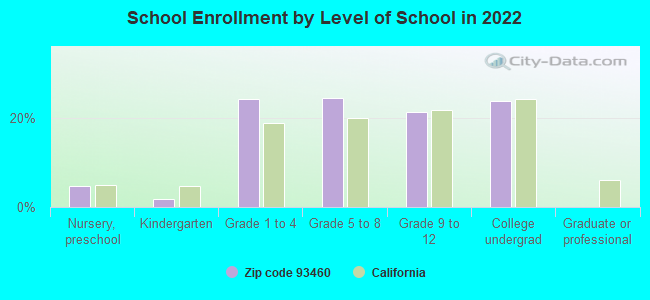
Private vs. public school enrollment:
Students in private schools in grades 1 to 8 (elementary and middle school): 102
Here:
15.9%
California:
10.5%
Students in private schools in grades 9 to 12 (high school): 33
Here:
12.1%
California:
8.5%
Students in private undergraduate colleges: 124
Here:
39.4%
California:
15.9%
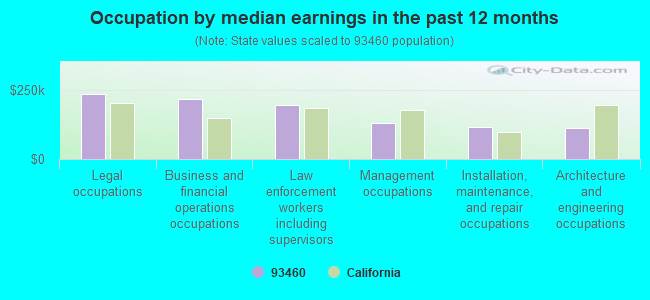
Occupation by median earnings in the past 12 months ($)
237,352Legal occupations
217,588Business and financial operations occupations
196,644Law enforcement workers including supervisors
129,733Management occupations
116,278Installation, maintenance, and repair occupations
112,085Architecture and engineering occupations
Companies with federal contracts located in this zip code:
KUNKLE CONSTRUCTION (3900 AIRPORT RD in SANTA YNEZ, CA) 2 employees, $87000 revenue: $500,000 in 8 contractsfrom 1999 to 2002
Contracts for Lease or Rental of Facilities -- Other Airfield Structures by Immigration and Naturalization Service Signed by year:2000: $168,000; 2001: $81,000; 2002: $170,000; 2003: $0; 2004: $0; 2005: $0; 2006: $0.
Biggest contracts:
$89,000 with Immigration and Naturalization Service for Lease or Rental of Facilities -- Other Airfield Structures. Signed on 2002-10-15. Completion date: 2003-09-15.
$88,000, same as above.Signed on 2000-10-15. Completion date: 2001-09-15.
$81,000, same as above.Signed on 2002-09-15. Completion date: 2003-09-15.
$81,000, same as above.Signed on 2001-09-15. Completion date: 2002-09-15.
SANTA YNEZ BAND OF MISSION IND (POST OFFICE 539 in SANTA YNEZ, CA) : $24,295 in 5 contractsfrom 2003 to 2004
Contracts for General Health Care Services by Public Health Service Signed by year:2000: $0; 2001: $0; 2002: $0; 2003: -$5,707; 2004: $30,002; 2005: $0; 2006: $0.
Biggest contracts:
$18,020 with Public Health Service for General Health Care Services. Signed on 2004-01-28. Completion date: 2004-09-29.
$11,758, same as above.Signed on 2004-07-30. Completion date: 2004-09-29.
$4,863, same as above.Signed on 2003-12-08. Completion date: 2004-04-29.
$224, same as above.Signed on 2004-03-16. Completion date: 2004-09-29.
SANTA YNEZ BAND OF MISSION IND (HWY 246 in SANTA YNEZ, CA) : $0 in 3 contractsfrom 2001 to 2004
$0 with Public Health Service for General Health Care Services. Signed on 2004-03-08. Completion date: 1997-09-30.
$0, same as above.Signed on 2001-06-06. Completion date: 1994-09-30.
$0, same as above.Signed on 2001-06-06. Completion date: 1994-09-30.
Top industries in this zip code by the number of employees in 2005:
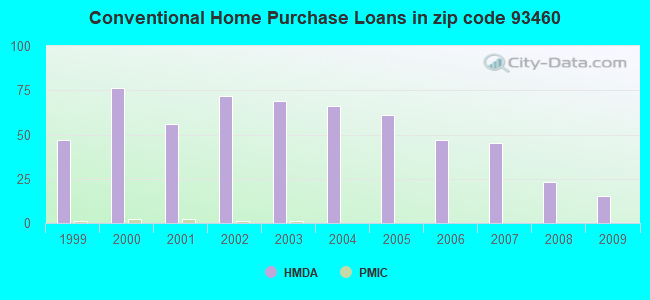
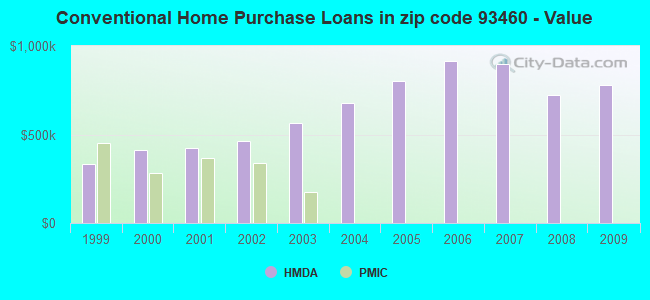
Detailed PMIC statistics for the following Tracts:0019.05
, 0019.06
2005 - 2018 National Fire Incident Reporting System (NFIRS) incidents
According to the data from the years 2005 - 2018 the average number of fires per year is 13. The highest number of reported fire incidents - 37 took place in 2005, and the least - 0 in 2006. The data has a dropping trend.
When looking into fire subcategories, the most incidents belonged to: Outside Fires (60.9%), and Structure Fires (21.2%).
Fire incident types reported to NFIRS in Zip Code 93460


 Nearest zip codes: 93441, 93463, 93117, 93427, 93440, 93105.


 According to the data from the years 2005 - 2018 the average number of fires per year is 13. The highest number of reported fire incidents - 37 took place in 2005, and the least - 0 in 2006. The data has a dropping trend.
 When looking into fire subcategories, the most incidents belonged to: Outside Fires (60.9%), and Structure Fires (21.2%).