Estimated zip code population in 2022: 18,014 Zip code population in 2010: 17,370 Zip code population in 2000: 16,470
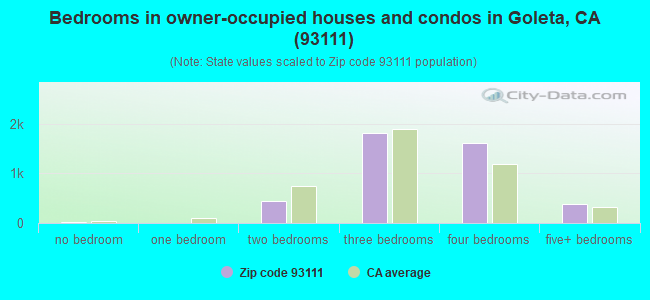
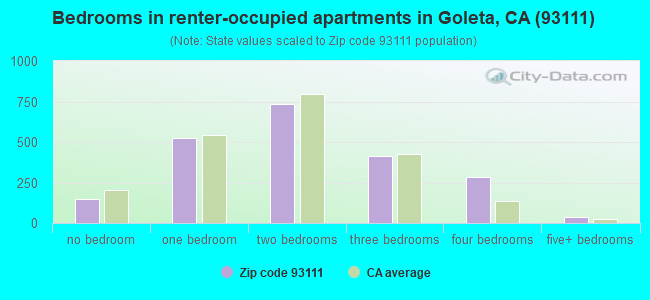
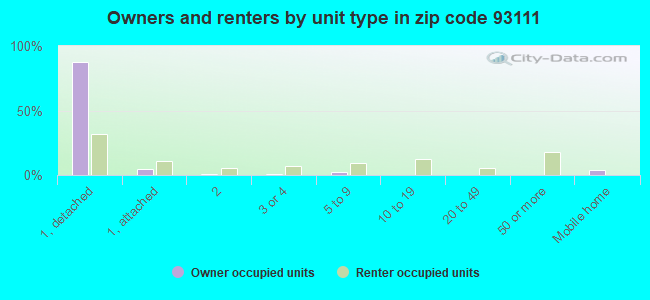
Houses and condos: 6,830 Renter-occupied apartments: 2,132
% of renters here:
33%
State:
44%
March 2022 cost of living index in zip code 93111: 115.0 (more than average, U.S. average is 100)
Land area: 8.1 sq. mi. Water area: 0.1 sq. mi.
Population density: 2,223 people per square mile
(low).
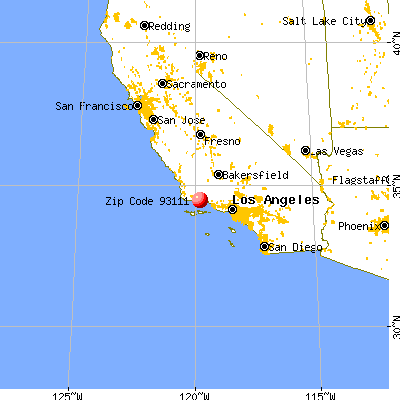
OSM Map
General Map
Google Map
MSN Map
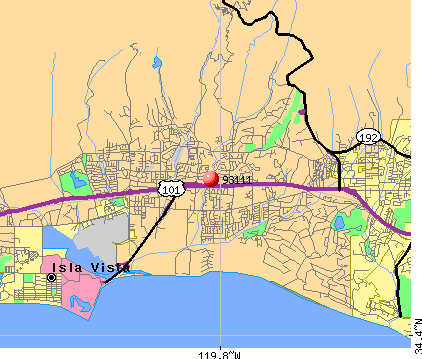
OSM Map
General Map
Google Map
MSN Map
OSM Map
General Map
Google Map
MSN Map
OSM Map
General Map
Google Map
MSN Map
Please wait while loading the map...
Real estate property taxes paid for housing units in 2022:
This zip code:
0.6% ($6,973)
California:
0.7% ($4,831)
Median real estate property taxes paid for housing units with mortgages in 2022: $8,445 (0.7%) Median real estate property taxes paid for housing units with no mortgage in 2022: $4,409 (0.4%)
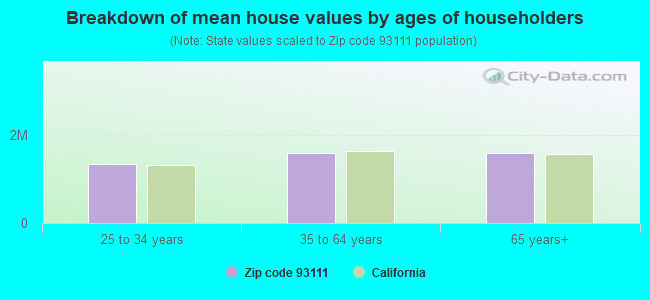
Estimated median house/condo value in 2022: $1,188,244
93111:
$1,188,244
California:
$715,900
According to our research of California and other state lists, there were 13 registered sex offenders living in 93111 zip code as of May 04, 2024. The ratio of all residents to sex offenders in zip code 93111 is 1,439 to 1. The ratio of registered sex offenders to all residents in this zip code is lower than the state average.
Median resident age:
This zip code:
44.2 years
California median age:
37.9 years
Average household size:
This zip code:
2.7 people
California:
2.8 people
Averages for the 2020 tax year for zip code 93111, filed in 2021:
Average Adjusted Gross Income (AGI) in 2020: $129,430 (Individual Income Tax Returns)
Here:
$129,430
State:
$95,910
Salary/wage: $98,128 (reported on 73.4% of returns)
Here:
$98,128
State:
$77,331
(% of AGI for various income ranges: 1275.4% for AGIs below $25k, 4192.3% for AGIs $25k-50k, 7168.3% for AGIs $50k-75k, 10262.8% for AGIs $75k-100k, 19788.2% for AGIs $100k-200k, 91625.0% for AGIs over 200k)
Taxable interest for individuals: $3,389 (reported on 49.4% of returns)
This zip code:
$3,389
California:
$2,294
(% of AGI for various income ranges: 36.1% for AGIs below $25k, 49.5% for AGIs $25k-50k, 118.2% for AGIs $50k-75k, 205.5% for AGIs $75k-100k, 485.3% for AGIs $100k-200k, 2317.4% for AGIs over 200k)
Ordinary dividends: $12,552 (reported on 37.6% of returns)
Here:
$12,552
State:
$10,949
(% of AGI for various income ranges: 96.9% for AGIs below $25k, 123.7% for AGIs $25k-50k, 305.8% for AGIs $50k-75k, 571.1% for AGIs $75k-100k, 985.9% for AGIs $100k-200k, 7495.5% for AGIs over 200k)
Net capital gain/loss in AGI: +$50,388 (reported on 35.9% of returns)
Here:
+$50,388
State:
+$49,306
(% of AGI for various income ranges: 37.9% for AGIs below $25k, 121.7% for AGIs $25k-50k, 206.8% for AGIs $50k-75k, 576.4% for AGIs $75k-100k, 1213.2% for AGIs $100k-200k, 40282.1% for AGIs over 200k)
Profit/loss from business: +$25,733 (reported on 20.2% of returns)
Here:
+$25,733
State:
+$15,671
(% of AGI for various income ranges: 183.4% for AGIs below $25k, 328.7% for AGIs $25k-50k, 383.7% for AGIs $50k-75k, 851.9% for AGIs $75k-100k, 1314.7% for AGIs $100k-200k, 6596.6% for AGIs over 200k)
Taxable individual retirement arrangement distribution: $27,674 (reported on 13.4% of returns)
93111:
$27,674
California:
$23,505
(% of AGI for various income ranges: 83.9% for AGIs below $25k, 157.7% for AGIs $25k-50k, 414.6% for AGIs $50k-75k, 715.7% for AGIs $75k-100k, 1520.1% for AGIs $100k-200k, 3413.2% for AGIs over 200k)
Self-employed (Keogh) retirement plans: $25,855 (reported on 2.3% of returns)
93111:
$25,855
California:
$30,163
(% of AGI for various income ranges: 53.9% for AGIs $50k-75k, 113.8% for AGIs $100k-200k, 1141.6% for AGIs over 200k)
Total itemized deductions: $41,541 (reported on 24.5% of returns)
Here:
$41,541
State:
$39,517
(% of AGI for various income ranges: 244.0% for AGIs below $25k, 391.8% for AGIs $25k-50k, 833.7% for AGIs $50k-75k, 1734.7% for AGIs $75k-100k, 3248.8% for AGIs $100k-200k, 12315.8% for AGIs over 200k)
Charity contributions: $10,302 (reported on 20.7% of returns)
Here:
$10,302
State:
$12,598
(% of AGI for various income ranges: 11.7% for AGIs below $25k, 24.9% for AGIs $25k-50k, 66.8% for AGIs $50k-75k, 169.1% for AGIs $75k-100k, 460.2% for AGIs $100k-200k, 3789.7% for AGIs over 200k)
Taxes paid: $8,814 (reported on 24.4% of returns)
93111:
$8,814
State:
$8,807
(% of AGI for various income ranges: 45.4% for AGIs below $25k, 77.0% for AGIs $25k-50k, 167.9% for AGIs $50k-75k, 444.0% for AGIs $75k-100k, 817.1% for AGIs $100k-200k, 2263.9% for AGIs over 200k)
Earned income credit: $1,526 (reported on 6.5% of returns)
Here:
$1,526
State:
$2,074
(% of AGI for various income ranges: 45.3% for AGIs below $25k, 37.0% for AGIs $25k-50k)
Percentage of individuals using paid preparers for their 2020 taxes: 92.8%
Here:
93%
State:
92%
(% for various income ranges: 90.9% for AGIs below $25k, 93.1% for AGIs $25k-50k, 92.7% for AGIs $50k-75k, 92.9% for AGIs $75k-100k, 93.3% for AGIs $100k-200k, 95.0% for AGIs over 200k)
Averages for the 2012 tax year for zip code 93111, filed in 2013:
Average Adjusted Gross Income (AGI) in 2012: $95,839 (Individual Income Tax Returns)
Here:
$95,839
State:
$72,726
Salary/wage: $70,297 (reported on 75.4% of returns)
Here:
$70,297
State:
$59,079
(% of AGI for various income ranges: 70.4% for AGIs below $25k, 71.7% for AGIs $25k-50k, 62.1% for AGIs $50k-75k, 61.6% for AGIs $75k-100k, 66.0% for AGIs $100k-200k, 42.1% for AGIs over 200k)
Taxable interest for individuals: $2,244 (reported on 49.6% of returns)
This zip code:
$2,244
California:
$2,146
(% of AGI for various income ranges: 2.0% for AGIs below $25k, 1.3% for AGIs $25k-50k, 1.6% for AGIs $50k-75k, 1.3% for AGIs $75k-100k, 1.0% for AGIs $100k-200k, 1.1% for AGIs over 200k)
Ordinary dividends: $9,378 (reported on 34.7% of returns)
Here:
$9,378
State:
$9,308
(% of AGI for various income ranges: 3.8% for AGIs below $25k, 2.3% for AGIs $25k-50k, 3.0% for AGIs $50k-75k, 3.2% for AGIs $75k-100k, 3.0% for AGIs $100k-200k, 3.9% for AGIs over 200k)
Net capital gain/loss in AGI: +$15,200 (reported on 30.7% of returns)
Here:
+$15,200
State:
+$30,460
(% of AGI for various income ranges: 0.1% for AGIs $25k-50k, 0.6% for AGIs $50k-75k, 1.2% for AGIs $75k-100k, 2.0% for AGIs $100k-200k, 9.5% for AGIs over 200k)
Profit/loss from business: +$25,269 (reported on 19.7% of returns)
Here:
+$25,269
State:
+$17,064
(% of AGI for various income ranges: 9.9% for AGIs below $25k, 7.2% for AGIs $25k-50k, 6.5% for AGIs $50k-75k, 5.3% for AGIs $75k-100k, 4.4% for AGIs $100k-200k, 4.6% for AGIs over 200k)
Taxable individual retirement arrangement distribution: $23,641 (reported on 16.3% of returns)
93111:
$23,641
California:
$19,557
(% of AGI for various income ranges: 4.7% for AGIs below $25k, 3.5% for AGIs $25k-50k, 5.4% for AGIs $50k-75k, 4.5% for AGIs $75k-100k, 3.5% for AGIs $100k-200k, 3.9% for AGIs over 200k)
Self-employment retirement plans: $19,355 (reported on 2.3% of returns)
93111:
$19,355
California:
$24,530
(% of AGI for various income ranges: 0.5% for AGIs $50k-75k, 0.3% for AGIs $100k-200k, 0.7% for AGIs over 200k)
Total itemized deductions: $37,168 (22% of AGI, reported on 45.5% of returns)
Here:
$37,168
State:
$34,004
Here:
22.1% of AGI
State:
22.7% of AGI
(% of AGI for various income ranges: 16.5% for AGIs below $25k, 13.4% for AGIs $25k-50k, 18.2% for AGIs $50k-75k, 19.8% for AGIs $75k-100k, 21.3% for AGIs $100k-200k, 15.8% for AGIs over 200k)
Charity contributions: $4,632 (reported on 39.8% of returns)
Here:
$4,632
State:
$4,659
(% of AGI for various income ranges: 1.0% for AGIs below $25k, 0.9% for AGIs $25k-50k, 1.6% for AGIs $50k-75k, 1.8% for AGIs $75k-100k, 2.3% for AGIs $100k-200k, 2.0% for AGIs over 200k)
Taxes paid: $15,801 (reported on 45.4% of returns)
93111:
$15,801
State:
$14,448
(% of AGI for various income ranges: 3.1% for AGIs below $25k, 3.0% for AGIs $25k-50k, 4.9% for AGIs $50k-75k, 6.1% for AGIs $75k-100k, 8.6% for AGIs $100k-200k, 8.8% for AGIs over 200k)
Earned income credit: $1,716 (reported on 7.6% of returns)
Here:
$1,716
State:
$2,286
(% of AGI for various income ranges: 2.7% for AGIs below $25k, 0.5% for AGIs $25k-50k)
Percentage of individuals using paid preparers for their 2012 taxes: 59.5%
Here:
59%
State:
64%
(% for various income ranges: 54.9% for AGIs below $25k, 54.2% for AGIs $25k-50k, 62.6% for AGIs $50k-75k, 62.6% for AGIs $75k-100k, 61.9% for AGIs $100k-200k, 74.0% for AGIs over 200k)
Averages for the 2004 tax year for zip code 93111, filed in 2005:
Average Adjusted Gross Income (AGI) in 2004: $83,238 (Individual Income Tax Returns)
Here:
$83,238
State:
$58,600
Salary/wage: $56,974 (reported on 75.9% of returns)
Here:
$56,974
State:
$49,455
(% of AGI for various income ranges: 91.0% for AGIs below $10k, 69.2% for AGIs $10k-25k, 69.4% for AGIs $25k-50k, 62.1% for AGIs $50k-75k, 67.2% for AGIs $75k-100k, 43.7% for AGIs over 100k)
Taxable interest for individuals: $3,234 (reported on 61.7% of returns)
This zip code:
$3,234
California:
$2,365
(% of AGI for various income ranges: 6.2% for AGIs below $10k, 4.7% for AGIs $10k-25k, 2.4% for AGIs $25k-50k, 2.7% for AGIs $50k-75k, 2.2% for AGIs $75k-100k, 2.2% for AGIs over 100k)
Taxable dividends: $5,452 (reported on 41.6% of returns)
Here:
$5,452
State:
$4,746
(% of AGI for various income ranges: 7.2% for AGIs below $10k, 3.7% for AGIs $10k-25k, 2.7% for AGIs $25k-50k, 2.7% for AGIs $50k-75k, 2.5% for AGIs $75k-100k, 2.7% for AGIs over 100k)
Net capital gain/loss: +$47,796 (reported on 36.0% of returns)
Here:
+$47,796
State:
+$23,418
(% of AGI for various income ranges: -1.5% for AGIs below $10k, 0.8% for AGIs $10k-25k, 0.6% for AGIs $25k-50k, 2.2% for AGIs $50k-75k, 2.8% for AGIs $75k-100k, 31.2% for AGIs over 100k)
Profit/loss from business: +$24,440 (reported on 20.2% of returns)
Here:
+$24,440
State:
+$16,826
(% of AGI for various income ranges: 13.4% for AGIs below $10k, 5.8% for AGIs $10k-25k, 6.8% for AGIs $25k-50k, 6.8% for AGIs $50k-75k, 7.7% for AGIs $75k-100k, 5.3% for AGIs over 100k)
IRA payment deduction: $3,285 (reported on 4.0% of returns)
93111:
$3,285
California:
$3,192
(% of AGI for various income ranges: 0.8% for AGIs below $10k, 0.2% for AGIs $10k-25k, 0.4% for AGIs $25k-50k, 0.2% for AGIs $50k-75k, 0.3% for AGIs $75k-100k, 0.1% for AGIs over 100k)
Self-employed pension: $15,602 (reported on 2.9% of returns)
Here:
$15,602
California:
$17,688
(% of AGI for various income ranges: 0.3% for AGIs $25k-50k, 0.3% for AGIs $50k-75k, 0.4% for AGIs $75k-100k, 0.7% for AGIs over 100k)
Total itemized deductions: $30,669 (22% of AGI, reported on 49.4% of returns)
Here:
$30,669
State:
$28,113
Here:
22.5% of AGI
State:
25.3% of AGI
(% of AGI for various income ranges: 35.0% for AGIs below $10k, 18.3% for AGIs $10k-25k, 19.4% for AGIs $25k-50k, 23.7% for AGIs $50k-75k, 24.8% for AGIs $75k-100k, 15.8% for AGIs over 100k)
Charity contributions deductions: $4,078 (3% of AGI, reported on 45.1% of returns)
Here:
$4,078
State:
$3,923
Here:
2.8% of AGI
State:
3.3% of AGI
(% of AGI for various income ranges: 1.5% for AGIs below $10k, 1.5% for AGIs $10k-25k, 1.7% for AGIs $25k-50k, 2.3% for AGIs $50k-75k, 2.5% for AGIs $75k-100k, 2.3% for AGIs over 100k)
Total tax: $14,623 (reported on 82.6% of returns)
93111:
$14,623
State:
$10,761
(% of AGI for various income ranges: 3.9% for AGIs below $10k, 4.8% for AGIs $10k-25k, 7.8% for AGIs $25k-50k, 9.4% for AGIs $50k-75k, 10.4% for AGIs $75k-100k, 17.8% for AGIs over 100k)
Earned income credit: $1,295 (reported on 5.8% of returns)
Here:
$1,295
State:
$1,763
Percentage of individuals using paid preparers for their 2004 taxes: 60.8%
Here:
61%
State:
66%
(% for various income ranges: 48.2% for AGIs below $10k, 56.7% for AGIs $10k-25k, 59.4% for AGIs $25k-50k, 66.5% for AGIs $50k-75k, 67.2% for AGIs $75k-100k, 68.0% for AGIs over 100k)
Likely homosexual households (counted as self-reported same-sex unmarried-partner households)
Lesbian couples: 0.2% of all households
Gay men: 0.0% of all households
Household received Food Stamps/SNAP in the past 12 months: 269 Household did not receive Food Stamps/SNAP in the past 12 months: 6,029
Women who had a birth in the past 12 months: 130 (105 now married, 24 unmarried) Women who did not have a birth in the past 12 months: 3,293 (1,518 now married, 1,766 unmarried)
Housing units in zip code 93111 with a mortgage: 2,559 (301 second mortgage, 5 home equity loan, 268 both second mortgage and home equity loan) Houses without a mortgage: 56
Median monthly owner costs for units with a mortgage: $3,658 Median monthly owner costs for units without a mortgage: $754
Residents with income below the poverty level in 2022:
This zip code:
7.6%
Whole state:
12.2%
Residents with income below 50% of the poverty level in 2022:
This zip code:
2.8%
Whole state:
6.2%
Median number of rooms in houses and condos:
Here:
6.3
State:
6.0
Median number of rooms in apartments:
Here:
4.1
State:
3.9
Notable locations in this zip code not listed on our city pages
Notable locations in zip code 93111: Mores Landing (A), County of Santa Barbara Honor Farm (B), San Jose Winery (C), Joseph Sexton House (D), American Medical Response Station 5 (E), Santa Barbara County Fire Department Station 12 (F). Display/hide their locations on the map
Churches in zip code 93111 include: Christ the King Episcopal Church (A), Community Covenant Church (B), Harvest Christian Fellowship Church (C), Church of Christ (D), Church of Religious Science (E). Display/hide their locations on the map
2,698 married couples with children.
486 single-parent households (48 men, 438 women).
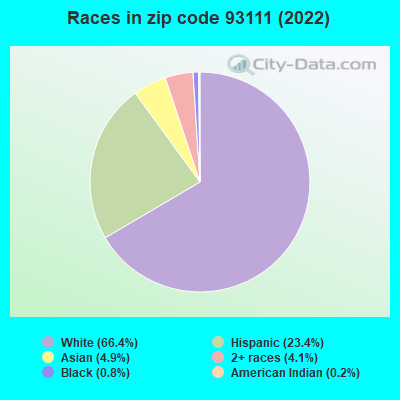
75.8% of residents of 93111 zip code speak English at home.
13.8% of residents speak Spanish at home (69% very well, 18% well, 12% not well, 1% not at all).
6.3% of residents speak other Indo-European language at home (84% very well, 16% well).
3.8% of residents speak Asian or Pacific Island language at home (67% very well, 20% well, 11% not well, 3% not at all).
0.4% of residents speak other language at home (91% very well, 9% well).
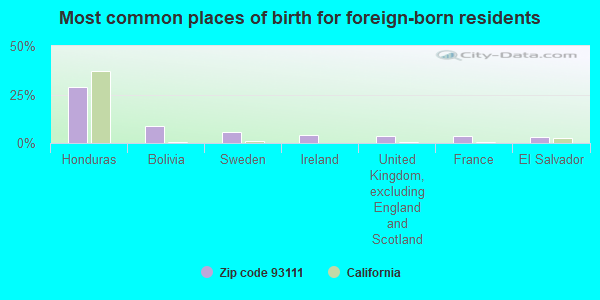
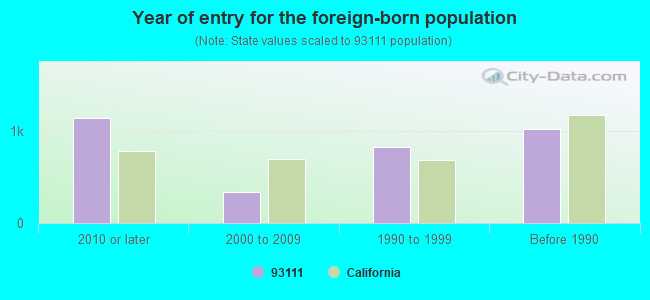
Foreign born population: 2,786 (15.5%) (57.6% of them are naturalized citizens)
Major facilities with environmental interests located in this zip code:
CHANNEL INDUSTRIES INCORPORATED (839 WARD DR. in SANTA BARBARA, CA)
STATE MASTER (California - Hazardous Waste Tracking) - HAZARDOU WASTE PROGRAM (Integrated Compliance Information System) - ICIS-09-1994-0067, FORMAL ENFORCEMENT ACTION COMPLIANCE ACTIVITY (Tracking inspections of insecticide, fungicide, and rodenticide, and toxic substances) CRITERIA AND HAZARDOUS AIR POLLUTANT INVENTORY (Inventory of air pollution sources) Small Quantity Generators, between 100 kg and 1000 kg of hazardous waste/month (Resource Conservation and Recovery Act (tracking hazardous waste)) TRI REPORTER (Tracking of toxic chemicals releasing facilities) Business SIC classification: SEARCH, DETECTION, NAVIGATION, GUIDANCE, AERONAUTICAL, AND NAUTICAL SYSTEMS AND INSTRUMENTS Business NAICS classification: PORCELAIN ELECTRICAL SUPPLY MANUFACTURING.; SEARCH, DETECTION, NAVIGATION, GUIDANCE, AERONAUTICAL, AND NAUTICAL SYSTEM AND INSTRUMENT MANUFACTURING.
MCGHAN MEDICAL CORPORATION (700 WARD DRIVE in SANTA BARBARA, CA)
STATE MASTER (California - Hazardous Waste Tracking) - HAZARDOU WASTE PROGRAM COMPLIANCE ACTIVITY (Tracking inspections of insecticide, fungicide, and rodenticide, and toxic substances) CRITERIA AND HAZARDOUS AIR POLLUTANT INVENTORY (Inventory of air pollution sources) AIR MAJOR ("Best Available" air pollution technologies tracking) HAZARDOUS WASTE BIENNIAL REPORTER (Resource Conservation and Recovery Act (tracking hazardous waste)) (Resource Conservation and Recovery Act (tracking hazardous waste)) TRI REPORTER (Tracking of toxic chemicals releasing facilities) Business SIC classification: ORTHOPEDIC, PROSTHETIC, AND SURGICAL APPLIANCES AND SUPPLIES Business NAICS classification: SURGICAL APPLIANCE AND SUPPLIES MANUFACTURING. Alternative names: MC GHAN MEDICAL CORP, MCGHAN MEDICAL CORP., MCGHAN MEDICAL/THERMAL OXIDIZER PROJECT, MCGHAN MEDICAL/THERMAL OXIDIZER PROJECT
EL CAMINO ELEMENTARY (5020 SAN SIMEON DR. in SANTA BARBARA, CA)
(National Center for Education Statistics) - STATE ID-6045405 Organizations: GOLETA UNION ELEMENTARY (SCHOOL DISTRICT)
FOOTHILL ELEMENTARY (711 RIBERA DR. in SANTA BARBARA, CA)
(National Center for Education Statistics) - STATE ID-6045447 Organizations: GOLETA UNION ELEMENTARY (SCHOOL DISTRICT)
HOLLISTER ELEMENTARY (4950 ANITA LANE in SANTA BARBARA, CA)
(National Center for Education Statistics) - STATE ID-6045462 Organizations: GOLETA UNION ELEMENTARY (SCHOOL DISTRICT)
MOUNTAIN VIEW ELEMENTARY (5465 QUEEN ANNE LANE in SANTA BARBARA, CA)
(National Center for Education Statistics) - STATE ID-6045504 Organizations: GOLETA UNION ELEMENTARY (SCHOOL DISTRICT)
HOWELL PEST CONTROL (600 WARD DRIVE SUITE #A in SANTA BARBARA, CA)
Small Quantity Generators, between 100 kg and 1000 kg of hazardous waste/month (Resource Conservation and Recovery Act (tracking hazardous waste)) - notification Small Quantity Generators, between 100 kg and 1000 kg of hazardous waste/month (Resource Conservation and Recovery Act (tracking hazardous waste)) - notification Organizations: ROBERT HOWELL (CONTACT/OWNER)
, ROBERT L HOWELL (CONTACT/OWNER)
Alternative names: BOB HOWELL PEST CONTROL
EXXONMOBIL OIL CORP. (4801 HOLLISTER AVE. in SANTA BARBARA, CA)
HAZARDOUS WASTE BIENNIAL REPORTER (Resource Conservation and Recovery Act (tracking hazardous waste)) Large Quantity Generators, more that 1000 kg of hazardous waste/month (Resource Conservation and Recovery Act (tracking hazardous waste)) Organizations: EXXONMOBIL OIL CORPORATION (CONTACT/OWNER)
MAHNEKE WEBER AUTO CENTER (5530 DEBBIE RD in SANTA BARBARA, CA)
(Resource Conservation and Recovery Act (tracking hazardous waste)) Organizations: MICHAEL MAHNEKE (CONTACT/OWNER)
, ROBERT WEBER (CONTACT/OWNER)
MAGNOLIA CLEANERS (5144 HOLLISTER AVE in SANTA BARBARA, CA)
Small Quantity Generators, between 100 kg and 1000 kg of hazardous waste/month (Resource Conservation and Recovery Act (tracking hazardous waste)) - notification Organizations: RAMOND SARGENT (CONTACT/OWNER)
MASTER CLEANERS (4425 HOLLISTER AVE in SANTA BARBARA, CA)
Small Quantity Generators, between 100 kg and 1000 kg of hazardous waste/month (Resource Conservation and Recovery Act (tracking hazardous waste))
GRANITE CONSTRUCTION COMPANY (5335 DEBBIE ROAD in SANTA BARBARA, CA)
CRITERIA AND HAZARDOUS AIR POLLUTANT INVENTORY (Inventory of air pollution sources) Business SIC classification: CRUSHED AND BROKEN LIMESTONE
INTERNATIONAL TRANSDUCER CORP (869 WARD DRIVE in SANTA BARBARA, CA)
CRITERIA AND HAZARDOUS AIR POLLUTANT INVENTORY (Inventory of air pollution sources)
Housing units lacking complete plumbing facilities: 0.3% Housing units lacking complete kitchen facilities: 2.9%
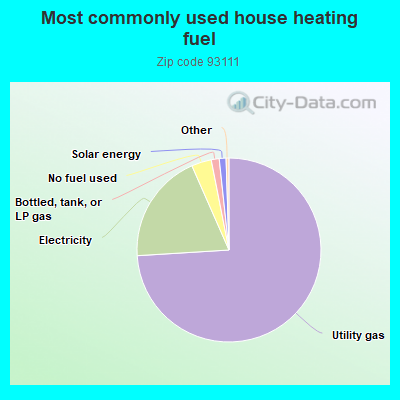
74.1%Utility gas
19.4%Electricity
3.5%No fuel used
1.4%Bottled, tank, or LP gas
1.2%Solar energy
Population in 1990: 17,689.
Place of birth for U.S.-born residents:
This state: 10,293
Northeast: 1,450
Midwest: 1,128
South: 860
West: 961
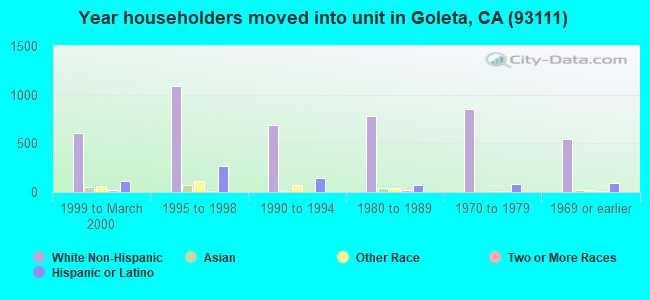
61% of the 93111 zip code residents lived in the same house 5 years ago. Out of people who lived in different houses, 73% lived in this county. Out of people who lived in different counties, 50% lived in California.
91% of the 93111 zip code residents lived in the same house 1 year ago. Out of people who lived in different houses, 64% moved from this county. Out of people who lived in different houses, 21% moved from different county within same state. Out of people who lived in different houses, 11% moved from different state. Out of people who lived in different houses, 4% moved from abroad.
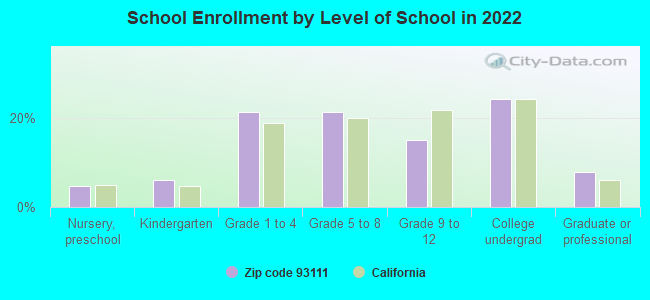
Private vs. public school enrollment:
Students in private schools in grades 1 to 8 (elementary and middle school): 313
Here:
15.7%
California:
10.5%
Students in private schools in grades 9 to 12 (high school): 22
Here:
3.3%
California:
8.5%
Students in private undergraduate colleges: 158
Here:
14.1%
California:
15.9%
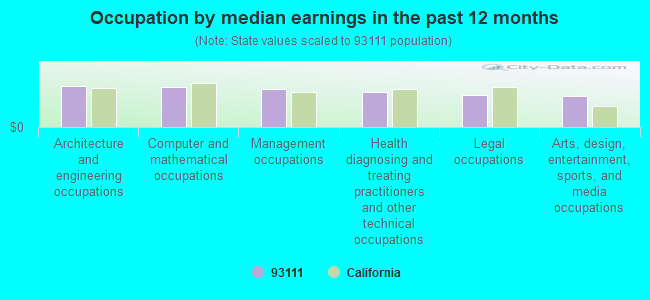
Occupation by median earnings in the past 12 months ($)
114,753Architecture and engineering occupations
114,032Computer and mathematical occupations
106,809Management occupations
99,655Health diagnosing and treating practitioners and other technical occupations
89,314Legal occupations
88,357Arts, design, entertainment, sports, and media occupations
Companies with biggest federal contracts located in this zip code (SANTA BARBARA, CA):
INTERNATIONAL TRANSDUCER CORP (869 WARD DR; small business) : $19,517,888 in 139 contractsfrom 1999 to 2006
Contracts for Maintenance, Repair and Rebuilding of Equipment -- Communication, Detection, and Coherent Radiation Equipment, Miscellaneous Communication Equipment, Demolition Materials, Services -- Engineering Development (R&D), and moreby Navy Signed by year:2000: $1,314,822; 2001: $1,131,739; 2002: $5,580,493; 2003: $5,076,724; 2004: $1,383,183; 2005: $3,029,131; 2006: $1,696,764.
Biggest contracts:
$995,220 with Navy for Maintenance, Repair and Rebuilding of Equipment -- Communication, Detection, and Coherent Radiation Equipment. Signed on 2002-03-13. Completion date: 2003-03-12.
$886,284 with Navy for Miscellaneous Communication Equipment. Signed on 2006-03-29. Completion date: 2007-03-28.
$884,690, same as above.Signed on 2002-03-04. Completion date: 2003-03-04.
$659,775 with Navy for Maintenance, Repair and Rebuilding of Equipment -- Communication, Detection, and Coherent Radiation Equipment. Signed on 2002-12-13. Completion date: 2003-12-13.
TECHNOMICS, INC (5290 OVERPASS ROAD, SUITE; small business) : $13,989,596 in 103 contractsfrom 2000 to 2006
Contracts for Program Management/Support Services, Defense Electronics and Communication Equipment -- Applied Research and Exploratory Development (R&D), Program Evaluation Services, Other ADP and Telecommunications Services (includes data storage on tapes, compact disks, etc.), and moreby Army, Navy, Federal Technology Service, Minerals Management Service, and others Signed by year:2000: $1,126,937; 2001: $699,239; 2002: $2,517,305; 2003: $2,186,915; 2004: $3,139,800; 2005: $2,977,869; 2006: $1,341,531.
Biggest contracts:
$1,414,007 with Army for Program Management/Support Services. Signed on 2005-01-13. Effective on 2005-01-16. Completion date: 2006-01-15.
$928,956, same as above.Signed on 2004-01-15. Completion date: 2006-01-13.
$599,999, same as above.Signed on 2006-02-06. Completion date: 2006-08-02.
$443,046 with Navy for Defense Electronics and Communication Equipment -- Applied Research and Exploratory Development (R&D). Signed on 2001-05-09. Completion date: 2002-05-08.
SONATECH, INC (879 WARD DR; small business) : $9,327,451 in 114 contractsfrom 1999 to 2006
Contracts for Defense Missile and Space Systems -- Engineering Development (R&D), Underwater Sound Equipment, Miscellaneous Electrical and Electronic Components, Environmental Sciences -- Engineering Development (R&D), and moreby Navy, Department of Defense, Defense Logistics Agency Signed by year:2000: $2,745,631; 2001: $977,038; 2002: $362,471; 2003: $1,951,449; 2004: $1,265,024; 2005: $1,015,727; 2006: $583,856.
Biggest contracts:
$942,357 with Navy for Defense Missile and Space Systems -- Engineering Development (R&D). Signed on 2004-02-27. Completion date: 2004-11-30.
$762,686 with Navy for Underwater Sound Equipment. Signed on 2000-01-18. Completion date: 2000-08-29.
$762,686, same as above.Signed on 2000-07-28. Completion date: 2001-01-31.
$761,700 with Navy for Miscellaneous Electrical and Electronic Components. Signed on 2003-12-22. Completion date: 2004-11-01.
AKELA INC (5276 HOLLISTER AVE STE 263; small business) : $7,095,286 in 17 contractsfrom 2000 to 2006
Contracts for Defense Electronics and Communication Equipment -- Basic Research (R&D), Other Defense -- Applied Research and Exploratory Development (R&D), Other Defense -- Advanced Development (R&D), Other Defense -- Basic Research (R&D) by Army, Air Force Signed by year:2000: $768,760; 2001: $0; 2002: $98,763; 2003: $701,073; 2004: $739,920; 2005: $4,299,278; 2006: $487,492.
Biggest contracts:
$2,031,657 with Army for Defense Electronics and Communication Equipment -- Basic Research (R&D). Signed on 2005-12-29. Completion date: 2006-10-30.
$1,617,621, same as above.Signed on 2005-03-31. Completion date: 2006-10-30.
$468,760 with Air Force for Other Defense -- Applied Research and Exploratory Development (R&D). Signed on 2000-11-13. Completion date: 2003-02-10.
$400,000 with Air Force for Other Defense -- Advanced Development (R&D). Signed on 2003-09-03. Completion date: 2005-07-28.
ELECTRO OPTICAL INDUSTRIES INC (859 WARD DRIVE; small business) : $2,756,745 in 60 contractsfrom 2000 to 2006
Contracts for Electrical and Electronic Properties Measuring and Testing Instruments, Guided Missile Maintenance, Repair, and Checkout Specialized Equipment, Optical Instruments, Test Equipment, Components and Accessories, Photographic Projection Equipment, and moreby Army, Navy, Defense Logistics Agency, Air Force, and others Signed by year:2000: $185,625; 2001: $80,645; 2002: $393,360; 2003: $708,836; 2004: $569,788; 2005: $758,251; 2006: $60,240.
Biggest contracts:
$340,000 with Army for Electrical and Electronic Properties Measuring and Testing Instruments. Taking place in AZ. Signed on 2003-08-25. Completion date: 2004-02-25.
$329,655 with Navy for Guided Missile Maintenance, Repair, and Checkout Specialized Equipment. Signed on 2005-06-22. Completion date: 2006-04-28.
$198,000 with Navy for Optical Instruments, Test Equipment, Components and Accessories. Signed on 2005-09-20. Completion date: 2006-02-17.
$139,950 with Navy for Electrical and Electronic Properties Measuring and Testing Instruments. Taking place in MD. Signed on 2004-09-14. Completion date: 2004-10-29.
PROMETHEUS CONSTRUCTION (4990 ANITA LN) : $1,675,449 in 7 contractsfrom 2005 to 2006
Contracts for Maintenance, Repair or Alteration of Real Property -- Other Non-Building Facilities by Army Signed by year:2000: $0; 2001: $0; 2002: $0; 2003: $0; 2004: $0; 2005: $1,555,463; 2006: $119,986.
Biggest contracts:
$1,457,000 with Army for Maintenance, Repair or Alteration of Real Property -- Other Non-Building Facilities. Taking place in HI. Signed on 2005-02-04. Completion date: 2005-09-30.
$57,970, same as above.Signed on 2005-09-30. Completion date: 2005-09-30.
$42,000, same as above.Signed on 2006-05-03. Completion date: 2005-09-30.
$40,091, same as above.Signed on 2006-05-03. Completion date: 2005-09-30.
NANODEVICES, INC (5571 EKWILL STREET; small business) : $921,088 in 6 contractsfrom 1999 to 2002
Contracts for Other Defense -- Applied Research and Exploratory Development (R&D), Laboratory Equipment and Supplies by Army Signed by year:2000: $200,000; 2001: $375,000; 2002: $247,088; 2003: $0; 2004: $0; 2005: $0; 2006: $0.
Biggest contracts:
$375,000 with Army for Other Defense -- Applied Research and Exploratory Development (R&D). Signed on 2001-01-25. Completion date: 2002-12-27.
$166,200, same as above.Signed on 2002-01-15. Completion date: 2002-12-27.
$160,000, same as above.Signed on 2000-09-18. Completion date: 2002-12-27.
$99,000, same as above.Signed on 1999-10-26. Completion date: 2000-06-30.
SOMERA COMMUNICATIONS, INC (5383 HOLLISTER AVENUE; small business) : $666,923 in 13 contractsfrom 1999 to 2002
Contracts for Miscellaneous Communication Equipment, Miscellaneous Electrical and Electronic Components, ADP Support Equipment, Telephone and Telegraph Equipment, and moreby Tennessee Valley Authority, ENERGY, Department of, Navy, United States Coast Guard (disused code: now 7008), and others Signed by year:2000: $267,000; 2001: $27,223; 2002: $55,700; 2003: $0; 2004: $0; 2005: $0; 2006: $0.
Biggest contracts:
$154,000 with Tennessee Valley Authority for Miscellaneous Communication Equipment. Taking place in TN. Signed on 1999-11-15. Completion date: 1999-12-15.
$96,000, same as above.Signed on 2000-01-15. Completion date: 2000-01-15.
$60,000, same as above.Signed on 2000-05-15. Completion date: 2001-03-15.
$54,000 with Tennessee Valley Authority for Miscellaneous Electrical and Electronic Components. Taking place in TN. Signed on 1999-12-15. Completion date: 2000-01-15.
RVM SCIENTIFIC INC (5511 EKWILL ST #A; small business) : $459,167 in 2 contractsfrom 2002 to 2005
$395,000 with Federal Bureau of Investigation for Fire Prevention and Control -- Basic Research (R&D). Signed on 2002-09-15. Completion date: 2002-11-15.
$64,167 with Uniformed Services University of the Health Sciences for Chemical Analysis Instruments. Signed on 2005-09-27. Completion date: 2006-09-26.
INAMED CORPORATION (5540 EKWILL ST) : $334,169 in 26 contractsfrom 2004 to 2006
Contracts for Medical and Surgical Instruments, Equipment, and Supplies, Hospital Furniture, Equipment, Utensils, and Supplies by Air Force, Army, Department of Veterans Affairs, Navy, and others Signed by year:2000: $0; 2001: $0; 2002: $0; 2003: $0; 2004: $32,765; 2005: $215,881; 2006: $85,523.
Biggest contracts:
$50,000 with Air Force for Medical and Surgical Instruments, Equipment, and Supplies. Signed on 2005-08-22. Completion date: 2006-08-21.
$47,966 with Army for Medical and Surgical Instruments, Equipment, and Supplies. Taking place in DC. Signed on 2006-03-27. Completion date: 2006-03-07.
$38,320 with Army for Medical and Surgical Instruments, Equipment, and Supplies. Signed on 2005-03-15. Completion date: 2004-12-08.
$32,765 with Department of Veterans Affairs for Medical and Surgical Instruments, Equipment, and Supplies. Taking place in MS. Signed on 2004-11-05. Completion date: 2004-11-15.
Top industries in this zip code by the number of employees in 2005:
Management of Companies and Enterprises: Corporate, Subsidiary, and Regional Managing Offices (250-499 employees: 1 establishment, 100-249 employees: 1 establishment, 20-49 employees: 2 establishments, 1-4 employees: 2 establishments)
Professional, Scientific, and Technical Services: Research and Development in the Physical, Engineering, and Life Sciences (100-249: 1, 20-49: 1, 1-4: 4)
Professional, Scientific, and Technical Services: Computer Systems Design Services (50-99: 2, 20-49: 1, 1-4: 1)
Wholesale Trade: Other Electronic Parts and Equipment Merchant Wholesalers (100-249: 1, 5-9: 2)
Construction: Highway, Street, and Bridge Construction (100-249: 1)
Wholesale Trade: General Line Grocery Merchant Wholesalers (100-249: 1)
People in group quarters in 2010:
182 people in nursing facilities/skilled-nursing facilities
37 people in group homes intended for adults
29 people in workers' group living quarters and job corps centers
3 people in other noninstitutional facilities
People in group quarters in 2000:
161 people in nursing homes
47 people in other noninstitutional group quarters
46 people in wards in general hospitals for patients who have no usual home elsewhere
6 people in agriculture workers' dormitories on farms
6 people in other nonhousehold living situations
4 people in homes for the mentally ill
3 people in religious group quarters
Fatal accident statistics in 2011:
Fatal accident count: 1
Vehicles involved in fatal accidents: 1
Fatal accidents caused by drunken drivers: 0
Fatalities: 1
Persons involved in fatal accidents: 1
Pedestrians involved in fatal accidents: 1
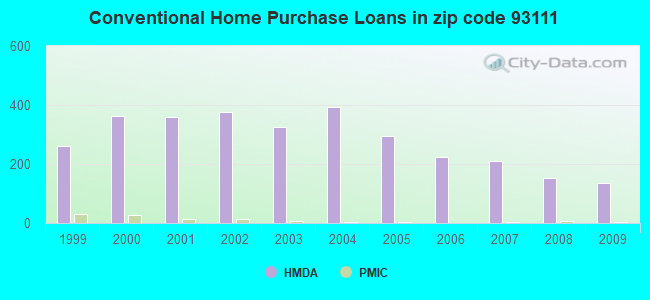
Home Mortgage Disclosure Act Aggregated Statistics For Year 2009 (Based on 3 full and 10 partial tracts)
A) FHA, FSA/RHS & VA Home Purchase Loans
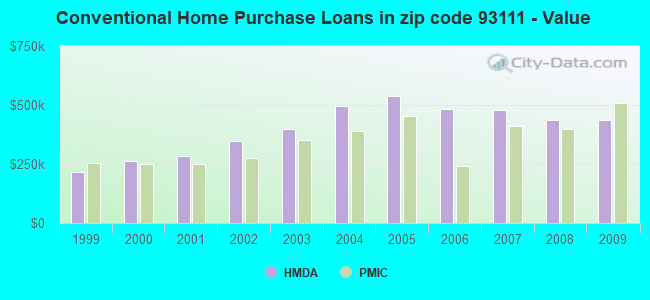
B) Conventional Home Purchase Loans
C) Refinancings
D) Home Improvement Loans
F) Non-occupant Loans on < 5 Family Dwellings (A B C & D)
G) Loans On Manufactured Home Dwelling (A B C & D)
Number
Average Value
Number
Average Value
Number
Average Value
Number
Average Value
Number
Average Value
Number
Average Value
LOANS ORIGINATED
23
$424,991
135
$437,573
647
$349,587
38
$289,507
62
$354,388
12
$139,909
APPLICATIONS APPROVED, NOT ACCEPTED
1
$138,620
20
$450,156
57
$360,419
3
$70,180
8
$374,551
1
$213,370
APPLICATIONS DENIED
8
$434,398
19
$435,365
151
$408,484
10
$188,025
20
$338,532
6
$192,952
APPLICATIONS WITHDRAWN
3
$387,667
29
$415,240
124
$418,893
10
$248,133
18
$357,623
2
$221,490
FILES CLOSED FOR INCOMPLETENESS
1
$68,740
4
$302,062
29
$381,844
2
$272,460
4
$238,815
0
$0
Aggregated Statistics For Year 2008 (Based on 3 full and 10 partial tracts)
A) FHA, FSA/RHS & VA Home Purchase Loans
B) Conventional Home Purchase Loans
C) Refinancings
D) Home Improvement Loans
E) Loans on Dwellings For 5+ Families
F) Non-occupant Loans on < 5 Family Dwellings (A B C & D)
G) Loans On Manufactured Home Dwelling (A B C & D)
Number
Average Value
Number
Average Value
Number
Average Value
Number
Average Value
Number
Average Value
Number
Average Value
Number
Average Value
LOANS ORIGINATED
9
$434,712
153
$436,092
237
$373,802
22
$291,194
1
$3,405,150
53
$404,862
41
$183,057
APPLICATIONS APPROVED, NOT ACCEPTED
0
$0
33
$462,800
43
$353,454
4
$137,340
0
$0
5
$349,178
4
$192,415
APPLICATIONS DENIED
5
$421,812
49
$422,659
149
$437,848
10
$293,407
0
$0
13
$332,762
16
$171,070
APPLICATIONS WITHDRAWN
0
$0
29
$502,188
60
$417,427
7
$361,941
0
$0
8
$359,511
4
$161,280
FILES CLOSED FOR INCOMPLETENESS
0
$0
5
$521,086
19
$566,097
1
$127,570
0
$0
3
$336,330
0
$0
Aggregated Statistics For Year 2007 (Based on 3 full and 10 partial tracts)
B) Conventional Home Purchase Loans
C) Refinancings
D) Home Improvement Loans
E) Loans on Dwellings For 5+ Families
F) Non-occupant Loans on < 5 Family Dwellings (A B C & D)
G) Loans On Manufactured Home Dwelling (A B C & D)
Number
Average Value
Number
Average Value
Number
Average Value
Number
Average Value
Number
Average Value
Number
Average Value
LOANS ORIGINATED
210
$476,842
416
$432,310
46
$315,963
2
$7,612,560
74
$405,493
41
$173,125
APPLICATIONS APPROVED, NOT ACCEPTED
40
$424,240
86
$477,880
5
$458,896
0
$0
14
$485,668
7
$129,744
APPLICATIONS DENIED
64
$450,994
193
$544,502
22
$264,078
0
$0
28
$516,398
23
$187,694
APPLICATIONS WITHDRAWN
25
$517,495
84
$512,883
11
$480,810
0
$0
19
$489,372
2
$133,400
FILES CLOSED FOR INCOMPLETENESS
4
$545,368
35
$450,783
1
$355,320
0
$0
2
$232,810
0
$0
Aggregated Statistics For Year 2006 (Based on 3 full and 10 partial tracts)
B) Conventional Home Purchase Loans
C) Refinancings
D) Home Improvement Loans
E) Loans on Dwellings For 5+ Families
F) Non-occupant Loans on < 5 Family Dwellings (A B C & D)
G) Loans On Manufactured Home Dwelling (A B C & D)
Number
Average Value
Number
Average Value
Number
Average Value
Number
Average Value
Number
Average Value
Number
Average Value
LOANS ORIGINATED
224
$481,543
548
$446,030
84
$292,794
2
$426,075
106
$409,929
33
$188,728
APPLICATIONS APPROVED, NOT ACCEPTED
38
$576,599
101
$467,027
13
$368,559
0
$0
17
$395,266
5
$218,184
APPLICATIONS DENIED
61
$473,334
227
$473,542
33
$273,014
0
$0
27
$505,920
12
$180,142
APPLICATIONS WITHDRAWN
35
$452,077
153
$444,870
20
$415,926
0
$0
17
$448,245
0
$0
FILES CLOSED FOR INCOMPLETENESS
9
$411,810
33
$446,889
2
$343,305
0
$0
2
$589,430
2
$252,515
Aggregated Statistics For Year 2005 (Based on 3 full and 10 partial tracts)
B) Conventional Home Purchase Loans
C) Refinancings
D) Home Improvement Loans
E) Loans on Dwellings For 5+ Families
F) Non-occupant Loans on < 5 Family Dwellings (A B C & D)
G) Loans On Manufactured Home Dwelling (A B C & D)
Number
Average Value
Number
Average Value
Number
Average Value
Number
Average Value
Number
Average Value
Number
Average Value
LOANS ORIGINATED
295
$537,426
634
$443,547
88
$356,334
4
$463,482
116
$432,358
44
$150,205
APPLICATIONS APPROVED, NOT ACCEPTED
42
$557,051
101
$400,423
10
$388,434
0
$0
13
$408,459
5
$187,876
APPLICATIONS DENIED
84
$523,695
230
$419,666
25
$331,624
0
$0
38
$459,862
19
$167,829
APPLICATIONS WITHDRAWN
70
$525,716
190
$444,286
21
$356,360
0
$0
33
$506,802
9
$198,933
FILES CLOSED FOR INCOMPLETENESS
15
$541,731
88
$442,120
8
$457,060
0
$0
10
$641,071
4
$210,312
Aggregated Statistics For Year 2004 (Based on 3 full and 10 partial tracts)
B) Conventional Home Purchase Loans
C) Refinancings
D) Home Improvement Loans
E) Loans on Dwellings For 5+ Families
F) Non-occupant Loans on < 5 Family Dwellings (A B C & D)
G) Loans On Manufactured Home Dwelling (A B C & D)
Number
Average Value
Number
Average Value
Number
Average Value
Number
Average Value
Number
Average Value
Number
Average Value
LOANS ORIGINATED
392
$496,615
889
$366,854
70
$290,811
1
$65,080
157
$365,478
47
$157,328
APPLICATIONS APPROVED, NOT ACCEPTED
49
$466,489
129
$353,001
4
$192,810
0
$0
20
$348,900
7
$197,356
APPLICATIONS DENIED
77
$531,803
180
$372,102
24
$192,992
0
$0
26
$450,146
18
$126,676
APPLICATIONS WITHDRAWN
67
$436,499
186
$348,408
10
$184,771
0
$0
14
$396,731
13
$156,517
FILES CLOSED FOR INCOMPLETENESS
15
$344,251
35
$382,888
3
$340,197
0
$0
4
$298,065
2
$206,745
Aggregated Statistics For Year 2003 (Based on 3 full and 10 partial tracts)
B) Conventional Home Purchase Loans
C) Refinancings
D) Home Improvement Loans
F) Non-occupant Loans on < 5 Family Dwellings (A B C & D)
Number
Average Value
Number
Average Value
Number
Average Value
Number
Average Value
LOANS ORIGINATED
326
$399,751
2,142
$284,792
20
$78,433
226
$261,518
APPLICATIONS APPROVED, NOT ACCEPTED
41
$436,990
236
$312,435
4
$71,672
18
$327,343
APPLICATIONS DENIED
56
$366,114
232
$308,939
10
$71,622
23
$288,351
APPLICATIONS WITHDRAWN
39
$299,345
248
$295,195
5
$57,132
21
$290,463
FILES CLOSED FOR INCOMPLETENESS
7
$469,434
58
$308,747
2
$244,245
3
$279,273
Aggregated Statistics For Year 2002 (Based on 3 full and 10 partial tracts)
A) FHA, FSA/RHS & VA Home Purchase Loans
B) Conventional Home Purchase Loans
C) Refinancings
D) Home Improvement Loans
E) Loans on Dwellings For 5+ Families
F) Non-occupant Loans on < 5 Family Dwellings (A B C & D)
Number
Average Value
Number
Average Value
Number
Average Value
Number
Average Value
Number
Average Value
Number
Average Value
LOANS ORIGINATED
3
$205,997
375
$346,368
1,488
$276,850
36
$76,070
3
$672,193
148
$258,675
APPLICATIONS APPROVED, NOT ACCEPTED
0
$0
56
$408,836
157
$277,943
5
$36,174
0
$0
13
$246,946
APPLICATIONS DENIED
1
$202,270
50
$320,647
178
$312,698
21
$61,066
0
$0
13
$282,515
APPLICATIONS WITHDRAWN
0
$0
48
$340,092
165
$255,529
6
$101,958
0
$0
13
$247,566
FILES CLOSED FOR INCOMPLETENESS
0
$0
8
$474,210
40
$252,093
1
$26,030
0
$0
2
$164,445
Aggregated Statistics For Year 2001 (Based on 3 full and 10 partial tracts)
A) FHA, FSA/RHS & VA Home Purchase Loans
B) Conventional Home Purchase Loans
C) Refinancings
D) Home Improvement Loans
E) Loans on Dwellings For 5+ Families
F) Non-occupant Loans on < 5 Family Dwellings (A B C & D)
Number
Average Value
Number
Average Value
Number
Average Value
Number
Average Value
Number
Average Value
Number
Average Value
LOANS ORIGINATED
6
$153,925
358
$282,883
1,038
$252,864
47
$51,212
4
$948,010
125
$220,882
APPLICATIONS APPROVED, NOT ACCEPTED
0
$0
32
$283,830
130
$238,522
19
$178,104
0
$0
15
$201,141
APPLICATIONS DENIED
0
$0
42
$315,535
140
$249,847
20
$66,294
1
$389,670
14
$223,301
APPLICATIONS WITHDRAWN
1
$310,310
46
$244,327
149
$228,625
10
$20,391
1
$222,670
9
$174,787
FILES CLOSED FOR INCOMPLETENESS
0
$0
14
$302,258
45
$260,594
0
$0
0
$0
6
$202,047
Aggregated Statistics For Year 2000 (Based on 3 full and 10 partial tracts)
A) FHA, FSA/RHS & VA Home Purchase Loans
B) Conventional Home Purchase Loans
C) Refinancings
D) Home Improvement Loans
F) Non-occupant Loans on < 5 Family Dwellings (A B C & D)
Number
Average Value
Number
Average Value
Number
Average Value
Number
Average Value
Number
Average Value
LOANS ORIGINATED
6
$144,272
363
$264,167
265
$203,788
40
$38,134
50
$187,870
APPLICATIONS APPROVED, NOT ACCEPTED
0
$0
42
$220,494
59
$198,294
11
$44,271
7
$124,010
APPLICATIONS DENIED
1
$167,000
61
$254,910
116
$205,945
9
$25,097
4
$247,842
APPLICATIONS WITHDRAWN
0
$0
45
$261,288
63
$168,508
9
$29,747
13
$192,100
FILES CLOSED FOR INCOMPLETENESS
0
$0
16
$184,209
20
$275,871
1
$80,000
1
$73,430
Aggregated Statistics For Year 1999 (Based on 2 full and 6 partial tracts)
A) FHA, FSA/RHS & VA Home Purchase Loans
B) Conventional Home Purchase Loans
C) Refinancings
D) Home Improvement Loans
E) Loans on Dwellings For 5+ Families
F) Non-occupant Loans on < 5 Family Dwellings (A B C & D)
2005 - 2018 National Fire Incident Reporting System (NFIRS) incidents
Based on the data from the years 2005 - 2018 the average number of fire incidents per year is 13. The highest number of reported fires - 24 took place in 2013, and the least - 0 in 2006. The data has a decreasing trend.
When looking into fire subcategories, the most incidents belonged to: Outside Fires (39.9%), and Structure Fires (33.0%).
Fire incident types reported to NFIRS in Zip Code 93111


 Nearest zip codes: 93110, 93105, 93109, 93101, 93103, 93108.


 Based on the data from the years 2005 - 2018 the average number of fire incidents per year is 13. The highest number of reported fires - 24 took place in 2013, and the least - 0 in 2006. The data has a decreasing trend.
 When looking into fire subcategories, the most incidents belonged to: Outside Fires (39.9%), and Structure Fires (33.0%).