Estimated zip code population in 2022: 30,378 Zip code population in 2010: 29,309 Zip code population in 2000: 15,280
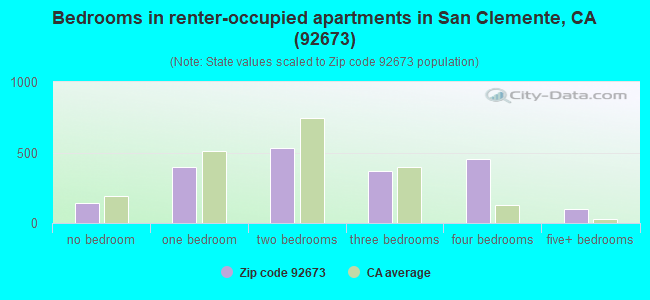
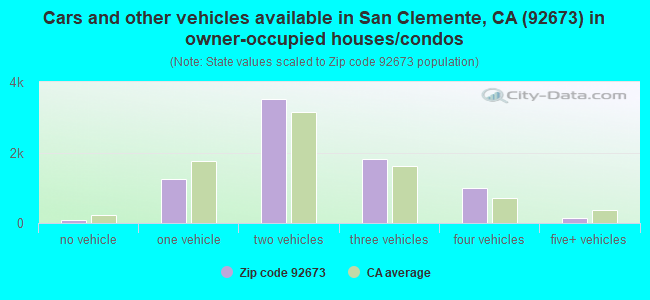
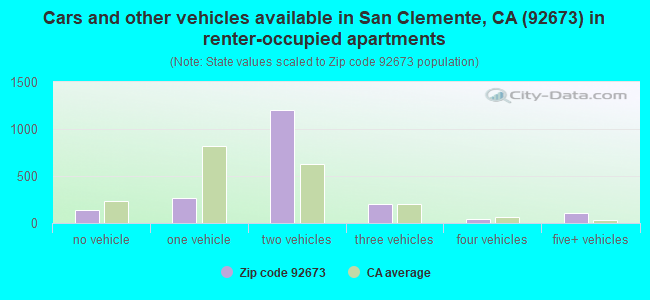
Houses and condos: 10,242 Renter-occupied apartments: 1,988
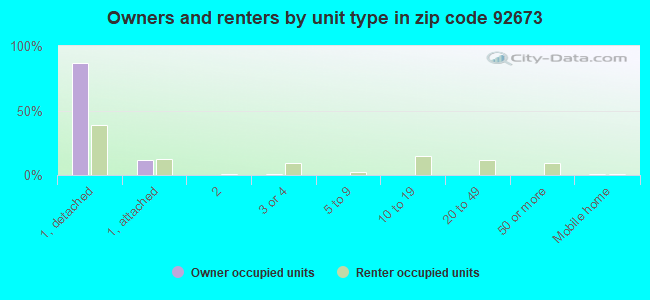
% of renters here:
20%
State:
44%
March 2022 cost of living index in zip code 92673: 87.8 (less than average, U.S. average is 100)
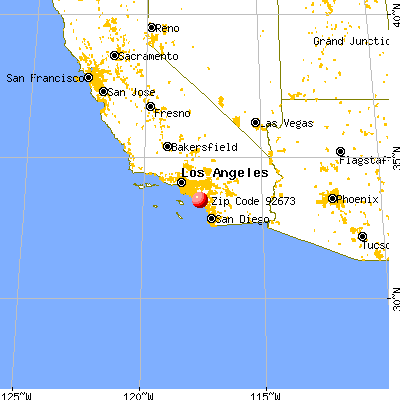
Land area: 11.7 sq. mi. Water area: 0.0 sq. mi.
Population density: 2,601 people per square mile
(average).
OSM Map
General Map
Google Map
MSN Map
OSM Map
General Map
Google Map
MSN Map
OSM Map
General Map
Google Map
MSN Map
OSM Map
General Map
Google Map
MSN Map
Please wait while loading the map...
Real estate property taxes paid for housing units in 2022:
This zip code:
0.7% ($9,150)
California:
0.7% ($4,831)
Median real estate property taxes paid for housing units with mortgages in 2022: $9,371 (0.8%) Median real estate property taxes paid for housing units with no mortgage in 2022: $7,914 (0.6%)
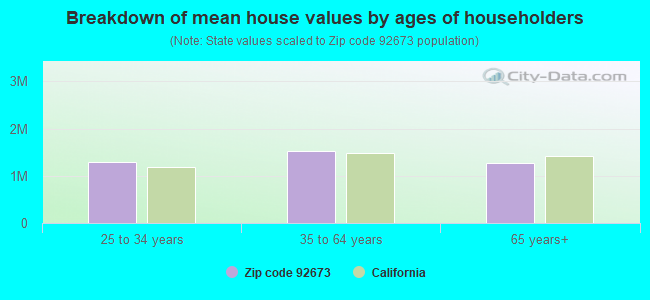
Estimated median house/condo value in 2022: $1,251,006
92673:
$1,251,006
California:
$715,900
According to our research of California and other state lists, there were 3 registered sex offenders living in 92673 zip code as of April 28, 2024. The ratio of all residents to sex offenders in zip code 92673 is 10,330 to 1. The ratio of registered sex offenders to all residents in this zip code is much lower than the state average.
Median resident age:
This zip code:
42.8 years
California median age:
37.9 years
Average household size:
This zip code:
3.1 people
California:
2.8 people
Averages for the 2020 tax year for zip code 92673, filed in 2021:
Average Adjusted Gross Income (AGI) in 2020: $183,070 (Individual Income Tax Returns)
Here:
$183,070
State:
$95,910
Salary/wage: $143,047 (reported on 76.0% of returns)
Here:
$143,047
State:
$77,331
(% of AGI for various income ranges: 1264.3% for AGIs below $25k, 3837.7% for AGIs $25k-50k, 6861.1% for AGIs $50k-75k, 10062.9% for AGIs $75k-100k, 20206.6% for AGIs $100k-200k, 111343.3% for AGIs over 200k)
Taxable interest for individuals: $2,700 (reported on 54.6% of returns)
This zip code:
$2,700
California:
$2,294
(% of AGI for various income ranges: 31.7% for AGIs below $25k, 84.5% for AGIs $25k-50k, 185.2% for AGIs $50k-75k, 254.7% for AGIs $75k-100k, 370.3% for AGIs $100k-200k, 1199.0% for AGIs over 200k)
Ordinary dividends: $9,423 (reported on 39.8% of returns)
Here:
$9,423
State:
$10,949
(% of AGI for various income ranges: 76.1% for AGIs below $25k, 163.3% for AGIs $25k-50k, 371.1% for AGIs $50k-75k, 487.1% for AGIs $75k-100k, 853.5% for AGIs $100k-200k, 3375.7% for AGIs over 200k)
Net capital gain/loss in AGI: +$48,016 (reported on 39.7% of returns)
Here:
+$48,016
State:
+$49,306
(% of AGI for various income ranges: 46.6% for AGIs below $25k, 123.5% for AGIs $25k-50k, 361.6% for AGIs $50k-75k, 486.1% for AGIs $75k-100k, 1210.7% for AGIs $100k-200k, 24769.8% for AGIs over 200k)
Profit/loss from business: +$27,670 (reported on 22.8% of returns)
Here:
+$27,670
State:
+$15,671
(% of AGI for various income ranges: 191.2% for AGIs below $25k, 478.3% for AGIs $25k-50k, 732.4% for AGIs $50k-75k, 1004.3% for AGIs $75k-100k, 1544.9% for AGIs $100k-200k, 5013.7% for AGIs over 200k)
Taxable individual retirement arrangement distribution: $35,846 (reported on 13.1% of returns)
92673:
$35,846
California:
$23,505
(% of AGI for various income ranges: 75.7% for AGIs below $25k, 216.4% for AGIs $25k-50k, 550.6% for AGIs $50k-75k, 939.8% for AGIs $75k-100k, 1709.8% for AGIs $100k-200k, 3166.6% for AGIs over 200k)
Self-employed (Keogh) retirement plans: $32,677 (reported on 2.2% of returns)
92673:
$32,677
California:
$30,163
(% of AGI for various income ranges: 105.6% for AGIs $50k-75k, 92.0% for AGIs $100k-200k, 855.4% for AGIs over 200k)
Total itemized deductions: $43,833 (reported on 37.4% of returns)
Here:
$43,833
State:
$39,517
(% of AGI for various income ranges: 271.2% for AGIs below $25k, 658.1% for AGIs $25k-50k, 1626.2% for AGIs $50k-75k, 2372.2% for AGIs $75k-100k, 4370.6% for AGIs $100k-200k, 13970.1% for AGIs over 200k)
Charity contributions: $12,115 (reported on 33.2% of returns)
Here:
$12,115
State:
$12,598
(% of AGI for various income ranges: 11.9% for AGIs below $25k, 50.4% for AGIs $25k-50k, 157.6% for AGIs $50k-75k, 319.4% for AGIs $75k-100k, 579.2% for AGIs $100k-200k, 4610.3% for AGIs over 200k)
Taxes paid: $9,434 (reported on 37.2% of returns)
92673:
$9,434
State:
$8,807
(% of AGI for various income ranges: 53.4% for AGIs below $25k, 137.2% for AGIs $25k-50k, 379.2% for AGIs $50k-75k, 598.6% for AGIs $75k-100k, 1146.5% for AGIs $100k-200k, 2666.9% for AGIs over 200k)
Earned income credit: $1,804 (reported on 5.5% of returns)
Here:
$1,804
State:
$2,074
(% of AGI for various income ranges: 44.9% for AGIs below $25k, 49.4% for AGIs $25k-50k)
Percentage of individuals using paid preparers for their 2020 taxes: 93.7%
Here:
94%
State:
92%
(% for various income ranges: 91.4% for AGIs below $25k, 93.0% for AGIs $25k-50k, 93.2% for AGIs $50k-75k, 94.2% for AGIs $75k-100k, 94.2% for AGIs $100k-200k, 95.8% for AGIs over 200k)
Averages for the 2012 tax year for zip code 92673, filed in 2013:
Average Adjusted Gross Income (AGI) in 2012: $133,240 (Individual Income Tax Returns)
Here:
$133,240
State:
$72,726
Salary/wage: $112,606 (reported on 78.7% of returns)
Here:
$112,606
State:
$59,079
(% of AGI for various income ranges: 71.2% for AGIs below $25k, 65.6% for AGIs $25k-50k, 58.9% for AGIs $50k-75k, 61.9% for AGIs $75k-100k, 70.8% for AGIs $100k-200k, 65.4% for AGIs over 200k)
Taxable interest for individuals: $2,420 (reported on 55.4% of returns)
This zip code:
$2,420
California:
$2,146
(% of AGI for various income ranges: 2.2% for AGIs below $25k, 2.0% for AGIs $25k-50k, 1.8% for AGIs $50k-75k, 1.6% for AGIs $75k-100k, 0.9% for AGIs $100k-200k, 0.8% for AGIs over 200k)
Ordinary dividends: $7,434 (reported on 36.5% of returns)
Here:
$7,434
State:
$9,308
(% of AGI for various income ranges: 3.3% for AGIs below $25k, 2.2% for AGIs $25k-50k, 2.8% for AGIs $50k-75k, 2.4% for AGIs $75k-100k, 1.8% for AGIs $100k-200k, 2.0% for AGIs over 200k)
Net capital gain/loss in AGI: +$20,172 (reported on 35.9% of returns)
Here:
+$20,172
State:
+$30,460
(% of AGI for various income ranges: 1.0% for AGIs $50k-75k, 1.0% for AGIs $75k-100k, 1.4% for AGIs $100k-200k, 8.7% for AGIs over 200k)
Profit/loss from business: +$28,676 (reported on 23.4% of returns)
Here:
+$28,676
State:
+$17,064
(% of AGI for various income ranges: 13.8% for AGIs below $25k, 9.5% for AGIs $25k-50k, 8.2% for AGIs $50k-75k, 6.9% for AGIs $75k-100k, 5.6% for AGIs $100k-200k, 3.7% for AGIs over 200k)
Taxable individual retirement arrangement distribution: $25,679 (reported on 14.0% of returns)
92673:
$25,679
California:
$19,557
(% of AGI for various income ranges: 4.2% for AGIs below $25k, 4.6% for AGIs $25k-50k, 6.0% for AGIs $50k-75k, 4.7% for AGIs $75k-100k, 3.8% for AGIs $100k-200k, 1.5% for AGIs over 200k)
Self-employment retirement plans: $25,878 (reported on 2.5% of returns)
92673:
$25,878
California:
$24,530
(% of AGI for various income ranges: 0.5% for AGIs $50k-75k, 0.4% for AGIs $75k-100k, 0.4% for AGIs $100k-200k, 0.6% for AGIs over 200k)
Total itemized deductions: $47,784 (24% of AGI, reported on 61.6% of returns)
Here:
$47,784
State:
$34,004
Here:
24.2% of AGI
State:
22.7% of AGI
(% of AGI for various income ranges: 27.2% for AGIs below $25k, 23.0% for AGIs $25k-50k, 27.8% for AGIs $50k-75k, 25.8% for AGIs $75k-100k, 25.6% for AGIs $100k-200k, 19.4% for AGIs over 200k)
Charity contributions: $5,285 (reported on 54.9% of returns)
Here:
$5,285
State:
$4,659
(% of AGI for various income ranges: 1.3% for AGIs below $25k, 1.7% for AGIs $25k-50k, 2.4% for AGIs $50k-75k, 2.5% for AGIs $75k-100k, 2.3% for AGIs $100k-200k, 2.1% for AGIs over 200k)
Taxes paid: $20,711 (reported on 61.5% of returns)
92673:
$20,711
State:
$14,448
(% of AGI for various income ranges: 6.0% for AGIs below $25k, 5.6% for AGIs $25k-50k, 7.5% for AGIs $50k-75k, 8.0% for AGIs $75k-100k, 9.6% for AGIs $100k-200k, 10.2% for AGIs over 200k)
Earned income credit: $1,940 (reported on 6.9% of returns)
Here:
$1,940
State:
$2,286
(% of AGI for various income ranges: 3.5% for AGIs below $25k, 0.7% for AGIs $25k-50k)
Percentage of individuals using paid preparers for their 2012 taxes: 68.2%
Here:
68%
State:
64%
(% for various income ranges: 55.6% for AGIs below $25k, 65.5% for AGIs $25k-50k, 71.3% for AGIs $50k-75k, 72.3% for AGIs $75k-100k, 72.4% for AGIs $100k-200k, 79.1% for AGIs over 200k)
Averages for the 2004 tax year for zip code 92673, filed in 2005:
Average Adjusted Gross Income (AGI) in 2004: $103,685 (Individual Income Tax Returns)
Here:
$103,685
State:
$58,600
Salary/wage: $89,725 (reported on 79.4% of returns)
Here:
$89,725
State:
$49,455
(% of AGI for various income ranges: 69.0% for AGIs $10k-25k, 64.6% for AGIs $25k-50k, 65.1% for AGIs $50k-75k, 72.7% for AGIs $75k-100k, 67.4% for AGIs over 100k)
Taxable interest for individuals: $2,791 (reported on 66.4% of returns)
This zip code:
$2,791
California:
$2,365
(% of AGI for various income ranges: 4.3% for AGIs $10k-25k, 3.0% for AGIs $25k-50k, 2.4% for AGIs $50k-75k, 1.8% for AGIs $75k-100k, 1.5% for AGIs over 100k)
Taxable dividends: $3,857 (reported on 41.2% of returns)
Here:
$3,857
State:
$4,746
(% of AGI for various income ranges: 2.8% for AGIs $10k-25k, 2.5% for AGIs $25k-50k, 2.0% for AGIs $50k-75k, 1.8% for AGIs $75k-100k, 1.3% for AGIs over 100k)
Net capital gain/loss: +$18,177 (reported on 38.2% of returns)
Here:
+$18,177
State:
+$23,418
(% of AGI for various income ranges: 1.7% for AGIs $10k-25k, 0.5% for AGIs $25k-50k, 0.9% for AGIs $50k-75k, 1.3% for AGIs $75k-100k, 8.4% for AGIs over 100k)
Profit/loss from business: +$25,758 (reported on 25.3% of returns)
Here:
+$25,758
State:
+$16,826
(% of AGI for various income ranges: 13.3% for AGIs $10k-25k, 12.9% for AGIs $25k-50k, 10.1% for AGIs $50k-75k, 7.3% for AGIs $75k-100k, 5.2% for AGIs over 100k)
Profit/loss from farming: +$2,182 (reported on 0.1% of returns)
Here:
+$2,182
State:
-$7,562
IRA payment deduction: $3,741 (reported on 4.3% of returns)
92673:
$3,741
California:
$3,192
(% of AGI for various income ranges: 0.3% for AGIs $10k-25k, 0.3% for AGIs $25k-50k, 0.3% for AGIs $50k-75k, 0.3% for AGIs $75k-100k, 0.1% for AGIs over 100k)
Self-employed pension: $19,013 (reported on 3.4% of returns)
Here:
$19,013
California:
$17,688
(% of AGI for various income ranges: 0.2% for AGIs $10k-25k, 0.8% for AGIs $25k-50k, 0.4% for AGIs $50k-75k, 0.4% for AGIs $75k-100k, 0.7% for AGIs over 100k)
Total itemized deductions: $40,097 (27% of AGI, reported on 65.2% of returns)
Here:
$40,097
State:
$28,113
Here:
27.0% of AGI
State:
25.3% of AGI
(% of AGI for various income ranges: 30.0% for AGIs $10k-25k, 31.3% for AGIs $25k-50k, 33.6% for AGIs $50k-75k, 31.9% for AGIs $75k-100k, 22.7% for AGIs over 100k)
Charity contributions deductions: $4,683 (3% of AGI, reported on 60.6% of returns)
Here:
$4,683
State:
$3,923
Here:
3.1% of AGI
State:
3.3% of AGI
(% of AGI for various income ranges: 2.0% for AGIs $10k-25k, 2.4% for AGIs $25k-50k, 3.0% for AGIs $50k-75k, 3.1% for AGIs $75k-100k, 2.7% for AGIs over 100k)
Total tax: $19,884 (reported on 83.3% of returns)
92673:
$19,884
State:
$10,761
(% of AGI for various income ranges: 5.5% for AGIs $10k-25k, 7.5% for AGIs $25k-50k, 8.7% for AGIs $50k-75k, 9.1% for AGIs $75k-100k, 18.1% for AGIs over 100k)
Earned income credit: $1,563 (reported on 5.4% of returns)
Here:
$1,563
State:
$1,763
Percentage of individuals using paid preparers for their 2004 taxes: 71.4%
Here:
71%
State:
66%
(% for various income ranges: 57.6% for AGIs below $10k, 64.7% for AGIs $10k-25k, 69.5% for AGIs $25k-50k, 75.0% for AGIs $50k-75k, 74.1% for AGIs $75k-100k, 78.4% for AGIs over 100k)
Household received Food Stamps/SNAP in the past 12 months: 197 Household did not receive Food Stamps/SNAP in the past 12 months: 9,397
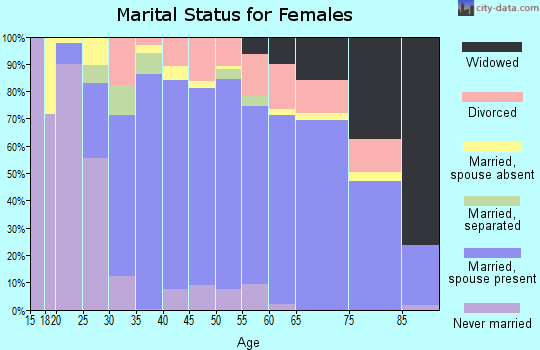
Women who had a birth in the past 12 months: 325 (248 now married, 76 unmarried) Women who did not have a birth in the past 12 months: 5,333 (3,093 now married, 2,199 unmarried)
Housing units in zip code 92673 with a mortgage: 5,892 (1,019 second mortgage, 44 home equity loan, 947 both second mortgage and home equity loan) Houses without a mortgage: 24
Median monthly owner costs for units with a mortgage: $3,876 Median monthly owner costs for units without a mortgage: $1,232
Residents with income below the poverty level in 2022:
This zip code:
4.6%
Whole state:
12.2%
Residents with income below 50% of the poverty level in 2022:
This zip code:
1.6%
Whole state:
6.2%
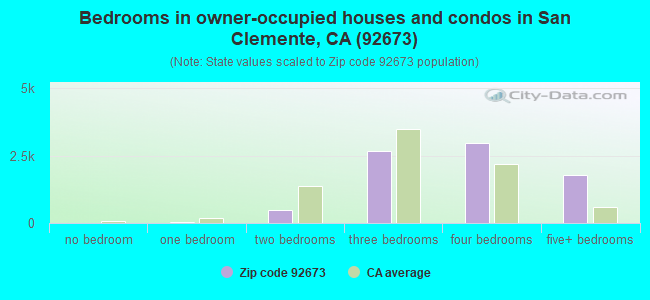
Median number of rooms in houses and condos:
Here:
7.5
State:
6.0
Median number of rooms in apartments:
Here:
4.7
State:
3.9
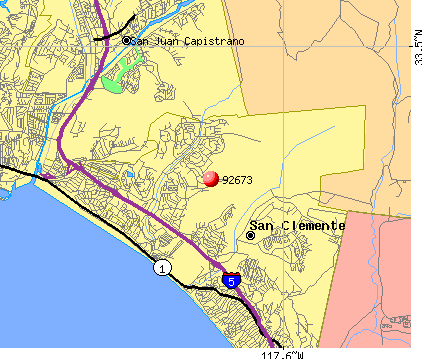
Notable locations in this zip code not listed on our city pages
Notable locations in zip code 92673: Rancho San Clemente Business Park (A), Pacific Golf Club (B), Orange County Fire Authority Station 50 (C), Orange County Fire Authority Station 59 (D). Display/hide their locations on the map
6,443 married couples with children.
1,032 single-parent households (170 men, 862 women).
83.3% of residents of 92673 zip code speak English at home.
7.4% of residents speak Spanish at home (83% very well, 11% well, 3% not well, 3% not at all).
6.8% of residents speak other Indo-European language at home (74% very well, 19% well, 6% not well).
1.8% of residents speak Asian or Pacific Island language at home (82% very well, 10% well, 8% not well).
0.4% of residents speak other language at home (100% very well).
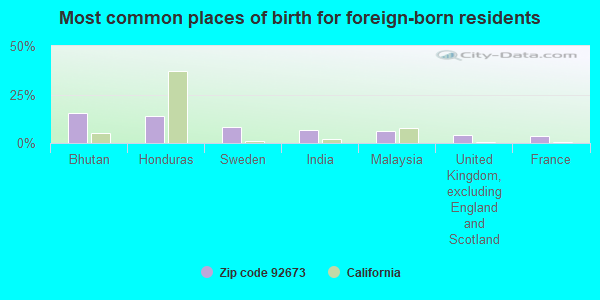
Foreign born population: 3,460 (11.4%) (71.3% of them are naturalized citizens)
Facilities with environmental interests located in this zip code:
MARBLEHEAD ELEMENTARY (2410 VIA TURQUEZA in SAN CLEMENTE, CA)
(National Center for Education Statistics) - STATE ID-6118954 Organizations: CAPISTRANO UNIFIED (SCHOOL DISTRICT)
NORTHROP GRUMMAN SPACE AND MISSION SYSTEMS (3300 AVENIDO PICO in SAN CLEMENTE, CA)
(Integrated Compliance Information System) - ICIS-09-2003-0158, FORMAL ENFORCEMENT ACTION
FLAVOR INFUSION LLC (1324 CALLE AVANZADO in SAN CLEMENTE, CA)
Small Quantity Generators, between 100 kg and 1000 kg of hazardous waste/month (Resource Conservation and Recovery Act (tracking hazardous waste))
ICU MEDICAL (951 CALLE AMANECER in SAN CLEMENTE, CA)
Small Quantity Generators, between 100 kg and 1000 kg of hazardous waste/month (Resource Conservation and Recovery Act (tracking hazardous waste)) - notification Organizations: GEORGE LOPEZ (CONTACT/OWNER)
IMPACT BEARING (1291 PUERTO DEL SOL in SAN CLEMENTE, CA)
Small Quantity Generators, between 100 kg and 1000 kg of hazardous waste/month (Resource Conservation and Recovery Act (tracking hazardous waste)) Business NAICS classification: BALL AND ROLLER BEARING MANUFACTURING. Organizations: SANDY WHITE (CONTACT/OPERATOR)
, RICHARD KAY (CONTACT/OWNER)
C C 1 HOUR PHOTO (620 CAMINO DE LOS MARES UNIT B in SAN CLEMENTE, CA)
Small Quantity Generators, between 100 kg and 1000 kg of hazardous waste/month (Resource Conservation and Recovery Act (tracking hazardous waste)) - notification Organizations: PAUL LAU (CONTACT/OWNER)
Housing units lacking complete plumbing facilities: 0.3% Housing units lacking complete kitchen facilities: 0.5%
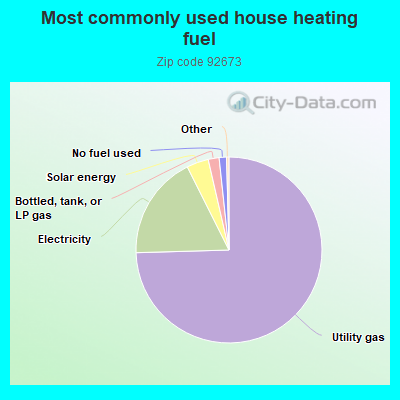
74.7%Utility gas
18.1%Electricity
3.8%Solar energy
1.9%Bottled, tank, or LP gas
1.3%No fuel used
Place of birth for U.S.-born residents:
This state: 17,916
Northeast: 2,727
Midwest: 2,056
South: 1,965
West: 1,629
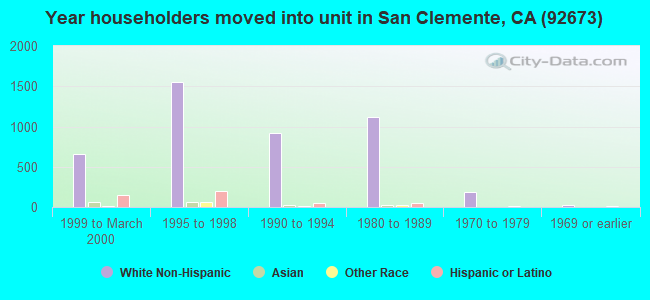
54% of the 92673 zip code residents lived in the same house 5 years ago. Out of people who lived in different houses, 71% lived in this county. Out of people who lived in different counties, 50% lived in California.
91% of the 92673 zip code residents lived in the same house 1 year ago. Out of people who lived in different houses, 46% moved from this county. Out of people who lived in different houses, 27% moved from different county within same state. Out of people who lived in different houses, 24% moved from different state. Out of people who lived in different houses, 5% moved from abroad.
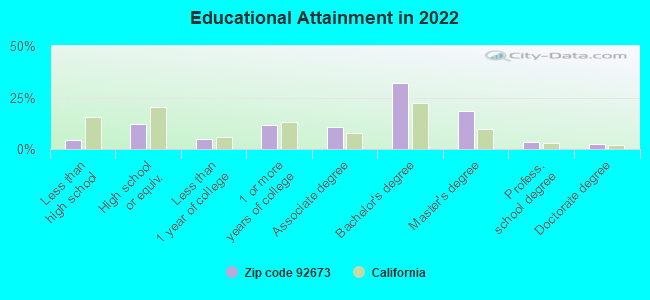
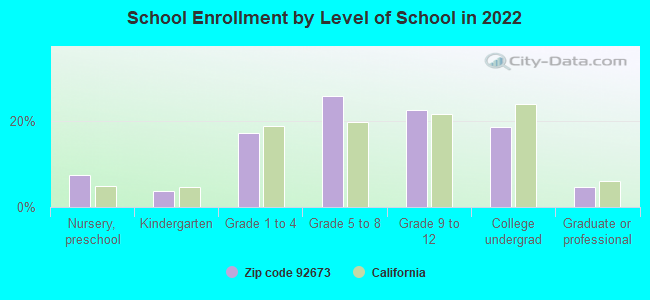
Private vs. public school enrollment:
Students in private schools in grades 1 to 8 (elementary and middle school): 934
Here:
23.1%
California:
10.5%
Students in private schools in grades 9 to 12 (high school): 211
Here:
10.1%
California:
8.5%
Students in private undergraduate colleges: 190
Here:
11.1%
California:
15.9%
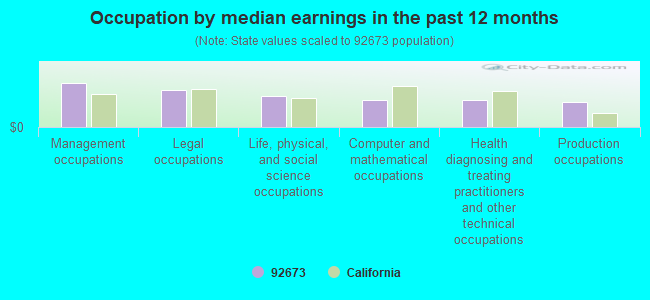
Occupation by median earnings in the past 12 months ($)
160,469Management occupations
133,526Legal occupations
111,795Life, physical, and social science occupations
98,763Computer and mathematical occupations
97,363Health diagnosing and treating practitioners and other technical occupations
91,537Production occupations
Companies with biggest federal contracts located in this zip code (SAN CLEMENTE, CA):
SOURCE DIVERSIFIED, INC (16 VIA BELLEZA) : $14,453,179 in 197 contractsfrom 1999 to 2006
Contracts for ADP Software, ADP Systems Development Services, ADP Input/Output and Storage Devices, ADP Components, and moreby Office of the Secretary, Department of Homeland Security, Centers for Medicare & Medicaid Services, Federal Technology Service, U.S. Customs Service, and others Signed by year:2000: $441,051; 2001: -$4,231; 2002: $1,573,886; 2003: $3,851,005; 2004: $2,776,479; 2005: $3,794,378; 2006: $1,939,603.
Biggest contracts:
$1,264,171 with Office of the Secretary, Department of Homeland Security for ADP Software. Taking place in DC. Signed on 2005-09-30. Completion date: 2006-09-30.
$891,201 with Centers for Medicare & Medicaid Services for ADP Software. Taking place in DC. Signed on 2006-03-31. Completion date: 2007-06-30.
$660,194 with Federal Technology Service for ADP Systems Development Services. Taking place in VA. Signed on 2003-04-15. Completion date: 2003-09-15.
$620,000 with Office of the Secretary, Department of Homeland Security for ADP Input/Output and Storage Devices. Signed on 2004-09-30. Completion date: 2005-09-30.
FIRST DEFENSE INTERNATIONAL GR (1050 CALLE AMANECER, SUITE; small business) : $5,284,529 in 2 contractsin 2004
$3,830,911 with Army for Safety and Rescue Equipment. Signed on 2004-05-27. Completion date: 2004-06-18.
$1,453,618 with Army for Armor, Personal. Taking place in GA. Signed on 2004-05-26. Completion date: 2004-06-18.
CONSOLIDATED CONTRACTING SERVI (181 AVENIDA LA PATA; small business) : $4,029,580 in 22 contractsfrom 2003 to 2006
Contracts for Construction of Structures and Facilities -- Miscellaneous Buildings, Maintenance, Repair or Alteration of Real Property -- Office Buildings, Maintenance, Repair or Alteration of Real Property -- Other Non-Building Facilities, Construction of Structures and Facilities -- Other Utilities, and moreby Navy Signed by year:2000: $0; 2001: $0; 2002: $0; 2003: $1,260,043; 2004: $1,280,936; 2005: $1,320,509; 2006: $168,092.
Biggest contracts:
$1,261,307 with Navy for Construction of Structures and Facilities -- Miscellaneous Buildings. Signed on 2005-05-17. Completion date: 2005-12-29.
$997,587, same as above.Signed on 2003-08-29. Completion date: 2004-06-14.
$433,050 with Navy for Maintenance, Repair or Alteration of Real Property -- Office Buildings. Signed on 2004-05-10. Completion date: 2004-11-07.
$354,120 with Navy for Maintenance, Repair or Alteration of Real Property -- Other Non-Building Facilities. Signed on 2004-01-13. Completion date: 2004-07-26.
VELLICOM INCORPORATED (1046 CALLE RECODO STE G; small business) : $1,745,682 in 21 contractsfrom 2000 to 2006
Contracts for Office Furniture, Games, Toys and Wheeled Goods, Intercommunication and Public Address Systems, Except Airborne, Installation of Equipment -- Communication, Detection, and Coherent Radiation Equipment by Federal Supply Service, Navy, Air Force, Army, and others Signed by year:2000: $173,742; 2001: $62,032; 2002: $256,738; 2003: $896,865; 2004: $162,327; 2005: $130,432; 2006: $63,546.
Biggest contracts:
$469,083 with Federal Supply Service for Office Furniture. Taking place in TN. Signed on 2003-11-13. Completion date: 2004-02-14.
$171,882 with Navy for Games, Toys and Wheeled Goods. Signed on 2003-08-12. Completion date: 2003-09-26.
$108,084, same as above.Signed on 2003-09-15. Completion date: 2003-10-27.
$100,833, same as above.Signed on 2003-04-18. Completion date: 2003-05-30.
REYNARD CORPORATION (1020 CALLE SOMBRA; small business) : $1,367,623 in 22 contractsfrom 2002 to 2005
Contracts for Optical Instruments, Test Equipment, Components and Accessories, Defense Missile and Space Systems -- Basic Research (R&D), Weapons -- Basic Research (R&D), Modification of Equipment -- Miscellaneous, and moreby Air Force, Missile Defense Agency, Navy, NASA, and others Signed by year:2000: $0; 2001: $0; 2002: $736,463; 2003: $63,418; 2004: $111,213; 2005: $456,529; 2006: $0.
Biggest contracts:
$736,463 with Air Force for Optical Instruments, Test Equipment, Components and Accessories. Signed on 2002-09-18. Completion date: 2003-03-31.
$99,925 with Missile Defense Agency for Defense Missile and Space Systems -- Basic Research (R&D). Signed on 2005-03-31. Completion date: 2005-10-03.
$79,996 with Navy for Weapons -- Basic Research (R&D). Signed on 2005-05-23. Completion date: 2005-11-30.
$70,000, same as above.Signed on 2005-12-01. Completion date: 2005-11-30.
VIP SENSORS, CO (302 CALLE PAISANO; small business) : $948,653 in 5 contractsfrom 2004 to 2006
Contracts for Defense Aircraft -- Applied Research and Exploratory Development (R&D), Defense Aircraft -- Management and Support (R&D), Defense Missile and Space Systems -- Basic Research (R&D) by Air Force, Missile Defense Agency Signed by year:2000: $0; 2001: $0; 2002: $0; 2003: $0; 2004: $199,974; 2005: $375,000; 2006: $373,679.
Biggest contracts:
$375,000 with Air Force for Defense Aircraft -- Applied Research and Exploratory Development (R&D). Signed on 2005-05-16. Completion date: 2007-03-12.
$323,679, same as above.Signed on 2006-04-04. Completion date: 2007-03-12.
$99,998 with Air Force for Defense Aircraft -- Management and Support (R&D). Signed on 2004-04-07. Completion date: 2005-01-10.
$99,976 with Missile Defense Agency for Defense Missile and Space Systems -- Basic Research (R&D). Signed on 2004-05-21. Completion date: 2004-11-27.
QPC FIBER OPTIC (915 CALLE AMANECER STE D; small business) : $465,638 in 15 contractsfrom 2000 to 2006
Contracts for Headsets, Handsets, Microphones and Speakers, Fiber Optic Kits And Sets, Fiber Optic Cable Assemblies and Harnesses, Fiber Optic Cables, and moreby Defense Logistics Agency, Navy Signed by year:2000: $67,426; 2001: $110,899; 2002: $35,728; 2003: $120,432; 2004: $69,186; 2005: $52,457; 2006: $9,510.
Biggest contracts:
$110,899 with Defense Logistics Agency for Headsets, Handsets, Microphones and Speakers. Signed on 2001-10-15. Completion date: 2002-01-17.
$45,687 with Defense Logistics Agency for Fiber Optic Kits And Sets. Signed on 2003-12-15. Completion date: 2004-01-05.
$40,615 with Navy for Fiber Optic Cable Assemblies and Harnesses. Signed on 2003-09-18. Completion date: 2003-11-06.
$35,728 with Navy for Fiber Optic Cables. Signed on 2002-12-31. Completion date: 2003-02-24.
ALLIANT SOLUTIONS, INC (181 AVENIDA LA PATA; small business) : $420,346 in 12 contractsfrom 2000 to 2003
Contracts for ADP Input/Output and Storage Devices, Office Supplies, Photographic Projection Equipment, Installation of Equipment -- Automatic Data Processing Equipment (Including Firmware), Software, Supplies and Support Equipment, and moreby Federal Technology Service, Navy, Army Signed by year:2000: $88,320; 2001: $110,813; 2002: $152,321; 2003: $68,892; 2004: $0; 2005: $0; 2006: $0.
Biggest contracts:
$117,000 with Federal Technology Service for ADP Input/Output and Storage Devices. Signed on 2002-03-15. Completion date: 2002-04-15.
$69,264 with Navy for Office Supplies. Signed on 2001-07-19. Completion date: 2001-08-31.
$61,225 with Navy for Photographic Projection Equipment. Signed on 2000-02-16. Completion date: 2000-02-25.
$41,549 with Navy for Installation of Equipment -- Automatic Data Processing Equipment (Including Firmware), Software, Supplies and Support Equipment. Signed on 2001-08-24. Completion date: 2001-08-23.
ELOTEK SYSTEMS, INC (1001 CALLE NEGOCIO STE B; small business) : $333,187 in 16 contractsfrom 2004 to 2006
Contracts for Radio and Television Communication Equipment, Except Airborne, Miscellaneous Communication Equipment, Radio Navigation Equipment, Airborne, Radio and Television Communication Equipment, Airborne, and moreby Air Force, Army Signed by year:2000: $0; 2001: $0; 2002: $0; 2003: $0; 2004: $23,673; 2005: $66,428; 2006: $243,086.
Biggest contracts:
$69,510 with Air Force for Radio and Television Communication Equipment, Except Airborne. Signed on 2006-03-07. Completion date: 2006-06-22.
$36,486 with Air Force for Miscellaneous Communication Equipment. Signed on 2006-06-12. Completion date: 2006-07-07.
$28,541 with Air Force for Radio Navigation Equipment, Airborne. Signed on 2006-03-23. Completion date: 2006-05-19.
$28,073 with Air Force for Radio and Television Communication Equipment, Airborne. Signed on 2006-04-24. Completion date: 2006-05-26.
ALLIANT SOLUTIONS INC (181 AVENIDA LA PATA; small business) : $88,936 in 9 contractsfrom 2003 to 2005
Contracts for Electronic Modules, ADP Support Equipment, Sound Recording and Reproducing Equipment, Radio and Television Communication Equipment, Except Airborne, and moreby Navy, Air Force, Minerals Management Service, National Oceanic and Atmospheric Administration/Under Secretary for Oceans and Atmosphere, and others Signed by year:2000: $0; 2001: $0; 2002: $0; 2003: $29,161; 2004: $9,964; 2005: $49,811; 2006: $0.
Biggest contracts:
$21,360 with Navy for Electronic Modules. Signed on 2003-09-16. Completion date: 2003-10-13.
$17,977 with Air Force for ADP Support Equipment. Signed on 2005-09-30. Completion date: 2005-10-29.
$17,630 with Air Force for Sound Recording and Reproducing Equipment. Signed on 2005-09-26. Completion date: 2005-10-24.
$14,204 with Air Force for Radio and Television Communication Equipment, Except Airborne. Signed on 2005-06-28. Completion date: 2005-07-24.
Top industries in this zip code by the number of employees in 2005:


+$2,182
-$7,562
 Nearest zip codes: 92675, 92672, 92624, 92694, 92629, 92677.