Estimated zip code population in 2022: 7,973 Zip code population in 2010: 8,337 Zip code population in 2000: 8,657
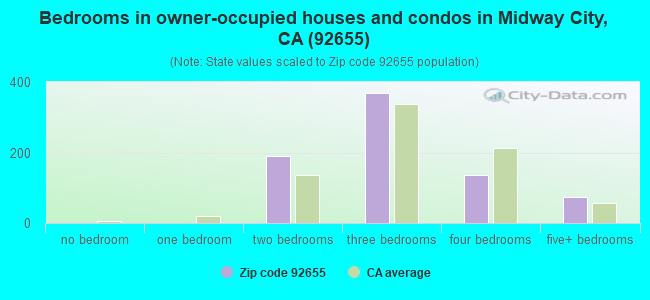
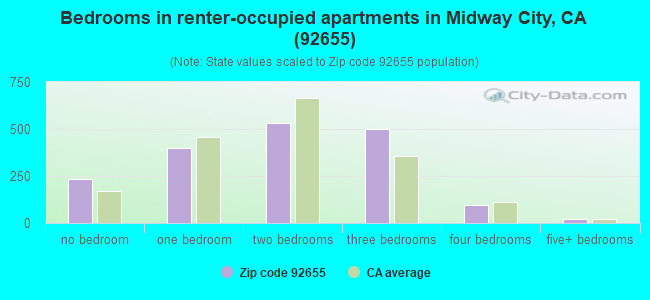
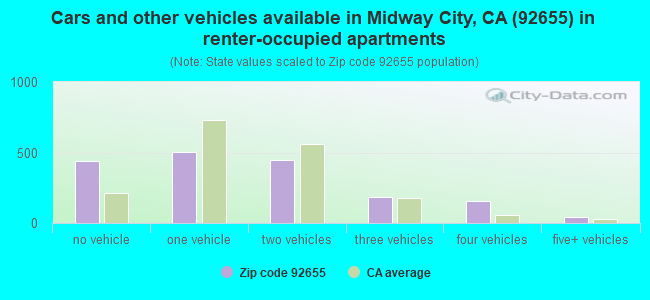
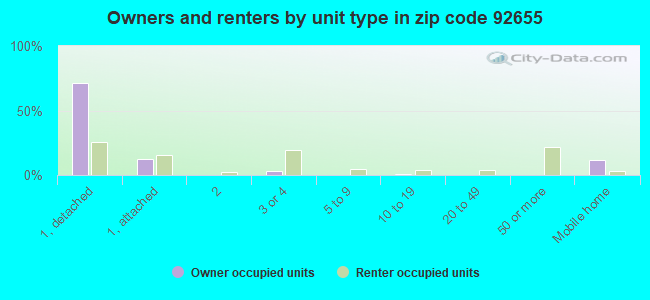
Houses and condos: 2,776 Renter-occupied apartments: 1,777
% of renters here:
70%
State:
44%
March 2022 cost of living index in zip code 92655: 88.8 (less than average, U.S. average is 100)
Land area: 0.6 sq. mi. Water area: 0.0 sq. mi.
Population density: 12,642 people per square mile
(very high).
OSM Map
General Map
Google Map
MSN Map
OSM Map
General Map
Google Map
MSN Map
OSM Map
General Map
Google Map
MSN Map
OSM Map
General Map
Google Map
MSN Map
Please wait while loading the map...
Real estate property taxes paid for housing units in 2022:
This zip code:
0.6% ($4,661)
California:
0.7% ($4,831)
Median real estate property taxes paid for housing units with mortgages in 2022: $5,029 (0.6%) Median real estate property taxes paid for housing units with no mortgage in 2022: $4,463 (0.7%)
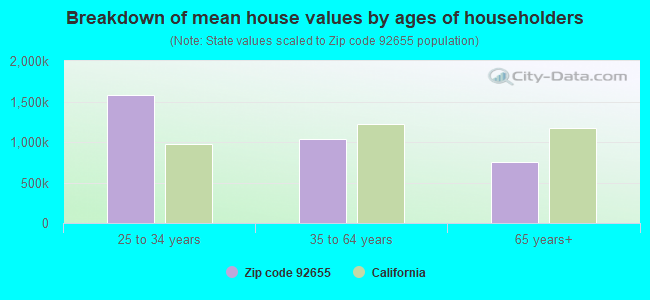
Estimated median house/condo value in 2022: $745,978
92655:
$745,978
California:
$715,900
According to our research of California and other state lists, there were 5 registered sex offenders living in 92655 zip code as of May 21, 2024. The ratio of all residents to sex offenders in zip code 92655 is 1,878 to 1. The ratio of registered sex offenders to all residents in this zip code is lower than the state average.
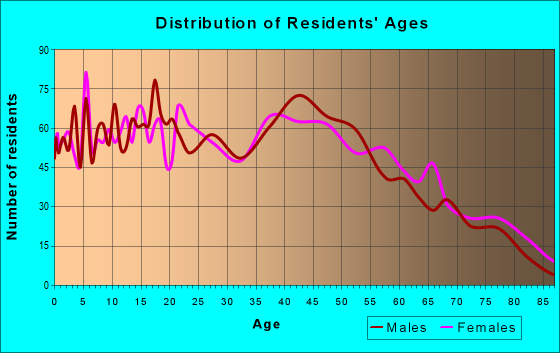
Median resident age:
This zip code:
41.2 years
California median age:
37.9 years
Average household size:
This zip code:
3.1 people
California:
2.8 people
Averages for the 2020 tax year for zip code 92655, filed in 2021:
Average Adjusted Gross Income (AGI) in 2020: $39,848 (Individual Income Tax Returns)
Here:
$39,848
State:
$95,910
Salary/wage: $35,434 (reported on 78.4% of returns)
Here:
$35,434
State:
$77,331
(% of AGI for various income ranges: 1073.7% for AGIs below $25k, 3976.8% for AGIs $25k-50k, 8374.8% for AGIs $50k-75k, 10580.7% for AGIs $75k-100k, 17744.2% for AGIs $100k-200k)
Taxable interest for individuals: $886 (reported on 18.7% of returns)
This zip code:
$886
California:
$2,294
(% of AGI for various income ranges: 4.7% for AGIs below $25k, 19.5% for AGIs $25k-50k, 26.1% for AGIs $50k-75k, 65.3% for AGIs $75k-100k, 124.2% for AGIs $100k-200k)
Ordinary dividends: $1,218 (reported on 7.8% of returns)
Here:
$1,218
State:
$10,949
(% of AGI for various income ranges: 4.4% for AGIs below $25k, 11.3% for AGIs $25k-50k, 33.9% for AGIs $50k-75k, 34.0% for AGIs $75k-100k, 79.2% for AGIs $100k-200k)
Net capital gain/loss in AGI: +$6,306 (reported on 12.3% of returns)
Here:
+$6,306
State:
+$49,306
(% of AGI for various income ranges: 3.5% for AGIs below $25k, 24.5% for AGIs $25k-50k, 89.0% for AGIs $50k-75k, 310.7% for AGIs $75k-100k, 1905.0% for AGIs $100k-200k)
Profit/loss from business: +$6,555 (reported on 23.0% of returns)
Here:
+$6,555
State:
+$15,671
(% of AGI for various income ranges: 213.8% for AGIs below $25k, 240.1% for AGIs $25k-50k, 228.7% for AGIs $50k-75k, 36.7% for AGIs $75k-100k, 751.7% for AGIs $100k-200k)
Taxable individual retirement arrangement distribution: $17,645 (reported on 2.6% of returns)
92655:
$17,645
California:
$23,505
(% of AGI for various income ranges: 12.3% for AGIs below $25k, 30.5% for AGIs $25k-50k, 259.0% for AGIs $50k-75k, 605.8% for AGIs $100k-200k)
Total itemized deductions: $25,771 (reported on 5.7% of returns)
Here:
$25,771
State:
$39,517
(% of AGI for various income ranges: 156.4% for AGIs $25k-50k, 342.6% for AGIs $50k-75k, 628.7% for AGIs $75k-100k, 2375.8% for AGIs $100k-200k)
Charity contributions: $5,205 (reported on 4.5% of returns)
Here:
$5,205
State:
$12,598
(% of AGI for various income ranges: 14.7% for AGIs $25k-50k, 28.7% for AGIs $50k-75k, 118.7% for AGIs $75k-100k, 497.5% for AGIs $100k-200k)
Taxes paid: $7,525 (reported on 5.7% of returns)
92655:
$7,525
State:
$8,807
(% of AGI for various income ranges: 43.5% for AGIs $25k-50k, 107.1% for AGIs $50k-75k, 208.0% for AGIs $75k-100k, 660.0% for AGIs $100k-200k)
Earned income credit: $1,841 (reported on 23.9% of returns)
Here:
$1,841
State:
$2,074
(% of AGI for various income ranges: 90.0% for AGIs below $25k, 87.4% for AGIs $25k-50k)
Percentage of individuals using paid preparers for their 2020 taxes: 92.9%
Here:
93%
State:
92%
(% for various income ranges: 91.8% for AGIs below $25k, 94.4% for AGIs $25k-50k, 92.5% for AGIs $50k-75k, 91.3% for AGIs $75k-100k, 95.5% for AGIs $100k-200k, 100.0% for AGIs over 200k)
Averages for the 2012 tax year for zip code 92655, filed in 2013:
Average Adjusted Gross Income (AGI) in 2012: $32,412 (Individual Income Tax Returns)
Here:
$32,412
State:
$72,726
Salary/wage: $32,086 (reported on 81.5% of returns)
Here:
$32,086
State:
$59,079
(% of AGI for various income ranges: 71.1% for AGIs below $25k, 86.9% for AGIs $25k-50k, 84.4% for AGIs $50k-75k, 80.8% for AGIs $75k-100k, 78.0% for AGIs $100k-200k)
Taxable interest for individuals: $439 (reported on 19.9% of returns)
This zip code:
$439
California:
$2,146
(% of AGI for various income ranges: 0.3% for AGIs below $25k, 0.3% for AGIs $25k-50k, 0.3% for AGIs $50k-75k, 0.2% for AGIs $75k-100k, 0.2% for AGIs $100k-200k)
Ordinary dividends: $1,372 (reported on 5.0% of returns)
Here:
$1,372
State:
$9,308
(% of AGI for various income ranges: 0.3% for AGIs $25k-50k, 0.2% for AGIs $50k-75k, 0.3% for AGIs $100k-200k)
Profit/loss from business: +$8,638 (reported on 24.1% of returns)
Here:
+$8,638
State:
+$17,064
(% of AGI for various income ranges: 20.2% for AGIs below $25k, 4.1% for AGIs $25k-50k, 2.7% for AGIs $50k-75k, 4.3% for AGIs $75k-100k)
Taxable individual retirement arrangement distribution: $14,133 (reported on 3.4% of returns)
92655:
$14,133
California:
$19,557
(% of AGI for various income ranges: 0.7% for AGIs below $25k, 0.9% for AGIs $25k-50k, 2.0% for AGIs $50k-75k, 5.1% for AGIs $75k-100k)
Total itemized deductions: $20,437 (29% of AGI, reported on 18.8% of returns)
Here:
$20,437
State:
$34,004
Here:
29.0% of AGI
State:
22.7% of AGI
(% of AGI for various income ranges: 4.8% for AGIs below $25k, 9.4% for AGIs $25k-50k, 14.7% for AGIs $50k-75k, 17.6% for AGIs $75k-100k, 16.3% for AGIs $100k-200k)
Charity contributions: $2,251 (reported on 14.3% of returns)
Here:
$2,251
State:
$4,659
(% of AGI for various income ranges: 0.3% for AGIs below $25k, 0.7% for AGIs $25k-50k, 1.3% for AGIs $50k-75k, 1.6% for AGIs $75k-100k, 1.5% for AGIs $100k-200k)
Taxes paid: $6,190 (reported on 18.8% of returns)
92655:
$6,190
State:
$14,448
(% of AGI for various income ranges: 0.9% for AGIs below $25k, 2.1% for AGIs $25k-50k, 4.1% for AGIs $50k-75k, 5.6% for AGIs $75k-100k, 6.9% for AGIs $100k-200k)
Earned income credit: $2,326 (reported on 33.3% of returns)
Here:
$2,326
State:
$2,286
(% of AGI for various income ranges: 9.3% for AGIs below $25k, 1.6% for AGIs $25k-50k)
Percentage of individuals using paid preparers for their 2012 taxes: 73.1%
Here:
73%
State:
64%
(% for various income ranges: 73.7% for AGIs below $25k, 73.7% for AGIs $25k-50k, 68.6% for AGIs $50k-75k, 77.8% for AGIs $75k-100k, 66.7% for AGIs $100k-200k)
Averages for the 2004 tax year for zip code 92655, filed in 2005:
Average Adjusted Gross Income (AGI) in 2004: $30,337 (Individual Income Tax Returns)
Here:
$30,337
State:
$58,600
Salary/wage: $30,212 (reported on 86.3% of returns)
Here:
$30,212
State:
$49,455
(% of AGI for various income ranges: 141.4% for AGIs below $10k, 81.7% for AGIs $10k-25k, 89.9% for AGIs $25k-50k, 85.7% for AGIs $50k-75k, 87.0% for AGIs $75k-100k, 74.2% for AGIs over 100k)
Taxable interest for individuals: $667 (reported on 29.2% of returns)
This zip code:
$667
California:
$2,365
(% of AGI for various income ranges: 2.9% for AGIs below $10k, 0.5% for AGIs $10k-25k, 0.4% for AGIs $25k-50k, 0.7% for AGIs $50k-75k, 0.6% for AGIs $75k-100k, 0.9% for AGIs over 100k)
Taxable dividends: $1,119 (reported on 8.8% of returns)
Here:
$1,119
State:
$4,746
(% of AGI for various income ranges: 0.4% for AGIs below $10k, 0.3% for AGIs $10k-25k, 0.3% for AGIs $25k-50k, 0.5% for AGIs $50k-75k, 0.2% for AGIs $75k-100k, 0.3% for AGIs over 100k)
Net capital gain/loss: +$4,802 (reported on 8.3% of returns)
Here:
+$4,802
State:
+$23,418
(% of AGI for various income ranges: -1.7% for AGIs below $10k, -0.2% for AGIs $10k-25k, -0.2% for AGIs $25k-50k, -0.1% for AGIs $50k-75k, 0.6% for AGIs $75k-100k, 9.3% for AGIs over 100k)
Profit/loss from business: +$7,767 (reported on 18.6% of returns)
Here:
+$7,767
State:
+$16,826
(% of AGI for various income ranges: 45.3% for AGIs below $10k, 9.8% for AGIs $10k-25k, 2.9% for AGIs $25k-50k, 3.1% for AGIs $50k-75k, 1.5% for AGIs $75k-100k, 1.9% for AGIs over 100k)
IRA payment deduction: $2,825 (reported on 1.8% of returns)
92655:
$2,825
California:
$3,192
Total itemized deductions: $19,316 (34% of AGI, reported on 26.2% of returns)
Here:
$19,316
State:
$28,113
Here:
33.6% of AGI
State:
25.3% of AGI
(% of AGI for various income ranges: 13.0% for AGIs below $10k, 8.5% for AGIs $10k-25k, 14.5% for AGIs $25k-50k, 19.6% for AGIs $50k-75k, 20.7% for AGIs $75k-100k, 24.0% for AGIs over 100k)
Charity contributions deductions: $2,076 (3% of AGI, reported on 21.8% of returns)
Here:
$2,076
State:
$3,923
Here:
3.4% of AGI
State:
3.3% of AGI
(% of AGI for various income ranges: 0.2% for AGIs below $10k, 0.4% for AGIs $10k-25k, 1.2% for AGIs $25k-50k, 2.2% for AGIs $50k-75k, 2.4% for AGIs $75k-100k, 1.9% for AGIs over 100k)
Total tax: $3,497 (reported on 67.2% of returns)
92655:
$3,497
State:
$10,761
(% of AGI for various income ranges: 9.3% for AGIs below $10k, 3.7% for AGIs $10k-25k, 5.9% for AGIs $25k-50k, 8.0% for AGIs $50k-75k, 10.1% for AGIs $75k-100k, 13.9% for AGIs over 100k)
Earned income credit: $1,834 (reported on 27.5% of returns)
Here:
$1,834
State:
$1,763
Percentage of individuals using paid preparers for their 2004 taxes: 67.0%
Here:
67%
State:
66%
(% for various income ranges: 61.3% for AGIs below $10k, 67.8% for AGIs $10k-25k, 68.5% for AGIs $25k-50k, 68.1% for AGIs $50k-75k, 71.3% for AGIs $75k-100k, 77.1% for AGIs over 100k)
Household received Food Stamps/SNAP in the past 12 months: 909 Household did not receive Food Stamps/SNAP in the past 12 months: 1,769
Women who had a birth in the past 12 months: 49 (48 now married, 0 unmarried) Women who did not have a birth in the past 12 months: 1,859 (740 now married, 1,119 unmarried)
Housing units in zip code 92655 with a mortgage: 419 (53 second mortgage, 55 both second mortgage and home equity loan) Houses without a mortgage: 14
Median monthly owner costs for units with a mortgage: $2,607 Median monthly owner costs for units without a mortgage: $664
Residents with income below the poverty level in 2022:
This zip code:
18.1%
Whole state:
12.2%
Residents with income below 50% of the poverty level in 2022:
This zip code:
7.9%
Whole state:
6.2%
Median number of rooms in houses and condos:
Here:
5.5
State:
6.0
Median number of rooms in apartments:
Here:
3.9
State:
3.9
Notable locations in this zip code not listed on our city pages
989 married couples with children.
329 single-parent households (19 men, 310 women).
28.9% of residents of 92655 zip code speak English at home.
26.2% of residents speak Spanish at home (52% very well, 21% well, 15% not well, 13% not at all).
1.7% of residents speak other Indo-European language at home (62% very well, 14% well, 11% not well, 13% not at all).
41.2% of residents speak Asian or Pacific Island language at home (31% very well, 27% well, 32% not well, 11% not at all).
1.9% of residents speak other language at home (83% very well, 17% well).
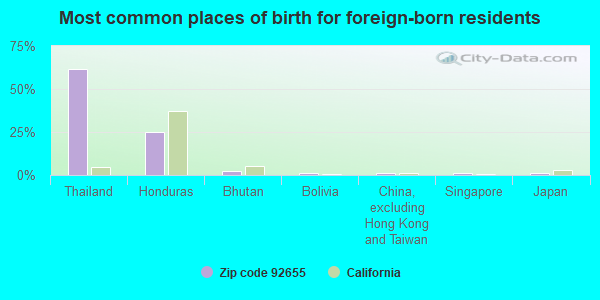
Foreign born population: 3,848 (48.3%) (73.9% of them are naturalized citizens)
This zip code:
48.3%
Whole state:
26.7%
62%Thailand
25%Honduras
2%Bhutan
1%Bolivia
1%China, excluding Hong Kong and Taiwan
1%Singapore
1%Japan
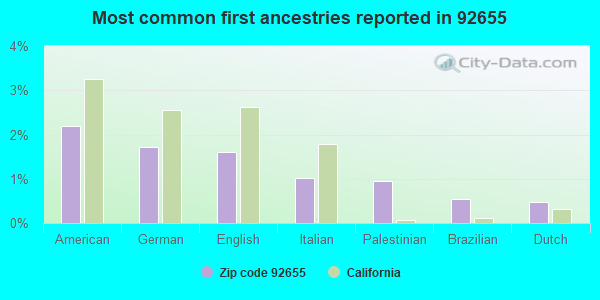
2%American
2%German
2%English
1%Italian
1%Palestinian
1%Brazilian
0%Dutch
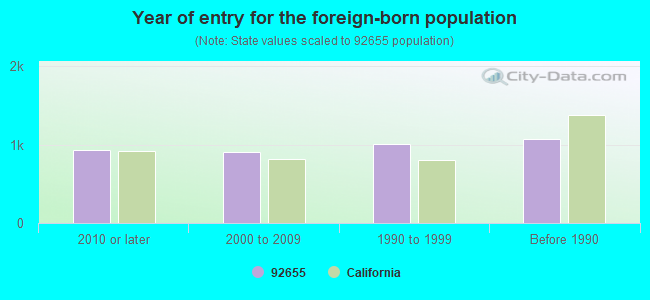
Year of entry for the foreign-born population
9332010 or later
9102000 to 2009
1,0021990 to 1999
1,067Before 1990
Facilities with environmental interests located in this zip code:
JET PERFORMANCE AUTO CTR (7852 BOLSA AVE in MIDWAY CITY, CA)
STATE MASTER (California - Hazardous Waste Tracking) - HAZARDOU WASTE PROGRAM Small Quantity Generators, between 100 kg and 1000 kg of hazardous waste/month (Resource Conservation and Recovery Act (tracking hazardous waste)) - notification
HAYDEN (JESSIE) ELEMENTARY (14782 EDEN ST in MIDWAY CITY, CA)
(National Center for Education Statistics) - STATE ID-6030829 Organizations: WESTMINSTER ELEMENTARY (SCHOOL DISTRICT)
MIDWAY INDUSTRIES (15112 ADAMS ST in MIDWAY CITY, CA)
Small Quantity Generators, between 100 kg and 1000 kg of hazardous waste/month (Resource Conservation and Recovery Act (tracking hazardous waste)) - notification Organizations: HAYS MICHAEL (CONTACT/OWNER)
GOLD HAND AUTO BODY AND REPAIR (15032 JACKSON ST in MIDWAY CITY, CA)
Small Quantity Generators, between 100 kg and 1000 kg of hazardous waste/month (Resource Conservation and Recovery Act (tracking hazardous waste)) - notification Organizations: TRUANG VAN TUAN (CONTACT/OWNER)
FRONTERA TECHNOLOGY CO (15191 JACKSON ST in MIDWAY CITY, CA)
COMPLIANCE ACTIVITY (Tracking inspections of insecticide, fungicide, and rodenticide, and toxic substances)
MIDWAY COLLISION & REPAIR, L. (15111 VAN BUREN in MIDWAY CITY, CA)
CRITERIA AND HAZARDOUS AIR POLLUTANT INVENTORY (Inventory of air pollution sources) Business SIC classification: GENERAL AUTOMOTIVE REPAIR SHOPS
Housing units lacking complete plumbing facilities: 0.4% Housing units lacking complete kitchen facilities: 7.5%
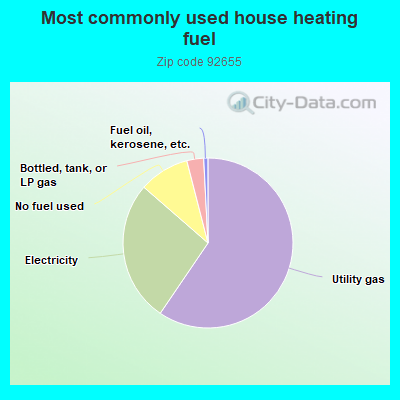
59.5%Utility gas
26.9%Electricity
9.6%No fuel used
3.2%Bottled, tank, or LP gas
0.8%Fuel oil, kerosene, etc.
Population in 1990: 6,224. Population change in the 1990s: +2,433 (+39.1%).
Place of birth for U.S.-born residents:
This state: 3,705
Northeast: 46
Midwest: 227
South: 99
West: 23
46% of the 92655 zip code residents lived in the same house 5 years ago. Out of people who lived in different houses, 77% lived in this county. Out of people who lived in different counties, 50% lived in California.
91% of the 92655 zip code residents lived in the same house 1 year ago. Out of people who lived in different houses, 86% moved from this county. Out of people who lived in different houses, 5% moved from different county within same state. Out of people who lived in different houses, 7% moved from abroad.
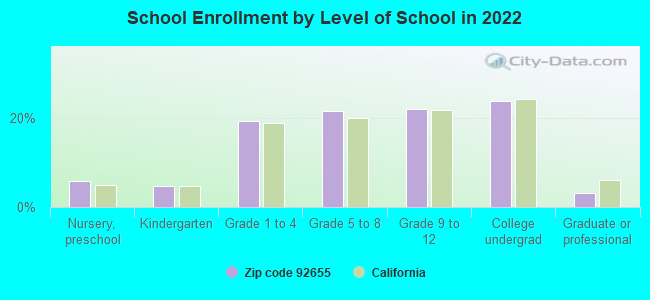
Private vs. public school enrollment:
Students in private schools in grades 1 to 8 (elementary and middle school): 136
Here:
16.5%
California:
10.5%
Students in private schools in grades 9 to 12 (high school):
Here:
0.0%
California:
8.5%
Students in private undergraduate colleges:
Here:
0.0%
California:
15.9%
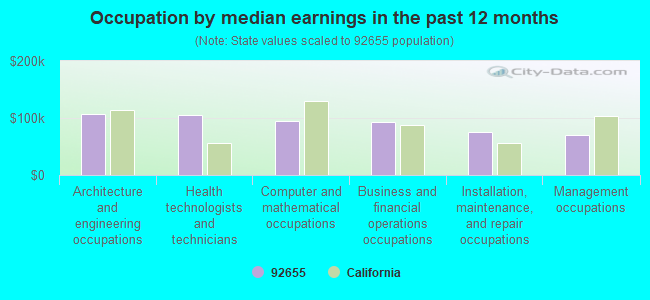
Occupation by median earnings in the past 12 months ($)
106,878Architecture and engineering occupations
104,806Health technologists and technicians
94,623Computer and mathematical occupations
93,308Business and financial operations occupations
76,109Installation, maintenance, and repair occupations
70,293Management occupations
Top industries in this zip code by the number of employees in 2005:
Health Care and Social Assistance: Child Day Care Services (50-99 employees: 1 establishment)
Accommodation and Food Services: Limited-Service Restaurants (20-49: 1)
Other Services (except Public Administration): General Automotive Repair (5-9: 1, 1-4: 6)
Health Care and Social Assistance: Temporary Shelters (10-19: 1, 1-4: 1)
Construction: Commercial and Institutional Building Construction (10-19: 1, 1-4: 1)
Educational Services: Cosmetology and Barber Schools (10-19: 1)
Information: Cable and Other Subscription Programming (10-19: 1)
People in group quarters in 2010:
85 people in emergency and transitional shelters (with sleeping facilities) for people experiencing homelessness
13 people in other noninstitutional facilities
5 people in group homes intended for adults
People in group quarters in 2000:
45 people in other noninstitutional group quarters
27 people in homes for the mentally retarded
17 people in homes or halfway houses for drug/alcohol abuse
7 people in religious group quarters
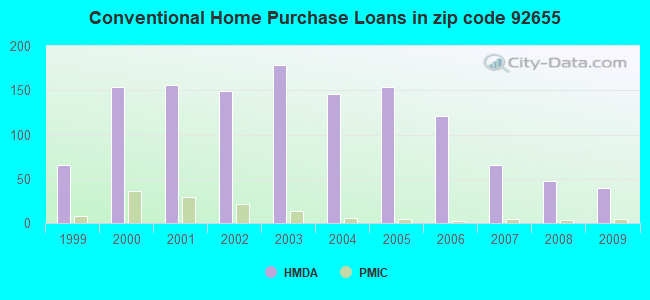
Home Mortgage Disclosure Act Aggregated Statistics For Year 2009 (Based on 4 partial tracts)
A) FHA, FSA/RHS & VA Home Purchase Loans
B) Conventional Home Purchase Loans
C) Refinancings
D) Home Improvement Loans
E) Loans on Dwellings For 5+ Families
F) Non-occupant Loans on < 5 Family Dwellings (A B C & D)
G) Loans On Manufactured Home Dwelling (A B C & D)
Number
Average Value
Number
Average Value
Number
Average Value
Number
Average Value
Number
Average Value
Number
Average Value
Number
Average Value
LOANS ORIGINATED
3
$300,870
40
$301,639
141
$281,675
8
$172,072
0
$0
19
$298,052
2
$111,325
APPLICATIONS APPROVED, NOT ACCEPTED
2
$355,485
6
$276,950
26
$292,473
1
$26,550
0
$0
6
$229,297
0
$0
APPLICATIONS DENIED
2
$365,440
13
$308,285
71
$322,896
4
$130,662
0
$0
15
$362,593
2
$58,900
APPLICATIONS WITHDRAWN
1
$357,650
9
$310,254
26
$303,650
3
$149,340
1
$7,773,350
6
$272,667
0
$0
FILES CLOSED FOR INCOMPLETENESS
0
$0
4
$232,912
9
$318,374
0
$0
0
$0
1
$168,080
0
$0
Aggregated Statistics For Year 2008 (Based on 4 partial tracts)
A) FHA, FSA/RHS & VA Home Purchase Loans
B) Conventional Home Purchase Loans
C) Refinancings
D) Home Improvement Loans
E) Loans on Dwellings For 5+ Families
F) Non-occupant Loans on < 5 Family Dwellings (A B C & D)
G) Loans On Manufactured Home Dwelling (A B C & D)
Number
Average Value
Number
Average Value
Number
Average Value
Number
Average Value
Number
Average Value
Number
Average Value
Number
Average Value
LOANS ORIGINATED
3
$327,867
48
$299,011
68
$290,361
5
$218,246
2
$805,460
16
$277,519
0
$0
APPLICATIONS APPROVED, NOT ACCEPTED
0
$0
15
$289,370
21
$304,521
3
$103,910
0
$0
2
$355,485
4
$116,638
APPLICATIONS DENIED
1
$444,670
15
$294,723
51
$379,664
12
$208,999
1
$1,128,260
6
$298,397
1
$59,760
APPLICATIONS WITHDRAWN
2
$302,495
13
$346,858
26
$348,705
5
$195,282
2
$812,865
4
$312,590
0
$0
FILES CLOSED FOR INCOMPLETENESS
0
$0
2
$220,405
9
$310,079
4
$194,918
0
$0
2
$246,805
0
$0
Aggregated Statistics For Year 2007 (Based on 4 partial tracts)
B) Conventional Home Purchase Loans
C) Refinancings
D) Home Improvement Loans
E) Loans on Dwellings For 5+ Families
F) Non-occupant Loans on < 5 Family Dwellings (A B C & D)
G) Loans On Manufactured Home Dwelling (A B C & D)
Number
Average Value
Number
Average Value
Number
Average Value
Number
Average Value
Number
Average Value
Number
Average Value
LOANS ORIGINATED
65
$323,958
160
$343,718
26
$262,629
2
$666,460
27
$380,223
5
$62,916
APPLICATIONS APPROVED, NOT ACCEPTED
19
$254,414
49
$343,683
3
$274,933
0
$0
7
$383,531
4
$76,822
APPLICATIONS DENIED
41
$292,850
106
$374,141
21
$160,054
0
$0
7
$413,964
6
$66,775
APPLICATIONS WITHDRAWN
13
$354,443
41
$351,722
6
$190,848
0
$0
7
$388,653
0
$0
FILES CLOSED FOR INCOMPLETENESS
4
$226,410
19
$394,028
2
$139,010
0
$0
1
$345,940
1
$53,920
Aggregated Statistics For Year 2006 (Based on 4 partial tracts)
B) Conventional Home Purchase Loans
C) Refinancings
D) Home Improvement Loans
E) Loans on Dwellings For 5+ Families
F) Non-occupant Loans on < 5 Family Dwellings (A B C & D)
G) Loans On Manufactured Home Dwelling (A B C & D)
Number
Average Value
Number
Average Value
Number
Average Value
Number
Average Value
Number
Average Value
Number
Average Value
LOANS ORIGINATED
121
$323,694
246
$360,667
37
$211,635
4
$315,158
53
$360,426
3
$42,733
APPLICATIONS APPROVED, NOT ACCEPTED
38
$266,386
56
$370,383
4
$188,642
0
$0
9
$346,956
5
$61,698
APPLICATIONS DENIED
49
$369,304
120
$387,675
23
$227,647
0
$0
23
$346,807
1
$21,570
APPLICATIONS WITHDRAWN
42
$335,467
72
$344,140
10
$179,816
0
$0
13
$318,405
0
$0
FILES CLOSED FOR INCOMPLETENESS
9
$323,983
20
$346,040
1
$455,690
0
$0
4
$402,818
0
$0
Aggregated Statistics For Year 2005 (Based on 4 partial tracts)
B) Conventional Home Purchase Loans
C) Refinancings
D) Home Improvement Loans
E) Loans on Dwellings For 5+ Families
F) Non-occupant Loans on < 5 Family Dwellings (A B C & D)
G) Loans On Manufactured Home Dwelling (A B C & D)
Number
Average Value
Number
Average Value
Number
Average Value
Number
Average Value
Number
Average Value
Number
Average Value
LOANS ORIGINATED
154
$333,196
277
$321,704
37
$231,453
2
$1,153,560
52
$366,229
0
$0
APPLICATIONS APPROVED, NOT ACCEPTED
48
$305,972
74
$337,042
6
$273,673
0
$0
18
$433,508
2
$70,515
APPLICATIONS DENIED
45
$316,903
85
$325,418
26
$160,678
0
$0
10
$397,786
9
$66,250
APPLICATIONS WITHDRAWN
23
$276,260
95
$323,224
10
$320,555
0
$0
13
$363,780
2
$23,230
FILES CLOSED FOR INCOMPLETENESS
12
$312,212
40
$362,298
2
$71,580
0
$0
3
$474,313
0
$0
Aggregated Statistics For Year 2004 (Based on 4 partial tracts)
B) Conventional Home Purchase Loans
C) Refinancings
D) Home Improvement Loans
E) Loans on Dwellings For 5+ Families
F) Non-occupant Loans on < 5 Family Dwellings (A B C & D)
G) Loans On Manufactured Home Dwelling (A B C & D)
Number
Average Value
Number
Average Value
Number
Average Value
Number
Average Value
Number
Average Value
Number
Average Value
LOANS ORIGINATED
146
$288,783
358
$261,008
33
$177,067
2
$725,900
51
$320,054
2
$60,145
APPLICATIONS APPROVED, NOT ACCEPTED
25
$261,640
67
$272,525
10
$233,105
0
$0
9
$271,297
1
$24,890
APPLICATIONS DENIED
34
$311,010
104
$286,384
26
$140,436
0
$0
3
$476,963
3
$87,937
APPLICATIONS WITHDRAWN
11
$328,775
125
$263,885
12
$153,635
0
$0
6
$319,745
0
$0
FILES CLOSED FOR INCOMPLETENESS
4
$427,038
45
$280,838
3
$153,897
0
$0
3
$186,940
0
$0
Aggregated Statistics For Year 2003 (Based on 4 partial tracts)
A) FHA, FSA/RHS & VA Home Purchase Loans
B) Conventional Home Purchase Loans
C) Refinancings
D) Home Improvement Loans
E) Loans on Dwellings For 5+ Families
F) Non-occupant Loans on < 5 Family Dwellings (A B C & D)
Number
Average Value
Number
Average Value
Number
Average Value
Number
Average Value
Number
Average Value
Number
Average Value
LOANS ORIGINATED
1
$185,830
178
$230,114
785
$205,275
15
$105,209
4
$1,110,380
74
$206,336
APPLICATIONS APPROVED, NOT ACCEPTED
0
$0
34
$236,363
163
$212,021
6
$134,197
0
$0
11
$239,786
APPLICATIONS DENIED
0
$0
59
$231,865
175
$205,976
14
$68,155
1
$1,908,080
27
$247,075
APPLICATIONS WITHDRAWN
1
$149,410
21
$202,516
150
$216,679
5
$73,180
0
$0
10
$221,848
FILES CLOSED FOR INCOMPLETENESS
2
$160,940
7
$257,067
28
$200,045
0
$0
0
$0
4
$131,948
Aggregated Statistics For Year 2002 (Based on 4 partial tracts)
A) FHA, FSA/RHS & VA Home Purchase Loans
B) Conventional Home Purchase Loans
C) Refinancings
D) Home Improvement Loans
E) Loans on Dwellings For 5+ Families
F) Non-occupant Loans on < 5 Family Dwellings (A B C & D)
Number
Average Value
Number
Average Value
Number
Average Value
Number
Average Value
Number
Average Value
Number
Average Value
LOANS ORIGINATED
5
$223,510
149
$207,366
496
$195,572
20
$42,241
3
$976,730
39
$218,795
APPLICATIONS APPROVED, NOT ACCEPTED
1
$204,500
27
$201,951
98
$190,280
3
$38,587
0
$0
7
$181,969
APPLICATIONS DENIED
2
$268,700
43
$165,403
115
$167,432
12
$26,883
1
$233,450
8
$131,634
APPLICATIONS WITHDRAWN
0
$0
29
$205,600
103
$184,204
5
$68,658
0
$0
11
$275,013
FILES CLOSED FOR INCOMPLETENESS
0
$0
8
$203,135
37
$200,516
2
$35,015
0
$0
1
$242,790
Aggregated Statistics For Year 2001 (Based on 4 partial tracts)
A) FHA, FSA/RHS & VA Home Purchase Loans
B) Conventional Home Purchase Loans
C) Refinancings
D) Home Improvement Loans
E) Loans on Dwellings For 5+ Families
F) Non-occupant Loans on < 5 Family Dwellings (A B C & D)
Number
Average Value
Number
Average Value
Number
Average Value
Number
Average Value
Number
Average Value
Number
Average Value
LOANS ORIGINATED
5
$223,438
156
$184,497
433
$174,049
18
$50,916
2
$552,365
31
$183,556
APPLICATIONS APPROVED, NOT ACCEPTED
1
$200,770
26
$156,730
74
$166,406
6
$27,613
0
$0
6
$156,657
APPLICATIONS DENIED
3
$146,917
34
$208,640
118
$162,358
14
$37,843
0
$0
4
$122,415
APPLICATIONS WITHDRAWN
1
$193,300
22
$182,128
128
$168,977
5
$36,804
0
$0
5
$111,322
FILES CLOSED FOR INCOMPLETENESS
1
$193,300
4
$183,312
30
$156,778
1
$16,590
0
$0
0
$0
Aggregated Statistics For Year 2000 (Based on 4 partial tracts)
A) FHA, FSA/RHS & VA Home Purchase Loans
B) Conventional Home Purchase Loans
C) Refinancings
D) Home Improvement Loans
E) Loans on Dwellings For 5+ Families
F) Non-occupant Loans on < 5 Family Dwellings (A B C & D)
Number
Average Value
Number
Average Value
Number
Average Value
Number
Average Value
Number
Average Value
Number
Average Value
LOANS ORIGINATED
12
$193,030
154
$155,751
93
$126,399
27
$33,559
1
$295,080
16
$182,829
APPLICATIONS APPROVED, NOT ACCEPTED
2
$122,205
45
$175,952
17
$113,759
9
$39,767
0
$0
3
$105,313
APPLICATIONS DENIED
0
$0
44
$132,005
50
$114,094
16
$33,865
0
$0
10
$108,694
APPLICATIONS WITHDRAWN
3
$168,397
22
$153,552
33
$110,145
0
$0
0
$0
2
$221,780
FILES CLOSED FOR INCOMPLETENESS
0
$0
12
$134,592
12
$137,951
1
$20,740
0
$0
2
$106,920
Aggregated Statistics For Year 1999 (Based on 1 partial tract)
A) FHA, FSA/RHS & VA Home Purchase Loans
B) Conventional Home Purchase Loans
C) Refinancings
D) Home Improvement Loans
E) Loans on Dwellings For 5+ Families
F) Non-occupant Loans on < 5 Family Dwellings (A B C & D)


 Nearest zip codes: 92683, 92844, 92647, 92841, 92708, 92845.