Estimated zip code population in 2022: 44,550
Zip code population in 2010: 39,076
Zip code population in 2000: 12,726
Houses and condos: 12,262
Renter-occupied apartments: 2,710
% of renters here:
23%State:
44%
March 2022 cost of living index in zip code 92555: 82.2
(low, U.S. average is 100)
Land area: 80.7
sq. mi.
Water area: 3.1
sq. mi.
Population density: 552 people per square mile (low).
OSM Map
General Map
Google Map
MSN Map
OSM Map
General Map
Google Map
MSN Map
OSM Map
General Map
Google Map
MSN Map
OSM Map
General Map
Google Map
MSN Map
Please wait while loading the map...
Real estate property taxes paid for housing units in 2022:
This zip code:
0.9% ($4,628)California:
0.7% ($4,831)
Median real estate property taxes paid for housing units with mortgages in 2022: $4,807 (0.9%)
Median real estate property taxes paid for housing units with no mortgage in 2022: $3,820 (0.8%)
Profiles of local businesses
Business Search - 14 Million verified businesses
Males: 21,937 Females: 22,613
For population 25 years and over in 92555:
High school or higher: 85.6%Bachelor's degree or higher: 24.2%Graduate or professional degree: 8.5%Unemployed: 5.6%Mean travel time to work (commute): 40.4 minutes
For population 15 years and over in 92555:
Never married: 38.3%Now married: 48.8%Separated: 1.7%Widowed: 3.4%Divorced: 7.7%
Zip code 92555 compared to state average:
Black race population percentage significantly above state average. Renting percentage below state average. Number of rooms per house above state average. House age significantly below state average. Percentage of population with a bachelor's degree or higher below state average. 22,082 49.6% Hispanic or Latino 9,038 20.3% Black 8,398 18.9% White 3,200 7.2% Asian 1,314 2.9% Two or more races 289 0.6% Native Hawaiian and Other 195 0.4% Some other race 30 0.07% American Indian
Data:
Median household income ($)
Median household income (% change since 2000)
Household income diversity
Ratio of average income to average house value (%)
Ratio of average income to average rent
Median household income ($) - White
Median household income ($) - Black or African American
Median household income ($) - Asian
Median household income ($) - Hispanic or Latino
Median household income ($) - American Indian and Alaska Native
Median household income ($) - Multirace
Median household income ($) - Other Race
Median household income for houses/condos with a mortgage ($)
Median household income for apartments without a mortgage ($)
Races - White alone (%)
Races - White alone (% change since 2000)
Races - Black alone (%)
Races - Black alone (% change since 2000)
Races - American Indian alone (%)
Races - American Indian alone (% change since 2000)
Races - Asian alone (%)
Races - Asian alone (% change since 2000)
Races - Hispanic (%)
Races - Hispanic (% change since 2000)
Races - Native Hawaiian and Other Pacific Islander alone (%)
Races - Native Hawaiian and Other Pacific Islander alone (% change since 2000)
Races - Two or more races (%)
Races - Two or more races (% change since 2000)
Races - Other race alone (%)
Races - Other race alone (% change since 2000)
Racial diversity
Unemployment (%)
Unemployment (% change since 2000)
Unemployment (%) - White
Unemployment (%) - Black or African American
Unemployment (%) - Asian
Unemployment (%) - Hispanic or Latino
Unemployment (%) - American Indian and Alaska Native
Unemployment (%) - Multirace
Unemployment (%) - Other Race
Population density (people per square mile)
Population - Males (%)
Population - Females (%)
Population - Males (%) - White
Population - Males (%) - Black or African American
Population - Males (%) - Asian
Population - Males (%) - Hispanic or Latino
Population - Males (%) - American Indian and Alaska Native
Population - Males (%) - Multirace
Population - Males (%) - Other Race
Population - Females (%) - White
Population - Females (%) - Black or African American
Population - Females (%) - Asian
Population - Females (%) - Hispanic or Latino
Population - Females (%) - American Indian and Alaska Native
Population - Females (%) - Multirace
Population - Females (%) - Other Race
Coronavirus confirmed cases (May 06, 2024)
Deaths caused by coronavirus (May 06, 2024)
Coronavirus confirmed cases (per 100k population) (May 06, 2024)
Deaths caused by coronavirus (per 100k population) (May 06, 2024)
Daily increase in number of cases (May 06, 2024)
Weekly increase in number of cases (May 06, 2024)
Cases doubled (in days) (May 06, 2024)
Hospitalized patients (Apr 18, 2022)
Negative test results (Apr 18, 2022)
Total test results (Apr 18, 2022)
COVID Vaccine doses distributed (per 100k population) (Sep 19, 2023)
COVID Vaccine doses administered (per 100k population) (Sep 19, 2023)
COVID Vaccine doses distributed (Sep 19, 2023)
COVID Vaccine doses administered (Sep 19, 2023)
Likely homosexual households (%)
Likely homosexual households (% change since 2000)
Likely homosexual households - Lesbian couples (%)
Likely homosexual households - Lesbian couples (% change since 2000)
Likely homosexual households - Gay men (%)
Likely homosexual households - Gay men (% change since 2000)
Cost of living index
Median gross rent ($)
Median contract rent ($)
Median monthly housing costs ($)
Median house or condo value ($)
Median house or condo value ($ change since 2000)
Mean house or condo value by units in structure - 1, detached ($)
Mean house or condo value by units in structure - 1, attached ($)
Mean house or condo value by units in structure - 2 ($)
Mean house or condo value by units in structure by units in structure - 3 or 4 ($)
Mean house or condo value by units in structure - 5 or more ($)
Mean house or condo value by units in structure - Boat, RV, van, etc. ($)
Mean house or condo value by units in structure - Mobile home ($)
Median house or condo value ($) - White
Median house or condo value ($) - Black or African American
Median house or condo value ($) - Asian
Median house or condo value ($) - Hispanic or Latino
Median house or condo value ($) - American Indian and Alaska Native
Median house or condo value ($) - Multirace
Median house or condo value ($) - Other Race
Median resident age
Resident age diversity
Median resident age - Males
Median resident age - Females
Median resident age - White
Median resident age - Black or African American
Median resident age - Asian
Median resident age - Hispanic or Latino
Median resident age - American Indian and Alaska Native
Median resident age - Multirace
Median resident age - Other Race
Median resident age - Males - White
Median resident age - Males - Black or African American
Median resident age - Males - Asian
Median resident age - Males - Hispanic or Latino
Median resident age - Males - American Indian and Alaska Native
Median resident age - Males - Multirace
Median resident age - Males - Other Race
Median resident age - Females - White
Median resident age - Females - Black or African American
Median resident age - Females - Asian
Median resident age - Females - Hispanic or Latino
Median resident age - Females - American Indian and Alaska Native
Median resident age - Females - Multirace
Median resident age - Females - Other Race
Commute - mean travel time to work (minutes)
Travel time to work - Less than 5 minutes (%)
Travel time to work - Less than 5 minutes (% change since 2000)
Travel time to work - 5 to 9 minutes (%)
Travel time to work - 5 to 9 minutes (% change since 2000)
Travel time to work - 10 to 19 minutes (%)
Travel time to work - 10 to 19 minutes (% change since 2000)
Travel time to work - 20 to 29 minutes (%)
Travel time to work - 20 to 29 minutes (% change since 2000)
Travel time to work - 30 to 39 minutes (%)
Travel time to work - 30 to 39 minutes (% change since 2000)
Travel time to work - 40 to 59 minutes (%)
Travel time to work - 40 to 59 minutes (% change since 2000)
Travel time to work - 60 to 89 minutes (%)
Travel time to work - 60 to 89 minutes (% change since 2000)
Travel time to work - 90 or more minutes (%)
Travel time to work - 90 or more minutes (% change since 2000)
Marital status - Never married (%)
Marital status - Now married (%)
Marital status - Separated (%)
Marital status - Widowed (%)
Marital status - Divorced (%)
Median family income ($)
Median family income (% change since 2000)
Median non-family income ($)
Median non-family income (% change since 2000)
Median per capita income ($)
Median per capita income (% change since 2000)
Median family income ($) - White
Median family income ($) - Black or African American
Median family income ($) - Asian
Median family income ($) - Hispanic or Latino
Median family income ($) - American Indian and Alaska Native
Median family income ($) - Multirace
Median family income ($) - Other Race
Median year house/condo built
Median year apartment built
Year house built - Built 2005 or later (%)
Year house built - Built 2000 to 2004 (%)
Year house built - Built 1990 to 1999 (%)
Year house built - Built 1980 to 1989 (%)
Year house built - Built 1970 to 1979 (%)
Year house built - Built 1960 to 1969 (%)
Year house built - Built 1950 to 1959 (%)
Year house built - Built 1940 to 1949 (%)
Year house built - Built 1939 or earlier (%)
Average household size
Household density (households per square mile)
Average household size - White
Average household size - Black or African American
Average household size - Asian
Average household size - Hispanic or Latino
Average household size - American Indian and Alaska Native
Average household size - Multirace
Average household size - Other Race
Occupied housing units (%)
Vacant housing units (%)
Owner occupied housing units (%)
Renter occupied housing units (%)
Vacancy status - For rent (%)
Vacancy status - For sale only (%)
Vacancy status - Rented or sold, not occupied (%)
Vacancy status - For seasonal, recreational, or occasional use (%)
Vacancy status - For migrant workers (%)
Vacancy status - Other vacant (%)
Residents with income below the poverty level (%)
Residents with income below 50% of the poverty level (%)
Children below poverty level (%)
Poor families by family type - Married-couple family (%)
Poor families by family type - Male, no wife present (%)
Poor families by family type - Female, no husband present (%)
Poverty status for native-born residents (%)
Poverty status for foreign-born residents (%)
Poverty among high school graduates not in families (%)
Poverty among people who did not graduate high school not in families (%)
Residents with income below the poverty level (%) - White
Residents with income below the poverty level (%) - Black or African American
Residents with income below the poverty level (%) - Asian
Residents with income below the poverty level (%) - Hispanic or Latino
Residents with income below the poverty level (%) - American Indian and Alaska Native
Residents with income below the poverty level (%) - Multirace
Residents with income below the poverty level (%) - Other Race
Air pollution - Air Quality Index (AQI)
Air pollution - CO
Air pollution - NO2
Air pollution - SO2
Air pollution - Ozone
Air pollution - PM10
Air pollution - PM25
Air pollution - Pb
Crime - Murders per 100,000 population
Crime - Rapes per 100,000 population
Crime - Robberies per 100,000 population
Crime - Assaults per 100,000 population
Crime - Burglaries per 100,000 population
Crime - Thefts per 100,000 population
Crime - Auto thefts per 100,000 population
Crime - Arson per 100,000 population
Crime - City-data.com crime index
Crime - Violent crime index
Crime - Property crime index
Crime - Murders per 100,000 population (5 year average)
Crime - Rapes per 100,000 population (5 year average)
Crime - Robberies per 100,000 population (5 year average)
Crime - Assaults per 100,000 population (5 year average)
Crime - Burglaries per 100,000 population (5 year average)
Crime - Thefts per 100,000 population (5 year average)
Crime - Auto thefts per 100,000 population (5 year average)
Crime - Arson per 100,000 population (5 year average)
Crime - City-data.com crime index (5 year average)
Crime - Violent crime index (5 year average)
Crime - Property crime index (5 year average)
1996 Presidential Elections Results (%) - Democratic Party (Clinton)
1996 Presidential Elections Results (%) - Republican Party (Dole)
1996 Presidential Elections Results (%) - Other
2000 Presidential Elections Results (%) - Democratic Party (Gore)
2000 Presidential Elections Results (%) - Republican Party (Bush)
2000 Presidential Elections Results (%) - Other
2004 Presidential Elections Results (%) - Democratic Party (Kerry)
2004 Presidential Elections Results (%) - Republican Party (Bush)
2004 Presidential Elections Results (%) - Other
2008 Presidential Elections Results (%) - Democratic Party (Obama)
2008 Presidential Elections Results (%) - Republican Party (McCain)
2008 Presidential Elections Results (%) - Other
2012 Presidential Elections Results (%) - Democratic Party (Obama)
2012 Presidential Elections Results (%) - Republican Party (Romney)
2012 Presidential Elections Results (%) - Other
2016 Presidential Elections Results (%) - Democratic Party (Clinton)
2016 Presidential Elections Results (%) - Republican Party (Trump)
2016 Presidential Elections Results (%) - Other
2020 Presidential Elections Results (%) - Democratic Party (Biden)
2020 Presidential Elections Results (%) - Republican Party (Trump)
2020 Presidential Elections Results (%) - Other
Ancestries Reported - Arab (%)
Ancestries Reported - Czech (%)
Ancestries Reported - Danish (%)
Ancestries Reported - Dutch (%)
Ancestries Reported - English (%)
Ancestries Reported - French (%)
Ancestries Reported - French Canadian (%)
Ancestries Reported - German (%)
Ancestries Reported - Greek (%)
Ancestries Reported - Hungarian (%)
Ancestries Reported - Irish (%)
Ancestries Reported - Italian (%)
Ancestries Reported - Lithuanian (%)
Ancestries Reported - Norwegian (%)
Ancestries Reported - Polish (%)
Ancestries Reported - Portuguese (%)
Ancestries Reported - Russian (%)
Ancestries Reported - Scotch-Irish (%)
Ancestries Reported - Scottish (%)
Ancestries Reported - Slovak (%)
Ancestries Reported - Subsaharan African (%)
Ancestries Reported - Swedish (%)
Ancestries Reported - Swiss (%)
Ancestries Reported - Ukrainian (%)
Ancestries Reported - United States (%)
Ancestries Reported - Welsh (%)
Ancestries Reported - West Indian (%)
Ancestries Reported - Other (%)
Educational Attainment - No schooling completed (%)
Educational Attainment - Less than high school (%)
Educational Attainment - High school or equivalent (%)
Educational Attainment - Less than 1 year of college (%)
Educational Attainment - 1 or more years of college (%)
Educational Attainment - Associate degree (%)
Educational Attainment - Bachelor's degree (%)
Educational Attainment - Master's degree (%)
Educational Attainment - Professional school degree (%)
Educational Attainment - Doctorate degree (%)
School Enrollment - Nursery, preschool (%)
School Enrollment - Kindergarten (%)
School Enrollment - Grade 1 to 4 (%)
School Enrollment - Grade 5 to 8 (%)
School Enrollment - Grade 9 to 12 (%)
School Enrollment - College undergrad (%)
School Enrollment - Graduate or professional (%)
School Enrollment - Not enrolled in school (%)
School enrollment - Public schools (%)
School enrollment - Private schools (%)
School enrollment - Not enrolled (%)
Median number of rooms in houses and condos
Median number of rooms in apartments
Housing units lacking complete plumbing facilities (%)
Housing units lacking complete kitchen facilities (%)
Density of houses
Urban houses (%)
Rural houses (%)
Households with people 60 years and over (%)
Households with people 65 years and over (%)
Households with people 75 years and over (%)
Households with one or more nonrelatives (%)
Households with no nonrelatives (%)
Population in households (%)
Family households (%)
Nonfamily households (%)
Population in families (%)
Family households with own children (%)
Median number of bedrooms in owner occupied houses
Mean number of bedrooms in owner occupied houses
Median number of bedrooms in renter occupied houses
Mean number of bedrooms in renter occupied houses
Median number of vehichles in owner occupied houses
Mean number of vehichles in owner occupied houses
Median number of vehichles in renter occupied houses
Mean number of vehichles in renter occupied houses
Mortgage status - with mortgage (%)
Mortgage status - with second mortgage (%)
Mortgage status - with home equity loan (%)
Mortgage status - with both second mortgage and home equity loan (%)
Mortgage status - without a mortgage (%)
Average family size
Average family size - White
Average family size - Black or African American
Average family size - Asian
Average family size - Hispanic or Latino
Average family size - American Indian and Alaska Native
Average family size - Multirace
Average family size - Other Race
Geographical mobility - Same house 1 year ago (%)
Geographical mobility - Moved within same county (%)
Geographical mobility - Moved from different county within same state (%)
Geographical mobility - Moved from different state (%)
Geographical mobility - Moved from abroad (%)
Place of birth - Born in state of residence (%)
Place of birth - Born in other state (%)
Place of birth - Native, outside of US (%)
Place of birth - Foreign born (%)
Housing units in structures - 1, detached (%)
Housing units in structures - 1, attached (%)
Housing units in structures - 2 (%)
Housing units in structures - 3 or 4 (%)
Housing units in structures - 5 to 9 (%)
Housing units in structures - 10 to 19 (%)
Housing units in structures - 20 to 49 (%)
Housing units in structures - 50 or more (%)
Housing units in structures - Mobile home (%)
Housing units in structures - Boat, RV, van, etc. (%)
House/condo owner moved in on average (years ago)
Renter moved in on average (years ago)
Year householder moved into unit - Moved in 1999 to March 2000 (%)
Year householder moved into unit - Moved in 1995 to 1998 (%)
Year householder moved into unit - Moved in 1990 to 1994 (%)
Year householder moved into unit - Moved in 1980 to 1989 (%)
Year householder moved into unit - Moved in 1970 to 1979 (%)
Year householder moved into unit - Moved in 1969 or earlier (%)
Means of transportation to work - Drove car alone (%)
Means of transportation to work - Carpooled (%)
Means of transportation to work - Public transportation (%)
Means of transportation to work - Bus or trolley bus (%)
Means of transportation to work - Streetcar or trolley car (%)
Means of transportation to work - Subway or elevated (%)
Means of transportation to work - Railroad (%)
Means of transportation to work - Ferryboat (%)
Means of transportation to work - Taxicab (%)
Means of transportation to work - Motorcycle (%)
Means of transportation to work - Bicycle (%)
Means of transportation to work - Walked (%)
Means of transportation to work - Other means (%)
Working at home (%)
Industry diversity
Most Common Industries - Agriculture, forestry, fishing and hunting, and mining (%)
Most Common Industries - Agriculture, forestry, fishing and hunting (%)
Most Common Industries - Mining, quarrying, and oil and gas extraction (%)
Most Common Industries - Construction (%)
Most Common Industries - Manufacturing (%)
Most Common Industries - Wholesale trade (%)
Most Common Industries - Retail trade (%)
Most Common Industries - Transportation and warehousing, and utilities (%)
Most Common Industries - Transportation and warehousing (%)
Most Common Industries - Utilities (%)
Most Common Industries - Information (%)
Most Common Industries - Finance and insurance, and real estate and rental and leasing (%)
Most Common Industries - Finance and insurance (%)
Most Common Industries - Real estate and rental and leasing (%)
Most Common Industries - Professional, scientific, and management, and administrative and waste management services (%)
Most Common Industries - Professional, scientific, and technical services (%)
Most Common Industries - Management of companies and enterprises (%)
Most Common Industries - Administrative and support and waste management services (%)
Most Common Industries - Educational services, and health care and social assistance (%)
Most Common Industries - Educational services (%)
Most Common Industries - Health care and social assistance (%)
Most Common Industries - Arts, entertainment, and recreation, and accommodation and food services (%)
Most Common Industries - Arts, entertainment, and recreation (%)
Most Common Industries - Accommodation and food services (%)
Most Common Industries - Other services, except public administration (%)
Most Common Industries - Public administration (%)
Occupation diversity
Most Common Occupations - Management, business, science, and arts occupations (%)
Most Common Occupations - Management, business, and financial occupations (%)
Most Common Occupations - Management occupations (%)
Most Common Occupations - Business and financial operations occupations (%)
Most Common Occupations - Computer, engineering, and science occupations (%)
Most Common Occupations - Computer and mathematical occupations (%)
Most Common Occupations - Architecture and engineering occupations (%)
Most Common Occupations - Life, physical, and social science occupations (%)
Most Common Occupations - Education, legal, community service, arts, and media occupations (%)
Most Common Occupations - Community and social service occupations (%)
Most Common Occupations - Legal occupations (%)
Most Common Occupations - Education, training, and library occupations (%)
Most Common Occupations - Arts, design, entertainment, sports, and media occupations (%)
Most Common Occupations - Healthcare practitioners and technical occupations (%)
Most Common Occupations - Health diagnosing and treating practitioners and other technical occupations (%)
Most Common Occupations - Health technologists and technicians (%)
Most Common Occupations - Service occupations (%)
Most Common Occupations - Healthcare support occupations (%)
Most Common Occupations - Protective service occupations (%)
Most Common Occupations - Fire fighting and prevention, and other protective service workers including supervisors (%)
Most Common Occupations - Law enforcement workers including supervisors (%)
Most Common Occupations - Food preparation and serving related occupations (%)
Most Common Occupations - Building and grounds cleaning and maintenance occupations (%)
Most Common Occupations - Personal care and service occupations (%)
Most Common Occupations - Sales and office occupations (%)
Most Common Occupations - Sales and related occupations (%)
Most Common Occupations - Office and administrative support occupations (%)
Most Common Occupations - Natural resources, construction, and maintenance occupations (%)
Most Common Occupations - Farming, fishing, and forestry occupations (%)
Most Common Occupations - Construction and extraction occupations (%)
Most Common Occupations - Installation, maintenance, and repair occupations (%)
Most Common Occupations - Production, transportation, and material moving occupations (%)
Most Common Occupations - Production occupations (%)
Most Common Occupations - Transportation occupations (%)
Most Common Occupations - Material moving occupations (%)
People in Group quarters - Institutionalized population (%)
People in Group quarters - Correctional institutions (%)
People in Group quarters - Federal prisons and detention centers (%)
People in Group quarters - Halfway houses (%)
People in Group quarters - Local jails and other confinement facilities (including police lockups) (%)
People in Group quarters - Military disciplinary barracks (%)
People in Group quarters - State prisons (%)
People in Group quarters - Other types of correctional institutions (%)
People in Group quarters - Nursing homes (%)
People in Group quarters - Hospitals/wards, hospices, and schools for the handicapped (%)
People in Group quarters - Hospitals/wards and hospices for chronically ill (%)
People in Group quarters - Hospices or homes for chronically ill (%)
People in Group quarters - Military hospitals or wards for chronically ill (%)
People in Group quarters - Other hospitals or wards for chronically ill (%)
People in Group quarters - Hospitals or wards for drug/alcohol abuse (%)
People in Group quarters - Mental (Psychiatric) hospitals or wards (%)
People in Group quarters - Schools, hospitals, or wards for the mentally retarded (%)
People in Group quarters - Schools, hospitals, or wards for the physically handicapped (%)
People in Group quarters - Institutions for the deaf (%)
People in Group quarters - Institutions for the blind (%)
People in Group quarters - Orthopedic wards and institutions for the physically handicapped (%)
People in Group quarters - Wards in general hospitals for patients who have no usual home elsewhere (%)
People in Group quarters - Wards in military hospitals for patients who have no usual home elsewhere (%)
People in Group quarters - Juvenile institutions (%)
People in Group quarters - Long-term care (%)
People in Group quarters - Homes for abused, dependent, and neglected children (%)
People in Group quarters - Residential treatment centers for emotionally disturbed children (%)
People in Group quarters - Training schools for juvenile delinquents (%)
People in Group quarters - Short-term care, detention or diagnostic centers for delinquent children (%)
People in Group quarters - Type of juvenile institution unknown (%)
People in Group quarters - Noninstitutionalized population (%)
People in Group quarters - College dormitories (includes college quarters off campus) (%)
People in Group quarters - Military quarters (%)
People in Group quarters - On base (%)
People in Group quarters - Barracks, unaccompanied personnel housing (UPH), (Enlisted/Officer), ;and similar group living quarters for military personnel (%)
People in Group quarters - Transient quarters for temporary residents (%)
People in Group quarters - Military ships (%)
People in Group quarters - Group homes (%)
People in Group quarters - Homes or halfway houses for drug/alcohol abuse (%)
People in Group quarters - Homes for the mentally ill (%)
People in Group quarters - Homes for the mentally retarded (%)
People in Group quarters - Homes for the physically handicapped (%)
People in Group quarters - Other group homes (%)
People in Group quarters - Religious group quarters (%)
People in Group quarters - Dormitories (%)
People in Group quarters - Agriculture workers' dormitories on farms (%)
People in Group quarters - Job Corps and vocational training facilities (%)
People in Group quarters - Other workers' dormitories (%)
People in Group quarters - Crews of maritime vessels (%)
People in Group quarters - Other nonhousehold living situations (%)
People in Group quarters - Other noninstitutional group quarters (%)
Residents speaking English at home (%)
Residents speaking English at home - Born in the United States (%)
Residents speaking English at home - Native, born elsewhere (%)
Residents speaking English at home - Foreign born (%)
Residents speaking Spanish at home (%)
Residents speaking Spanish at home - Born in the United States (%)
Residents speaking Spanish at home - Native, born elsewhere (%)
Residents speaking Spanish at home - Foreign born (%)
Residents speaking other language at home (%)
Residents speaking other language at home - Born in the United States (%)
Residents speaking other language at home - Native, born elsewhere (%)
Residents speaking other language at home - Foreign born (%)
Class of Workers - Employee of private company (%)
Class of Workers - Self-employed in own incorporated business (%)
Class of Workers - Private not-for-profit wage and salary workers (%)
Class of Workers - Local government workers (%)
Class of Workers - State government workers (%)
Class of Workers - Federal government workers (%)
Class of Workers - Self-employed workers in own not incorporated business and Unpaid family workers (%)
House heating fuel used in houses and condos - Utility gas (%)
House heating fuel used in houses and condos - Bottled, tank, or LP gas (%)
House heating fuel used in houses and condos - Electricity (%)
House heating fuel used in houses and condos - Fuel oil, kerosene, etc. (%)
House heating fuel used in houses and condos - Coal or coke (%)
House heating fuel used in houses and condos - Wood (%)
House heating fuel used in houses and condos - Solar energy (%)
House heating fuel used in houses and condos - Other fuel (%)
House heating fuel used in houses and condos - No fuel used (%)
House heating fuel used in apartments - Utility gas (%)
House heating fuel used in apartments - Bottled, tank, or LP gas (%)
House heating fuel used in apartments - Electricity (%)
House heating fuel used in apartments - Fuel oil, kerosene, etc. (%)
House heating fuel used in apartments - Coal or coke (%)
House heating fuel used in apartments - Wood (%)
House heating fuel used in apartments - Solar energy (%)
House heating fuel used in apartments - Other fuel (%)
House heating fuel used in apartments - No fuel used (%)
Armed forces status - In Armed Forces (%)
Armed forces status - Civilian (%)
Armed forces status - Civilian - Veteran (%)
Armed forces status - Civilian - Nonveteran (%)
Fatal accidents locations in years 2005-2021
Fatal accidents locations in 2005
Fatal accidents locations in 2006
Fatal accidents locations in 2007
Fatal accidents locations in 2008
Fatal accidents locations in 2009
Fatal accidents locations in 2010
Fatal accidents locations in 2011
Fatal accidents locations in 2012
Fatal accidents locations in 2013
Fatal accidents locations in 2014
Fatal accidents locations in 2015
Fatal accidents locations in 2016
Fatal accidents locations in 2017
Fatal accidents locations in 2018
Fatal accidents locations in 2019
Fatal accidents locations in 2020
Fatal accidents locations in 2021
Alcohol use - People drinking some alcohol every month (%)
Alcohol use - People not drinking at all (%)
Alcohol use - Average days/month drinking alcohol
Alcohol use - Average drinks/week
Alcohol use - Average days/year people drink much
Audiometry - Average condition of hearing (%)
Audiometry - People that can hear a whisper from across a quiet room (%)
Audiometry - People that can hear normal voice from across a quiet room (%)
Audiometry - Ears ringing, roaring, buzzing (%)
Audiometry - Had a job exposure to loud noise (%)
Audiometry - Had off-work exposure to loud noise (%)
Blood Pressure & Cholesterol - Has high blood pressure (%)
Blood Pressure & Cholesterol - Checking blood pressure at home (%)
Blood Pressure & Cholesterol - Frequently checking blood cholesterol (%)
Blood Pressure & Cholesterol - Has high cholesterol level (%)
Consumer Behavior - Money monthly spent on food at supermarket/grocery store
Consumer Behavior - Money monthly spent on food at other stores
Consumer Behavior - Money monthly spent on eating out
Consumer Behavior - Money monthly spent on carryout/delivered foods
Consumer Behavior - Income spent on food at supermarket/grocery store (%)
Consumer Behavior - Income spent on food at other stores (%)
Consumer Behavior - Income spent on eating out (%)
Consumer Behavior - Income spent on carryout/delivered foods (%)
Current Health Status - General health condition (%)
Current Health Status - Blood donors (%)
Current Health Status - Has blood ever tested for HIV virus (%)
Current Health Status - Left-handed people (%)
Dermatology - People using sunscreen (%)
Diabetes - Diabetics (%)
Diabetes - Had a blood test for high blood sugar (%)
Diabetes - People taking insulin (%)
Diet Behavior & Nutrition - Diet health (%)
Diet Behavior & Nutrition - Milk product consumption (# of products/month)
Diet Behavior & Nutrition - Meals not home prepared (#/week)
Diet Behavior & Nutrition - Meals from fast food or pizza place (#/week)
Diet Behavior & Nutrition - Ready-to-eat foods (#/month)
Diet Behavior & Nutrition - Frozen meals/pizza (#/month)
Drug Use - People that ever used marijuana or hashish (%)
Drug Use - Ever used hard drugs (%)
Drug Use - Ever used any form of cocaine (%)
Drug Use - Ever used heroin (%)
Drug Use - Ever used methamphetamine (%)
Health Insurance - People covered by health insurance (%)
Kidney Conditions-Urology - Avg. # of times urinating at night
Medical Conditions - People with asthma (%)
Medical Conditions - People with anemia (%)
Medical Conditions - People with psoriasis (%)
Medical Conditions - People with overweight (%)
Medical Conditions - Elderly people having difficulties in thinking or remembering (%)
Medical Conditions - People who ever received blood transfusion (%)
Medical Conditions - People having trouble seeing even with glass/contacts (%)
Medical Conditions - People with arthritis (%)
Medical Conditions - People with gout (%)
Medical Conditions - People with congestive heart failure (%)
Medical Conditions - People with coronary heart disease (%)
Medical Conditions - People with angina pectoris (%)
Medical Conditions - People who ever had heart attack (%)
Medical Conditions - People who ever had stroke (%)
Medical Conditions - People with emphysema (%)
Medical Conditions - People with thyroid problem (%)
Medical Conditions - People with chronic bronchitis (%)
Medical Conditions - People with any liver condition (%)
Medical Conditions - People who ever had cancer or malignancy (%)
Mental Health - People who have little interest in doing things (%)
Mental Health - People feeling down, depressed, or hopeless (%)
Mental Health - People who have trouble sleeping or sleeping too much (%)
Mental Health - People feeling tired or having little energy (%)
Mental Health - People with poor appetite or overeating (%)
Mental Health - People feeling bad about themself (%)
Mental Health - People who have trouble concentrating on things (%)
Mental Health - People moving or speaking slowly or too fast (%)
Mental Health - People having thoughts they would be better off dead (%)
Oral Health - Average years since last visit a dentist
Oral Health - People embarrassed because of mouth (%)
Oral Health - People with gum disease (%)
Oral Health - General health of teeth and gums (%)
Oral Health - Average days a week using dental floss/device
Oral Health - Average days a week using mouthwash for dental problem
Oral Health - Average number of teeth
Pesticide Use - Households using pesticides to control insects (%)
Pesticide Use - Households using pesticides to kill weeds (%)
Physical Activity - People doing vigorous-intensity work activities (%)
Physical Activity - People doing moderate-intensity work activities (%)
Physical Activity - People walking or bicycling (%)
Physical Activity - People doing vigorous-intensity recreational activities (%)
Physical Activity - People doing moderate-intensity recreational activities (%)
Physical Activity - Average hours a day doing sedentary activities
Physical Activity - Average hours a day watching TV or videos
Physical Activity - Average hours a day using computer
Physical Functioning - People having limitations keeping them from working (%)
Physical Functioning - People limited in amount of work they can do (%)
Physical Functioning - People that need special equipment to walk (%)
Physical Functioning - People experiencing confusion/memory problems (%)
Physical Functioning - People requiring special healthcare equipment (%)
Prescription Medications - Average number of prescription medicines taking
Preventive Aspirin Use - Adults 40+ taking low-dose aspirin (%)
Reproductive Health - Vaginal deliveries (%)
Reproductive Health - Cesarean deliveries (%)
Reproductive Health - Deliveries resulted in a live birth (%)
Reproductive Health - Pregnancies resulted in a delivery (%)
Reproductive Health - Women breastfeeding newborns (%)
Reproductive Health - Women that had a hysterectomy (%)
Reproductive Health - Women that had both ovaries removed (%)
Reproductive Health - Women that have ever taken birth control pills (%)
Reproductive Health - Women taking birth control pills (%)
Reproductive Health - Women that have ever used Depo-Provera or injectables (%)
Reproductive Health - Women that have ever used female hormones (%)
Sexual Behavior - People 18+ that ever had sex (vaginal, anal, or oral) (%)
Sexual Behavior - Males 18+ that ever had vaginal sex with a woman (%)
Sexual Behavior - Males 18+ that ever performed oral sex on a woman (%)
Sexual Behavior - Males 18+ that ever had anal sex with a woman (%)
Sexual Behavior - Males 18+ that ever had any sex with a man (%)
Sexual Behavior - Females 18+ that ever had vaginal sex with a man (%)
Sexual Behavior - Females 18+ that ever performed oral sex on a man (%)
Sexual Behavior - Females 18+ that ever had anal sex with a man (%)
Sexual Behavior - Females 18+ that ever had any kind of sex with a woman (%)
Sexual Behavior - Average age people first had sex
Sexual Behavior - Average number of female sex partners in lifetime (males 18+)
Sexual Behavior - Average number of female vaginal sex partners in lifetime (males 18+)
Sexual Behavior - Average age people first performed oral sex on a woman (18+)
Sexual Behavior - Average number of woman performed oral sex on in lifetime (18+)
Sexual Behavior - Average number of male sex partners in lifetime (males 18+)
Sexual Behavior - Average number of male anal sex partners in lifetime (males 18+)
Sexual Behavior - Average age people first performed oral sex on a man (18+)
Sexual Behavior - Average number of male oral sex partners in lifetime (18+)
Sexual Behavior - People using protection when performing oral sex (%)
Sexual Behavior - Average number of times people have vaginal or anal sex a year
Sexual Behavior - People having sex without condom (%)
Sexual Behavior - Average number of male sex partners in lifetime (females 18+)
Sexual Behavior - Average number of male vaginal sex partners in lifetime (females 18+)
Sexual Behavior - Average number of female sex partners in lifetime (females 18+)
Sexual Behavior - Circumcised males 18+ (%)
Sleep Disorders - Average hours sleeping at night
Sleep Disorders - People that has trouble sleeping (%)
Smoking-Cigarette Use - People smoking cigarettes (%)
Taste & Smell - People 40+ having problems with smell (%)
Taste & Smell - People 40+ having problems with taste (%)
Taste & Smell - People 40+ that ever had wisdom teeth removed (%)
Taste & Smell - People 40+ that ever had tonsils teeth removed (%)
Taste & Smell - People 40+ that ever had a loss of consciousness because of a head injury (%)
Taste & Smell - People 40+ that ever had a broken nose or other serious injury to face or skull (%)
Taste & Smell - People 40+ that ever had two or more sinus infections (%)
Weight - Average height (inches)
Weight - Average weight (pounds)
Weight - Average BMI
Weight - People that are obese (%)
Weight - People that ever were obese (%)
Weight - People trying to lose weight (%)
Urban population: 41,574
Rural population: 2,975
Estimated median house/condo value in 2022: $515,235
92555:
$515,235California:
$715,900
According to our research of California and other state lists, there were 46 registered sex offenders living in 92555 zip code as of May 06, 2024 . The ratio of all residents to sex offenders in zip code 92555 is 932 to 1.The ratio of registered sex offenders to all residents in this zip code is lower than the state average.
Median resident age: This zip code:
36.1 yearsCalifornia median age:
37.9 years
Average household size: This zip code:
3.8 peopleCalifornia:
2.8 people
Averages for the 2020 tax year for zip code 92555, filed in 2021:
Average Adjusted Gross Income (AGI) in 2020: $57,872 (Individual Income Tax Returns) Here:
$57,872State:
$95,910
Salary/wage: $54,215 (reported on 84.9% of returns )Here:
$54,215State:
$77,331
(% of AGI for various income ranges: 1214.5% for AGIs below $25k , 3882.4% for AGIs $25k-50k , 7384.4% for AGIs $50k-75k , 10951.4% for AGIs $75k-100k , 20988.4% for AGIs $100k-200k , 71290.9% for AGIs over 200k ) Taxable interest for individuals: $459 (reported on 30.9% of returns )This zip code:
$459California:
$2,294
(% of AGI for various income ranges: 4.3% for AGIs below $25k , 7.6% for AGIs $25k-50k , 17.4% for AGIs $50k-75k , 19.8% for AGIs $75k-100k , 55.2% for AGIs $100k-200k , 770.9% for AGIs over 200k ) Ordinary dividends: $1,482 (reported on 6.8% of returns )(% of AGI for various income ranges: 3.7% for AGIs below $25k , 5.8% for AGIs $25k-50k , 13.5% for AGIs $50k-75k , 16.5% for AGIs $75k-100k , 51.5% for AGIs $100k-200k , 266.4% for AGIs over 200k ) Net capital gain/loss in AGI: +$6,613 (reported on 8.1% of returns )Here:
+$6,613State:
+$49,306
(% of AGI for various income ranges: 0.4% for AGIs below $25k , 7.0% for AGIs $25k-50k , 21.7% for AGIs $50k-75k , 19.5% for AGIs $75k-100k , 197.7% for AGIs $100k-200k , 6190.9% for AGIs over 200k ) Profit/loss from business: +$5,695 (reported on 17.8% of returns )Here:
+$5,695State:
+$15,671
(% of AGI for various income ranges: 103.0% for AGIs below $25k , 139.6% for AGIs $25k-50k , 139.1% for AGIs $50k-75k , 172.6% for AGIs $75k-100k , 153.4% for AGIs $100k-200k , 2016.4% for AGIs over 200k ) Taxable individual retirement arrangement distribution: $16,827 (reported on 3.4% of returns )92555:
$16,827California:
$23,505
(% of AGI for various income ranges: 14.3% for AGIs below $25k , 30.9% for AGIs $25k-50k , 77.2% for AGIs $50k-75k , 128.1% for AGIs $75k-100k , 292.0% for AGIs $100k-200k , 1594.5% for AGIs over 200k ) Total itemized deductions: $29,778 (reported on 16.7% of returns )Here:
$29,778State:
$39,517
(% of AGI for various income ranges: 64.8% for AGIs below $25k , 232.1% for AGIs $25k-50k , 850.6% for AGIs $50k-75k , 1371.6% for AGIs $75k-100k , 2502.9% for AGIs $100k-200k , 10731.8% for AGIs over 200k ) Charity contributions: $6,149 (reported on 13.8% of returns )(% of AGI for various income ranges: 4.2% for AGIs below $25k , 26.6% for AGIs $25k-50k , 119.0% for AGIs $50k-75k , 209.1% for AGIs $75k-100k , 514.6% for AGIs $100k-200k , 2141.8% for AGIs over 200k ) Taxes paid: $8,437 (reported on 16.7% of returns )(% of AGI for various income ranges: 16.4% for AGIs below $25k , 58.9% for AGIs $25k-50k , 242.1% for AGIs $50k-75k , 420.6% for AGIs $75k-100k , 771.5% for AGIs $100k-200k , 2050.0% for AGIs over 200k ) Earned income credit: $2,262 (reported on 17.7% of returns )(% of AGI for various income ranges: 102.5% for AGIs below $25k , 78.2% for AGIs $25k-50k , 1.3% for AGIs $50k-75k ) Percentage of individuals using paid preparers for their 2020 taxes: 93.1%(% for various income ranges: 93.0% for AGIs below $25k , 93.2% for AGIs $25k-50k , 92.7% for AGIs $50k-75k , 92.5% for AGIs $75k-100k , 93.6% for AGIs $100k-200k , 95.1% for AGIs over 200k )
Averages for the 2012 tax year for zip code 92555, filed in 2013:
Average Adjusted Gross Income (AGI) in 2012: $51,353 (Individual Income Tax Returns) Here:
$51,353State:
$72,726
Salary/wage: $48,856 (reported on 86.9% of returns )Here:
$48,856State:
$59,079
(% of AGI for various income ranges: 76.4% for AGIs below $25k , 84.7% for AGIs $25k-50k , 85.5% for AGIs $50k-75k , 86.3% for AGIs $75k-100k , 83.5% for AGIs $100k-200k , 60.8% for AGIs over 200k ) Taxable interest for individuals: $355 (reported on 32.1% of returns )This zip code:
$355California:
$2,146
(% of AGI for various income ranges: 0.3% for AGIs below $25k , 0.2% for AGIs $25k-50k , 0.2% for AGIs $50k-75k , 0.3% for AGIs $75k-100k , 0.2% for AGIs $100k-200k , 0.2% for AGIs over 200k ) Ordinary dividends: $1,532 (reported on 7.2% of returns )(% of AGI for various income ranges: 0.2% for AGIs below $25k , 0.1% for AGIs $25k-50k , 0.2% for AGIs $50k-75k , 0.1% for AGIs $75k-100k , 0.2% for AGIs $100k-200k , 0.7% for AGIs over 200k ) Net capital gain/loss in AGI: +$2,146 (reported on 6.1% of returns )Here:
+$2,146State:
+$30,460
(% of AGI for various income ranges: 0.5% for AGIs $100k-200k , 2.4% for AGIs over 200k ) Profit/loss from business: +$7,650 (reported on 17.4% of returns )Here:
+$7,650State:
+$17,064
(% of AGI for various income ranges: 11.5% for AGIs below $25k , 3.5% for AGIs $25k-50k , 1.5% for AGIs $50k-75k , 1.1% for AGIs $75k-100k , 1.0% for AGIs $100k-200k , 3.2% for AGIs over 200k ) Taxable individual retirement arrangement distribution: $14,372 (reported on 4.4% of returns )92555:
$14,372California:
$19,557
(% of AGI for various income ranges: 1.1% for AGIs below $25k , 1.0% for AGIs $25k-50k , 0.9% for AGIs $50k-75k , 1.1% for AGIs $75k-100k , 1.6% for AGIs $100k-200k , 1.9% for AGIs over 200k ) Total itemized deductions: $24,953 (31% of AGI, reported on 44.0% of returns )Here:
$24,953State:
$34,004
Here:
30.7% of AGIState:
22.7% of AGI
(% of AGI for various income ranges: 11.3% for AGIs below $25k , 18.4% for AGIs $25k-50k , 24.6% for AGIs $50k-75k , 22.9% for AGIs $75k-100k , 22.6% for AGIs $100k-200k , 23.4% for AGIs over 200k ) Charity contributions: $3,273 (reported on 35.8% of returns )(% of AGI for various income ranges: 0.7% for AGIs below $25k , 1.9% for AGIs $25k-50k , 2.4% for AGIs $50k-75k , 2.5% for AGIs $75k-100k , 2.8% for AGIs $100k-200k , 2.6% for AGIs over 200k ) Taxes paid: $7,559 (reported on 43.8% of returns )92555:
$7,559State:
$14,448
(% of AGI for various income ranges: 3.4% for AGIs below $25k , 4.6% for AGIs $25k-50k , 6.4% for AGIs $50k-75k , 7.2% for AGIs $75k-100k , 7.7% for AGIs $100k-200k , 7.8% for AGIs over 200k ) Earned income credit: $2,426 (reported on 23.3% of returns )(% of AGI for various income ranges: 9.2% for AGIs below $25k , 1.6% for AGIs $25k-50k ) Percentage of individuals using paid preparers for their 2012 taxes: 66.0%(% for various income ranges: 61.2% for AGIs below $25k , 67.6% for AGIs $25k-50k , 69.9% for AGIs $50k-75k , 67.9% for AGIs $75k-100k , 69.2% for AGIs $100k-200k , 75.0% for AGIs over 200k )
Averages for the 2004 tax year for zip code 92555, filed in 2005:
Average Adjusted Gross Income (AGI) in 2004: $49,841 (Individual Income Tax Returns) Here:
$49,841State:
$58,600
Salary/wage: $46,441 (reported on 89.1% of returns )Here:
$46,441State:
$49,455
(% of AGI for various income ranges: 150.3% for AGIs below $10k , 79.4% for AGIs $10k-25k , 84.9% for AGIs $25k-50k , 88.5% for AGIs $50k-75k , 89.5% for AGIs $75k-100k , 73.0% for AGIs over 100k ) Taxable interest for individuals: $541 (reported on 45.5% of returns )This zip code:
$541California:
$2,365
(% of AGI for various income ranges: 3.1% for AGIs below $10k , 0.8% for AGIs $10k-25k , 0.5% for AGIs $25k-50k , 0.4% for AGIs $50k-75k , 0.3% for AGIs $75k-100k , 0.5% for AGIs over 100k ) Taxable dividends: $964 (reported on 11.5% of returns )(% of AGI for various income ranges: 1.1% for AGIs below $10k , 0.4% for AGIs $10k-25k , 0.2% for AGIs $25k-50k , 0.1% for AGIs $50k-75k , 0.1% for AGIs $75k-100k , 0.3% for AGIs over 100k ) Net capital gain/loss: +$19,030 (reported on 10.2% of returns )Here:
+$19,030State:
+$23,418
(% of AGI for various income ranges: -1.1% for AGIs below $10k , -0.2% for AGIs $10k-25k , 0.8% for AGIs $25k-50k , 0.8% for AGIs $50k-75k , 1.1% for AGIs $75k-100k , 10.4% for AGIs over 100k ) Profit/loss from business: +$8,723 (reported on 17.8% of returns )Here:
+$8,723State:
+$16,826
(% of AGI for various income ranges: 5.8% for AGIs below $10k , 9.3% for AGIs $10k-25k , 4.7% for AGIs $25k-50k , 1.6% for AGIs $50k-75k , 1.6% for AGIs $75k-100k , 2.8% for AGIs over 100k ) IRA payment deduction: $2,926 (reported on 1.9% of returns )92555:
$2,926California:
$3,192
(% of AGI for various income ranges: 0.1% for AGIs $10k-25k , 0.2% for AGIs $25k-50k , 0.1% for AGIs $50k-75k , 0.1% for AGIs $75k-100k , 0.1% for AGIs over 100k ) Self-employed pension: $11,651 (reported on 0.4% of returns )Here:
$11,651California:
$17,688
Total itemized deductions: $24,743 (34% of AGI, reported on 55.7% of returns )Here:
$24,743State:
$28,113
Here:
34.0% of AGIState:
25.3% of AGI
(% of AGI for various income ranges: 33.2% for AGIs below $10k , 18.9% for AGIs $10k-25k , 30.7% for AGIs $25k-50k , 31.3% for AGIs $50k-75k , 29.6% for AGIs $75k-100k , 24.1% for AGIs over 100k ) Charity contributions deductions: $3,126 (4% of AGI, reported on 48.8% of returns )Here:
4.1% of AGIState:
3.3% of AGI
(% of AGI for various income ranges: 0.9% for AGIs below $10k , 1.4% for AGIs $10k-25k , 2.7% for AGIs $25k-50k , 3.2% for AGIs $50k-75k , 3.3% for AGIs $75k-100k , 3.5% for AGIs over 100k ) Total tax: $5,564 (reported on 73.4% of returns )92555:
$5,564State:
$10,761
(% of AGI for various income ranges: 5.0% for AGIs below $10k , 4.1% for AGIs $10k-25k , 4.7% for AGIs $25k-50k , 5.9% for AGIs $50k-75k , 7.7% for AGIs $75k-100k , 13.0% for AGIs over 100k ) Earned income credit: $1,905 (reported on 15.0% of returns )Percentage of individuals using paid preparers for their 2004 taxes: 68.9%(% for various income ranges: 58.5% for AGIs below $10k , 65.3% for AGIs $10k-25k , 72.8% for AGIs $25k-50k , 72.0% for AGIs $50k-75k , 71.0% for AGIs $75k-100k , 74.2% for AGIs over 100k )
Estimated median household income in 2022: This zip code:
$105,084California:
$91,551
Nearest zip codes: 92567 ,
92551 ,
92571 ,
92320 ,
92582 ,
92548 .
Moreno Valley Zip Code Map
Percentage of family households: This zip code:
56.0%California:
46.8%
Percentage of households with unmarried partners: This zip code:
6.0%California:
48.1%
Likely homosexual households (counted as self-reported same-sex unmarried-partner households)
Lesbian couples: 0.1% of all households Gay men: 0.2% of all households
Household received Food Stamps/SNAP in the past 12 months: 1,157Household did not receive Food Stamps/SNAP in the past 12 months: 10,543
Women who had a birth in the past 12 months: 698 (566 now married , 130 unmarried) Women who did not have a birth in the past 12 months: 11,286 (4,267 now married , 7,027 unmarried)
Housing units in zip code 92555 with a mortgage: 7,659 (588
second mortgage , 23
home equity loan , 311
both second mortgage and home equity loan )
Houses without a mortgage: 28
Median monthly owner costs for units with a mortgage: $2,368
Median monthly owner costs for units without a mortgage: $673
Residents with income below the poverty level in 2022:
This zip code:
8.1%Whole state:
12.2%
Residents with income below 50% of the poverty level in 2022:
This zip code:
3.2%Whole state:
6.2%
Median number of rooms in houses and condos: Median number of rooms in apartments: Notable locations in this zip code not listed on our city pages
Click to draw/clear zip code borders Notable locations in zip code 92555: (A) , Moreno Valley Ranch Golf Club (B) , Granite Spur (C) , American Medical Response Unit 391 (D) , Riverside County Fire Department Station 91 College Park (E) , Riverside County Fire Department Station 58 - Moreno Beach (F) . Display/hide their locations on the map
Churches in zip code 92555 include: (A) , Highland Baptist Church (B) , Lord of Life Lutheran Church (C) . Display/hide their locations on the map
Reservoir: (A) . Display/hide its location on the map
Parks in zip code 92555 include: (1) , Upland Game Hunting Area (2) , Lake Perris State Recreation Area (3) . Display/hide their locations on the map
Beaches: (A) , Moreno Beach (B) , Perris Beach (C) . Display/hide their locations on the map
Year house built (houses)
19 2020 or later1,724 2010 to 20196,143 2000 to 20091,256 1990 to 19992,255 1980 to 1989883 1970 to 1979251 1960 to 196961 1950 to 195946 1940 to 194949 1939 or earlier
Zip code 92555 household income distribution in 2022 323 Less than $10,000166 $10,000 to $14,999110 $15,000 to $19,999253 $20,000 to $24,999124 $25,000 to $29,999268 $30,000 to $34,999132 $35,000 to $39,999387 $40,000 to $44,999231 $45,000 to $49,999683 $50,000 to $59,999917 $60,000 to $74,9991,900 $75,000 to $99,9991,553 $100,000 to $124,9991,270 $125,000 to $149,9991,601 $150,000 to $199,9991,842 $200,000 or moreEstimate of home value of owner-occupied houses/condos in 2022 in zip code 92555 93 Less than $10,00018 $15,000 to $19,9997 $25,000 to $29,9997 $30,000 to $34,99932 $35,000 to $39,99939 $40,000 to $49,99944 $50,000 to $59,99974 $60,000 to $69,99966 $70,000 to $79,99910 $90,000 to $99,99915 $100,000 to $124,9994 $125,000 to $149,99940 $175,000 to $199,99939 $200,000 to $249,99996 $250,000 to $299,9991,103 $300,000 to $399,9992,971 $400,000 to $499,9993,222 $500,000 to $749,999329 $750,000 to $999,999102 $1,000,000 to $1,499,99910 $1,500,000 to $1,999,99957 $2,000,000 or moreRent paid by renters in 2022 in zip code 92555 78 $800 to $899124 $1,000 to $1,24944 $1,250 to $1,4991,397 $1,500 to $1,999885 $2,000 to $2,499103 $2,500 to $2,99912 $3,000 to $3,49953 $3,500 or more51 No cash rent
Median gross rent in 2022: $2,268.
Median price asked for vacant for-sale houses and condos in 2022: $562,656.
Estimated median house (or condo) value in 2022 for: White Non-Hispanic householders: $525,593Black or African American householders: $514,232Asian householders: $462,107Some other race householders: $440,389Two or more races householders: $568,696Hispanic or Latino householders: $461,105Estimated median house or condo value in 2022: $515,235
92555:
$515,235California:
$715,900
Lower value quartile - upper value quartile: $453,026 - $663,160
Mean price in 2022: Detached houses: $561,810Here:
$561,810State:
$988,808
Townhouses or other attached units: $373,554Here:
$373,554State:
$838,546
In 3-to-4-unit structures: $487,509Here:
$487,509State:
$824,253
In 5-or-more-unit structures: $317,478Here:
$317,478State:
$730,996
Mobile homes: $114,850Here:
$114,850State:
$184,506
Housing units in structures:
One, detached: 10,798One, attached: 277Two: 553 or 4: 825 to 9: 46610 to 19: 25720 to 49: 1150 or more: 148Mobile homes: 127Unemployment : 5.6%
Means of transportation to work in zip code 92555 69.1% 14,544 Drove a car alone17.0% 3,580 Carpooled0.2% 43 Bus or trolley bus0.3% 58 Subway or elevated0.0% 3 Railroad0.2% 41 Motorcycle0.7% 137 Walked0.5% 111 Other means11.6% 2,431 Worked at homeTravel time to work (commute) in zip code 92555 213 Less than 5 minutes776 5 to 9 minutes1,630 10 to 14 minutes1,785 15 to 19 minutes1,783 20 to 24 minutes835 25 to 29 minutes2,781 30 to 34 minutes507 35 to 39 minutes973 40 to 44 minutes2,312 45 to 59 minutes2,561 60 to 89 minutes2,159 90 or more minutes
Percentage of zip code residents living and working in this county: 65.1%
Household type by relationship:
Households: 44,550
Male householders: 5,527 (435 living alone ), Female householders: 6,256 (690 living alone )7,319 spouses (7,208 opposite-sex spouses ), 902 unmarried partners , (828 opposite-sex unmarried partners ), 15,145 children (14,262 natural , 99 adopted , 775 stepchildren ), 1,938 grandchildren , 1,155 brothers or sisters , 2,129 parents , 158 foster children , 2,176 other relatives , 1,453 non-relatives In group quarters: 178 (-1 institutionalized population )
Size of family households: 2,618 2-persons , 1,905 3-persons , 2,148 4-persons , 1,526 5-persons , 746 6-persons , 915 7-or-more-persons
Size of nonfamily households: 1,127 1-person , 455 2-persons , 145 3-persons , 54 4-persons , 30 6-persons
5,770 married couples with children. single-parent households (613 men , 1,812 women ).
56.6% of residents of 92555 zip code speak English at home. of residents speak Spanish at home (70% very well, 14% well, 10% not well, 5% not at all ).of residents speak other Indo-European language at home (48% very well, 25% well, 15% not well, 12% not at all ).of residents speak Asian or Pacific Island language at home (60% very well, 25% well, 12% not well, 4% not at all ).of residents speak other language at home (45% very well, 14% well, 28% not well, 13% not at all ).
Foreign born population: 9,853 (22.1%)
(63.6%
of them are naturalized citizens )
This zip code:
22.1%Whole state:
26.7%
51% Honduras 11% Malaysia 5% Costa Rica 4% Liberia 3% Bhutan 3% Thailand 2% El Salvador 2% German 2% Nigerian 1% American 1% English 1% Irish 1% African 1% Italian
Year of entry for the foreign-born population
1,536 2010 or later 1,621 2000 to 2009 2,477 1990 to 1999 4,460 Before 1990
There are
245 Medical Specialists in Zip Code 92555 .
Facilities with environmental interests located in this zip code:
MORENO VALLEY DODGE (27810 EUCALYPTUS ST in MORENO VALLEY, CA)
STATE MASTER (California - Hazardous Waste Tracking) - HAZARDOU WASTE PROGRAM Small Quantity Generators, between 100 kg and 1000 kg of hazardous waste/month (Resource Conservation and Recovery Act (tracking hazardous waste)) - notification Organizations: FIVE STAR ENTERPRISES (CONTACT/OWNER)
Alternative names: MORENO VALLEY NISSAN
MORENO VALLEY HONDA (27910 EUCALYPTUS ST in MORENO VALLEY, CA)
STATE MASTER (California - Hazardous Waste Tracking) - HAZARDOU WASTE PROGRAM Small Quantity Generators, between 100 kg and 1000 kg of hazardous waste/month (Resource Conservation and Recovery Act (tracking hazardous waste)) - notification Organizations: FIVE STAR ENTERPRISES (CONTACT/OWNER)
MORINO VALLEY CHEV GEO OLDS (12625 AUTO MALL DR in MORENO VALLEY, CA)
STATE MASTER (California - Hazardous Waste Tracking) - HAZARDOU WASTE PROGRAM Small Quantity Generators, between 100 kg and 1000 kg of hazardous waste/month (Resource Conservation and Recovery Act (tracking hazardous waste)) - notification Organizations: DIAMOND CHEVROLET INC (CONTACT/OWNER)
Alternative names: MORENO VALLEY CHEVROLET OLDS MOBILE
LANDMARK MIDDLE (15261 LEGENDARY DR. in MORENO VALLEY, CA)
(National Center for Education Statistics) - STATE ID-6109979 Organizations: MORENO VALLEY UNIFIED (SCHOOL DISTRICT)
MORENO ELEMENTARY (26700 COTTONWOOD AVE. in MORENO VALLEY, CA)
(National Center for Education Statistics) - STATE ID-6032320 Organizations: MORENO VALLEY UNIFIED (SCHOOL DISTRICT)
MOUNTAIN VIEW MIDDLE (13130 MORRISON ST. in MORENO VALLEY, CA)
(National Center for Education Statistics) - STATE ID-6107643 Organizations: MORENO VALLEY UNIFIED (SCHOOL DISTRICT)
MORENO VALLEY TOYOTA (27990 EUCALYPTUS AVE in MORENO VALLEY, CA)
Small Quantity Generators, between 100 kg and 1000 kg of hazardous waste/month (Resource Conservation and Recovery Act (tracking hazardous waste)) - notification Organizations: TERRY WILOX (CONTACT/OWNER)
EASTERN MUNICIPAL WATER DISTRI (27010 CACTUS in MORENO VALLEY, CA)
CRITERIA AND HAZARDOUS AIR POLLUTANT INVENTORY (Inventory of air pollution sources) Business SIC classification: WATER SUPPLY
EASTERN MUNICIPAL WATER DISTRI (26790 HWY 60 in MORENO VALLEY, CA)
CRITERIA AND HAZARDOUS AIR POLLUTANT INVENTORY (Inventory of air pollution sources) Business SIC classification: WATER SUPPLY
Housing units lacking complete plumbing facilities: 0.3%
Housing units lacking complete kitchen facilities: 1.6%
83.9% Utility gas 11.9% Electricity 2.2% Bottled, tank, or LP gas 1.3% Solar energy 0.6% No fuel used
Population in 1990: 9,784. Population change in the 1990s: +2,942 (+30.1%).
Place of birth for U.S.-born residents:
This state: 29,079Northeast: 617Midwest: 1,520South: 2,098West: 990
57% of the 92555 zip code residents lived in the same house 5 years ago.
Out of people who lived in different houses, 67% lived in this county.
Out of people who lived in different counties, 50% lived in California.
92% of the 92555 zip code residents lived in the same house 1 year ago.
Out of people who lived in different houses, 45% moved from this county.
Out of people who lived in different houses, 47% moved from different county within same state.
Out of people who lived in different houses, 6% moved from different state.
Out of people who lived in different houses, 5% moved from abroad.
Private vs. public school enrollment:
Students in private schools in grades 1 to 8 (elementary and middle school): 292
Here:
5.9%California:
10.5%
Students in private schools in grades 9 to 12 (high school): 95
Students in private undergraduate colleges: 385
Here:
14.4%California:
15.9%
Occupation by median earnings in the past 12 months ($)
145,377 Legal occupations 137,644 Computer and mathematical occupations 102,910 Management occupations 102,192 Architecture and engineering occupations 97,472 Life, physical, and social science occupations 82,493 Health diagnosing and treating practitioners and other technical occupations
Companies with federal contracts located in this zip code:
RICHARDA SANCHEZ (12412 DEEP VALLEY TRAIL in MORENO VALLEY, CA; small business) in 2 contracts from 2000 to 2001
$32,086 with Navy for Iron and Steel Primary and Semifinished Products. Signed on 2001-03-09. Completion date: 2001-03-29.
with Navy for Hardware, Commercial. Signed on 2000-09-08. Completion date: 2000-10-11.
WELCH, CHARLES (28095 LOCUST AVE in MORENO VALLEY, CA; small business)
$4,094 with Army for Vehicular Brake, Steering, Axle, Wheel, and Track Components. Signed on 2005-02-28. Completion date: 2005-03-06.
Top industries in this zip code by the number of employees in 2005:
Health Care and Social Assistance: General Medical and Surgical Hospitals (over 1000 employees: 1 establishment, 250-499 employees: 1 establishment)Wholesale Trade: Other Miscellaneous Nondurable Goods Merchant Wholesalers (100-249: 1, 1-4: 1)Arts, Entertainment, and Recreation: Golf Courses and Country Clubs (50-99: 1, 20-49: 1)Administrative and Support and Waste Management and Remediation Services: Landscaping Services (50-99: 1, 5-9: 2, 1-4: 1)Other Services (except Public Administration): Religious Organizations (20-49: 1, 5-9: 4, 1-4: 1)Health Care and Social Assistance: Offices of Physicians (except Mental Health Specialists) (10-19: 1, 5-9: 4, 1-4: 4)Health Care and Social Assistance: Other Residential Care Facilities (20-49: 1, 10-19: 1)Construction: Poured Concrete Foundation and Structure Contractors (20-49: 1, 1-4: 1)
People in group quarters in 2010:
49 people in group homes intended for adults
13 people in group homes for juveniles (non-correctional)
6 people in nursing facilities/skilled-nursing facilities
6 people in workers' group living quarters and job corps centers
5 people in other noninstitutional facilities
People in group quarters in 2000:
38 people in homes for the mentally retarded
28 people in other group homes
11 people in other noninstitutional group quarters
Fatal accident statistics in 2014:
Fatal accident count: 7Vehicles involved in fatal accidents: 14Fatal accidents caused by drunken drivers: 3Fatalities: 8Persons involved in fatal accidents: 22Pedestrians involved in fatal accidents: 5
Fatal accident statistics in 2013:
Fatal accident count: 11Vehicles involved in fatal accidents: 19Fatal accidents caused by drunken drivers: 7Fatalities: 13Persons involved in fatal accidents: 42Pedestrians involved in fatal accidents: 1
Home Mortgage Disclosure Act Aggregated Statistics For Year 2009(Based on 4 full and 12 partial tracts) A) FHA, FSA/RHS & VA B) Conventional C) Refinancings D) Home Improvement Loans E) Loans on Dwellings For 5+ Families F) Non-occupant Loans on G) Loans On Manufactured Number Average Value Number Average Value Number Average Value Number Average Value Number Average Value Number Average Value Number Average Value
LOANS ORIGINATED 1,986 $198,879 810 $144,245 859 $209,243 34 $61,119 1 $9,473,860 315 $123,299 8 $88,512 APPLICATIONS APPROVED, NOT ACCEPTED 164 $201,918 104 $152,720 152 $216,948 10 $72,699 0 $0 38 $132,997 2 $42,125 APPLICATIONS DENIED 417 $200,909 227 $152,827 500 $216,944 51 $43,941 0 $0 128 $133,697 15 $62,079 APPLICATIONS WITHDRAWN 350 $215,084 164 $147,238 277 $222,865 13 $38,406 0 $0 74 $122,185 3 $12,613 FILES CLOSED FOR INCOMPLETENESS 62 $189,216 32 $152,066 76 $198,727 10 $179,626 0 $0 17 $114,325 1 $101,060
Aggregated Statistics For Year 2008(Based on 4 full and 12 partial tracts) A) FHA, FSA/RHS & VA B) Conventional C) Refinancings D) Home Improvement Loans E) Loans on Dwellings For 5+ Families F) Non-occupant Loans on G) Loans On Manufactured Number Average Value Number Average Value Number Average Value Number Average Value Number Average Value Number Average Value Number Average Value
LOANS ORIGINATED 1,563 $240,885 1,093 $195,915 577 $228,011 109 $72,316 0 $0 290 $166,146 17 $100,225 APPLICATIONS APPROVED, NOT ACCEPTED 149 $257,182 288 $225,856 244 $253,032 21 $84,939 0 $0 51 $198,611 24 $86,423 APPLICATIONS DENIED 390 $254,699 505 $243,639 1,139 $288,716 189 $99,854 0 $0 131 $213,150 46 $119,296 APPLICATIONS WITHDRAWN 261 $252,882 266 $224,985 383 $273,154 38 $136,935 2 $322,570 50 $178,583 0 $0 FILES CLOSED FOR INCOMPLETENESS 67 $265,669 99 $268,849 94 $296,427 13 $86,118 0 $0 19 $240,005 0 $0
Aggregated Statistics For Year 2007(Based on 4 full and 12 partial tracts) A) FHA, FSA/RHS & VA B) Conventional C) Refinancings D) Home Improvement Loans E) Loans on Dwellings For 5+ Families F) Non-occupant Loans on G) Loans On Manufactured Number Average Value Number Average Value Number Average Value Number Average Value Number Average Value Number Average Value Number Average Value
LOANS ORIGINATED 89 $322,051 2,219 $256,195 2,901 $274,024 430 $152,857 0 $0 304 $260,641 39 $82,175 APPLICATIONS APPROVED, NOT ACCEPTED 8 $287,302 776 $262,968 1,103 $281,286 130 $125,825 0 $0 93 $304,306 31 $92,259 APPLICATIONS DENIED 32 $305,714 1,578 $297,138 3,452 $307,820 627 $156,081 1 $12,020 265 $298,286 54 $79,749 APPLICATIONS WITHDRAWN 26 $299,890 700 $277,920 1,276 $302,873 156 $222,407 1 $227,220 125 $282,044 9 $102,224 FILES CLOSED FOR INCOMPLETENESS 2 $306,280 191 $304,352 533 $326,896 39 $216,447 0 $0 34 $280,820 0 $0
Aggregated Statistics For Year 2006(Based on 4 full and 12 partial tracts) A) FHA, FSA/RHS & VA B) Conventional C) Refinancings D) Home Improvement Loans E) Loans on Dwellings For 5+ Families F) Non-occupant Loans on G) Loans On Manufactured Number Average Value Number Average Value Number Average Value Number Average Value Number Average Value Number Average Value Number Average Value
LOANS ORIGINATED 15 $354,984 5,902 $236,373 5,545 $279,991 807 $165,751 2 $5,423,080 646 $254,601 37 $91,186 APPLICATIONS APPROVED, NOT ACCEPTED 4 $244,020 1,284 $250,384 1,294 $289,267 165 $162,868 0 $0 172 $248,098 22 $72,810 APPLICATIONS DENIED 4 $297,085 2,377 $254,881 3,601 $302,064 815 $153,717 2 $103,070 293 $284,971 45 $98,645 APPLICATIONS WITHDRAWN 5 $251,066 1,596 $243,763 2,325 $298,897 263 $194,077 0 $0 217 $240,801 6 $117,467 FILES CLOSED FOR INCOMPLETENESS 2 $152,150 359 $231,733 559 $291,769 47 $176,182 2 $412,270 51 $279,853 0 $0
Aggregated Statistics For Year 2005(Based on 4 full and 12 partial tracts) A) FHA, FSA/RHS & VA B) Conventional C) Refinancings D) Home Improvement Loans E) Loans on Dwellings For 5+ Families F) Non-occupant Loans on G) Loans On Manufactured Number Average Value Number Average Value Number Average Value Number Average Value Number Average Value Number Average Value Number Average Value
LOANS ORIGINATED 16 $260,393 7,259 $221,492 6,085 $252,977 761 $153,629 2 $235,060 857 $233,214 52 $97,610 APPLICATIONS APPROVED, NOT ACCEPTED 3 $220,887 1,254 $224,250 1,139 $256,773 182 $118,207 0 $0 157 $235,055 52 $68,561 APPLICATIONS DENIED 4 $287,488 2,198 $226,891 2,768 $261,812 629 $121,057 0 $0 288 $241,786 90 $79,467 APPLICATIONS WITHDRAWN 7 $267,007 1,985 $226,945 2,314 $261,657 306 $183,135 0 $0 269 $232,571 18 $89,934 FILES CLOSED FOR INCOMPLETENESS 2 $266,015 262 $235,282 701 $253,837 51 $157,874 0 $0 48 $223,691 6 $174,693
Aggregated Statistics For Year 2004(Based on 4 full and 12 partial tracts) A) FHA, FSA/RHS & VA B) Conventional C) Refinancings D) Home Improvement Loans E) Loans on Dwellings For 5+ Families F) Non-occupant Loans on G) Loans On Manufactured Number Average Value Number Average Value Number Average Value Number Average Value Number Average Value Number Average Value Number Average Value
LOANS ORIGINATED 74 $211,496 5,651 $196,626 5,403 $203,366 611 $124,176 1 $2,058,130 780 $192,706 45 $86,498 APPLICATIONS APPROVED, NOT ACCEPTED 8 $230,068 1,052 $200,154 1,058 $198,950 138 $106,144 0 $0 141 $209,044 39 $72,700 APPLICATIONS DENIED 11 $224,485 1,370 $195,151 2,188 $200,630 601 $85,621 0 $0 187 $185,114 71 $74,259 APPLICATIONS WITHDRAWN 19 $228,016 1,498 $213,959 1,726 $199,059 261 $127,131 0 $0 211 $197,420 6 $115,303 FILES CLOSED FOR INCOMPLETENESS 3 $216,220 197 $208,415 533 $200,626 57 $114,576 0 $0 33 $182,123 1 $216,380
Aggregated Statistics For Year 2003(Based on 4 full and 12 partial tracts) A) FHA, FSA/RHS & VA B) Conventional C) Refinancings D) Home Improvement Loans E) Loans on Dwellings For 5+ Families F) Non-occupant Loans on Number Average Value Number Average Value Number Average Value Number Average Value Number Average Value Number Average Value
LOANS ORIGINATED 367 $179,600 3,092 $159,883 5,379 $150,663 192 $61,181 1 $403,680 401 $142,784 APPLICATIONS APPROVED, NOT ACCEPTED 38 $188,562 503 $155,882 897 $153,701 83 $56,816 0 $0 103 $149,745 APPLICATIONS DENIED 41 $176,014 664 $153,315 1,985 $151,515 246 $35,513 0 $0 129 $141,416 APPLICATIONS WITHDRAWN 54 $175,869 599 $159,769 1,401 $150,306 55 $74,749 0 $0 69 $133,242 FILES CLOSED FOR INCOMPLETENESS 15 $148,741 98 $164,630 303 $151,051 10 $53,385 0 $0 19 $145,641
Aggregated Statistics For Year 2002(Based on 2 partial tracts) A) FHA, FSA/RHS & VA B) Conventional C) Refinancings D) Home Improvement Loans E) Loans on Dwellings For 5+ Families F) Non-occupant Loans on Number Average Value Number Average Value Number Average Value Number Average Value Number Average Value Number Average Value
LOANS ORIGINATED 36 $156,660 198 $146,245 93 $134,994 6 $29,015 1 $252,300 13 $110,171 APPLICATIONS APPROVED, NOT ACCEPTED 8 $153,692 43 $133,015 16 $135,821 11 $26,912 0 $0 3 $75,690 APPLICATIONS DENIED 6 $152,362 31 $101,490 44 $145,589 14 $22,947 0 $0 4 $41,630 APPLICATIONS WITHDRAWN 11 $149,315 23 $121,945 32 $121,945 0 $0 0 $0 2 $110,590 FILES CLOSED FOR INCOMPLETENESS 0 $0 8 $138,029 8 $168,095 0 $0 0 $0 0 $0
Aggregated Statistics For Year 2001(Based on 2 partial tracts) A) FHA, FSA/RHS & VA B) Conventional C) Refinancings D) Home Improvement Loans E) Loans on Dwellings For 5+ Families F) Non-occupant Loans on Number Average Value Number Average Value Number Average Value Number Average Value Number Average Value Number Average Value
LOANS ORIGINATED 32 $134,534 119 $115,775 53 $123,595 5 $42,218 1 $87,460 8 $114,796 APPLICATIONS APPROVED, NOT ACCEPTED 1 $86,620 24 $131,336 7 $102,963 3 $30,277 0 $0 0 $0 APPLICATIONS DENIED 3 $141,007 21 $104,765 33 $96,486 3 $19,343 1 $2,943,500 2 $77,370 APPLICATIONS WITHDRAWN 2 $125,310 8 $89,041 13 $117,158 3 $21,867 0 $0 3 $40,930 FILES CLOSED FOR INCOMPLETENESS 0 $0 1 $97,560 6 $86,483 0 $0 0 $0 0 $0
Aggregated Statistics For Year 2000(Based on 2 partial tracts) A) FHA, FSA/RHS & VA B) Conventional C) Refinancings D) Home Improvement Loans F) Non-occupant Loans on Number Average Value Number Average Value Number Average Value Number Average Value Number Average Value
LOANS ORIGINATED 12 $109,681 37 $75,622 21 $89,106 6 $30,837 8 $86,098 APPLICATIONS APPROVED, NOT ACCEPTED 0 $0 7 $119,421 9 $76,624 4 $27,332 2 $22,285 APPLICATIONS DENIED 1 $135,400 12 $60,482 23 $100,518 6 $24,108 2 $42,890 APPLICATIONS WITHDRAWN 2 $69,380 6 $77,933 8 $112,274 0 $0 2 $42,470 FILES CLOSED FOR INCOMPLETENESS 0 $0 0 $0 3 $92,510 0 $0 0 $0
Aggregated Statistics For Year 1999(Based on 4 partial tracts) A) FHA, FSA/RHS & VA B) Conventional C) Refinancings D) Home Improvement Loans E) Loans on Dwellings For 5+ Families F) Non-occupant Loans on Number Average Value Number Average Value Number Average Value Number Average Value Number Average Value Number Average Value
LOANS ORIGINATED 413 $106,782 265 $90,519 449 $103,333 83 $27,010 5 $113,456 58 $79,116 APPLICATIONS APPROVED, NOT ACCEPTED 23 $110,679 41 $94,911 117 $98,324 69 $26,163 3 $94,723 9 $89,393 APPLICATIONS DENIED 60 $115,288 108 $96,397 375 $86,383 135 $21,841 2 $166,855 19 $100,756 APPLICATIONS WITHDRAWN 56 $102,276 62 $104,178 219 $91,518 12 $24,876 2 $126,510 10 $123,120 FILES CLOSED FOR INCOMPLETENESS 9 $103,240 14 $91,914 79 $101,613 2 $21,665 1 $148,700 6 $90,583
Private Mortgage Insurance Companies Aggregated Statistics For Year 2009(Based on 4 full and 12 partial tracts) A) Conventional B) Refinancings C) Non-occupant Loans on Number Average Value Number Average Value Number Average Value
LOANS ORIGINATED 101 $178,597 3 $225,220 3 $158,833 APPLICATIONS APPROVED, NOT ACCEPTED 72 $226,633 7 $311,791 1 $145,490 APPLICATIONS DENIED 15 $194,435 10 $234,672 0 $0 APPLICATIONS WITHDRAWN 6 $194,105 3 $190,690 0 $0 FILES CLOSED FOR INCOMPLETENESS 17 $302,274 1 $184,180 0 $0
Aggregated Statistics For Year 2008(Based on 4 full and 12 partial tracts) A) Conventional B) Refinancings C) Non-occupant Loans on Number Average Value Number Average Value Number Average Value
LOANS ORIGINATED 542 $265,158 81 $324,974 33 $239,876 APPLICATIONS APPROVED, NOT ACCEPTED 343 $315,928 174 $368,539 15 $293,539 APPLICATIONS DENIED 101 $267,616 25 $326,358 19 $287,783 APPLICATIONS WITHDRAWN 31 $249,425 15 $343,795 11 $214,879 FILES CLOSED FOR INCOMPLETENESS 30 $314,737 9 $381,733 12 $344,512
Aggregated Statistics For Year 2007(Based on 4 full and 12 partial tracts) A) Conventional B) Refinancings C) Non-occupant Loans on Number Average Value Number Average Value Number Average Value
LOANS ORIGINATED 419 $332,956 205 $378,795 16 $343,161 APPLICATIONS APPROVED, NOT ACCEPTED 64 $350,172 91 $381,701 1 $362,600 APPLICATIONS DENIED 26 $386,073 31 $409,957 6 $377,293 APPLICATIONS WITHDRAWN 42 $353,772 46 $401,985 1 $655,760 FILES CLOSED FOR INCOMPLETENESS 2 $325,465 3 $416,083 0 $0
Aggregated Statistics For Year 2006(Based on 4 full and 12 partial tracts) A) Conventional B) Refinancings C) Non-occupant Loans on Number Average Value Number Average Value Number Average Value
LOANS ORIGINATED 100 $342,391 128 $369,857 7 $371,460 APPLICATIONS APPROVED, NOT ACCEPTED 50 $343,780 58 $357,931 4 $363,362 APPLICATIONS DENIED 6 $426,788 18 $399,104 1 $444,810 APPLICATIONS WITHDRAWN 13 $383,674 10 $375,567 5 $332,768 FILES CLOSED FOR INCOMPLETENESS 1 $394,320 0 $0 0 $0
Aggregated Statistics For Year 2005(Based on 4 full and 12 partial tracts) A) Conventional B) Refinancings C) Non-occupant Loans on Number Average Value Number Average Value Number Average Value
LOANS ORIGINATED 177 $316,875 117 $318,131 19 $314,523 APPLICATIONS APPROVED, NOT ACCEPTED 59 $300,877 30 $289,760 11 $269,809 APPLICATIONS DENIED 5 $360,646 3 $492,823 4 $371,570 APPLICATIONS WITHDRAWN 13 $282,932 11 $341,537 2 $319,975 FILES CLOSED FOR INCOMPLETENESS 2 $294,780 3 $318,767 0 $0
Aggregated Statistics For Year 2004(Based on 4 full and 12 partial tracts) A) Conventional B) Refinancings C) Non-occupant Loans on Number Average Value Number Average Value Number Average Value
LOANS ORIGINATED 402 $269,451 143 $244,661 34 $232,468 APPLICATIONS APPROVED, NOT ACCEPTED 128 $254,482 66 $221,604 32 $246,657 APPLICATIONS DENIED 12 $300,196 3 $195,260 3 $203,597 APPLICATIONS WITHDRAWN 28 $250,680 18 $203,209 6 $231,770 FILES CLOSED FOR INCOMPLETENESS 9 $311,643 10 $188,522 1 $260,820
Aggregated Statistics For Year 2003(Based on 4 full and 12 partial tracts) A) Conventional B) Refinancings C) Non-occupant Loans on Number Average Value Number Average Value Number Average Value
LOANS ORIGINATED 461 $200,092 329 $178,500 29 $172,703 APPLICATIONS APPROVED, NOT ACCEPTED 91 $183,530 119 $174,871 0 $0 APPLICATIONS DENIED 8 $207,336 2 $301,150 1 $234,430 APPLICATIONS WITHDRAWN 20 $214,907 18 $191,593 3 $238,130 FILES CLOSED FOR INCOMPLETENESS 3 $238,997 0 $0 0 $0
Aggregated Statistics For Year 2002(Based on 2 partial tracts) A) Conventional B) Refinancings C) Non-occupant Loans on Number Average Value Number Average Value Number Average Value
LOANS ORIGINATED 27 $166,362 10 $153,987 1 $76,530 APPLICATIONS APPROVED, NOT ACCEPTED 2 $151,380 2 $124,050 0 $0 APPLICATIONS DENIED 0 $0 2 $144,650 0 $0 APPLICATIONS WITHDRAWN 0 $0 2 $103,445 0 $0 FILES CLOSED FOR INCOMPLETENESS 0 $0 0 $0 0 $0
Aggregated Statistics For Year 2001(Based on 2 partial tracts) A) Conventional B) Refinancings C) Non-occupant Loans on Number Average Value Number Average Value Number Average Value
LOANS ORIGINATED 13 $141,935 3 $89,427 1 $52,980 APPLICATIONS APPROVED, NOT ACCEPTED 4 $156,005 0 $0 0 $0 APPLICATIONS DENIED 1 $159,790 0 $0 0 $0 APPLICATIONS WITHDRAWN 0 $0 0 $0 0 $0 FILES CLOSED FOR INCOMPLETENESS 0 $0 0 $0 0 $0
Aggregated Statistics For Year 2000(Based on 2 partial tracts) A) Conventional B) Refinancings C) Non-occupant Loans on Number Average Value Number Average Value Number Average Value
LOANS ORIGINATED 3 $171,843 1 $79,890 1 $57,190 APPLICATIONS APPROVED, NOT ACCEPTED 0 $0 0 $0 0 $0 APPLICATIONS DENIED 0 $0 0 $0 0 $0 APPLICATIONS WITHDRAWN 0 $0 0 $0 0 $0 FILES CLOSED FOR INCOMPLETENESS 1 $58,870 0 $0 0 $0
Aggregated Statistics For Year 1999(Based on 4 partial tracts) A) Conventional B) Refinancings C) Non-occupant Loans on Number Average Value Number Average Value Number Average Value
LOANS ORIGINATED 60 $125,858 68 $130,581 8 $90,156 APPLICATIONS APPROVED, NOT ACCEPTED 7 $133,987 15 $133,257 1 $126,680 APPLICATIONS DENIED 5 $107,834 5 $118,106 1 $102,600 APPLICATIONS WITHDRAWN 2 $123,140 5 $129,306 0 $0 FILES CLOSED FOR INCOMPLETENESS 0 $0 1 $172,210 0 $0
2006 - 2018 National Fire Incident Reporting System (NFIRS) incidents See full 2006 National Fire Incident Reporting System statistics for zip code 92555, California
Most common first names in zip code 92555 among deceased individuals Name Count Lived (average)
Mary 27 80.5 years James 26 65.9 years Robert 23 71.3 years John 21 77.0 years William 17 71.2 years Maria 11 72.7 years Dorothy 11 79.8 years Donald 10 70.8 years George 10 66.1 years Margaret 10 76.9 years
Most common last names in zip code 92555 among deceased individuals Last name Count Lived (average)
Smith 15 80.3 years Anderson 10 75.6 years Brown 9 64.9 years Williams 9 72.5 years Johnson 8 69.5 years Jackson 7 71.0 years Thompson 7 72.0 years Jones 6 76.2 years Wilson 5 88.4 years Thomas 5 77.6 years
Businesses in zip code 92555
Name Count Name Count
Baja Fresh Mexican Grill 1 Nike 2 CVS 1 OfficeMax 1 Carl\s Jr. 1 Panda Express 1 Chevrolet 1 Payless 1 DHL 1 Quiznos 1 DressBarn 1 Skechers USA 1 Dressbarn 1 Starbucks 2 El Pollo Loco 1 T-Mobile 1 Famous Footwear 1 Target 1 FedEx 2 Toyota 1 GNC 1 UPS 1 GameStop 1 Verizon Wireless 2 H&R Block 1 Volkswagen 1 Honda 1 Walmart 1 Kohl's 1 Wendy's 1 McDonald's 1


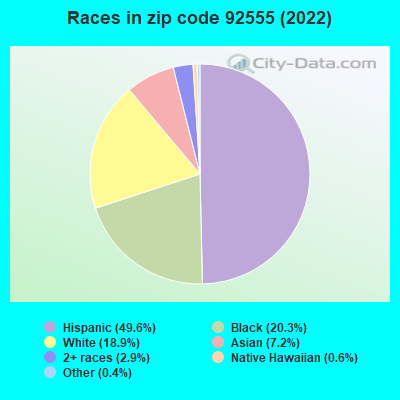


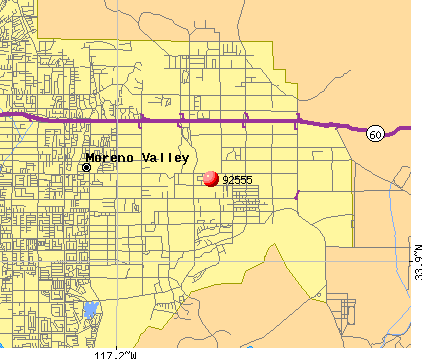 Nearest zip codes: 92567, 92551, 92571, 92320, 92582, 92548.
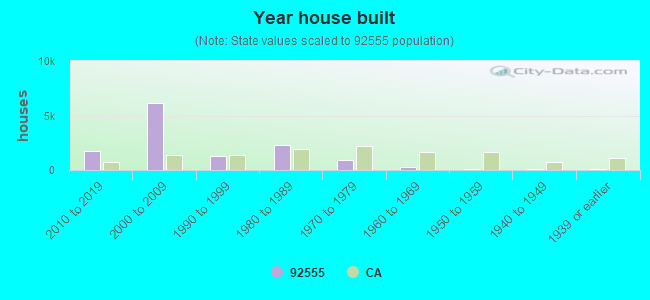
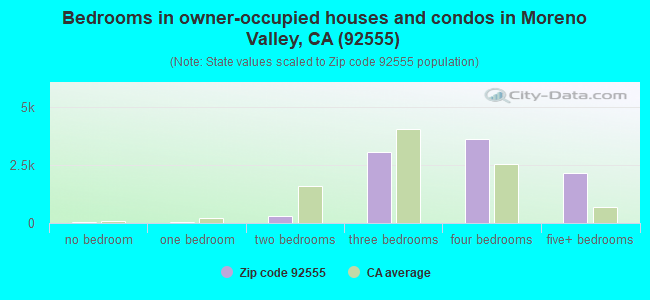
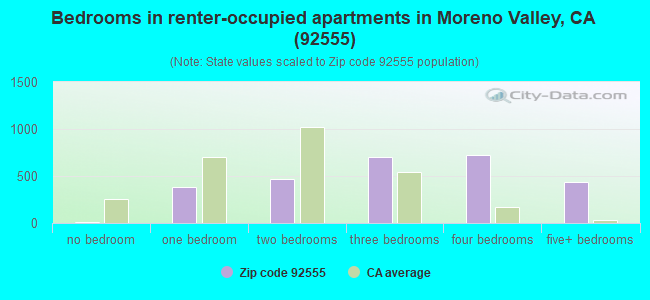
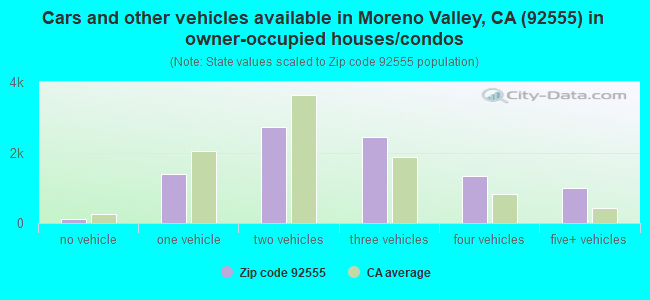
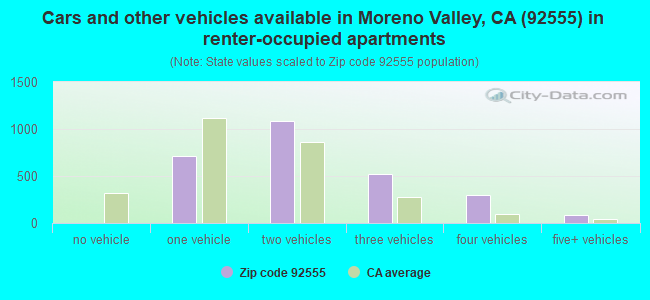


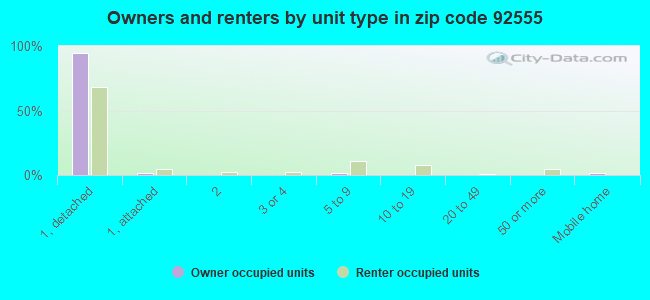
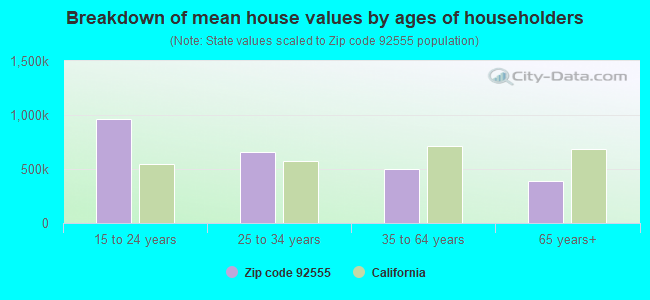


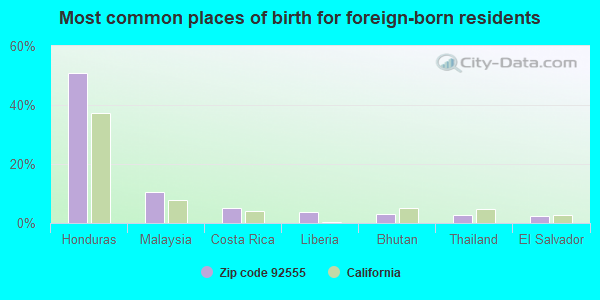
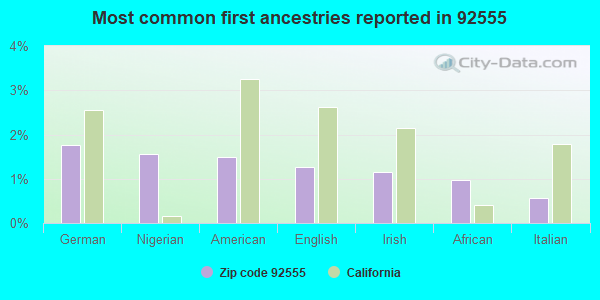
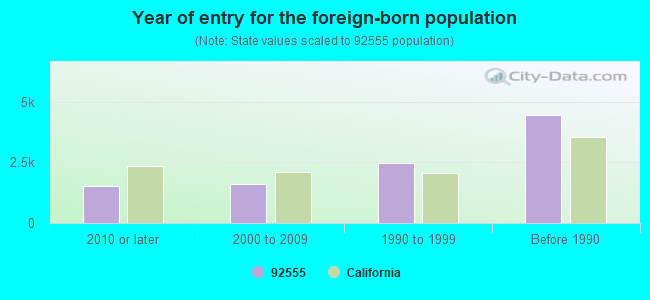

 . Federal Facility
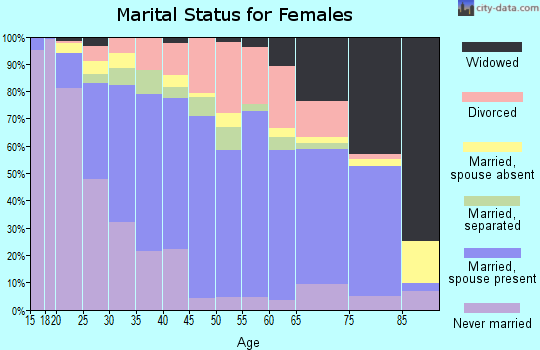
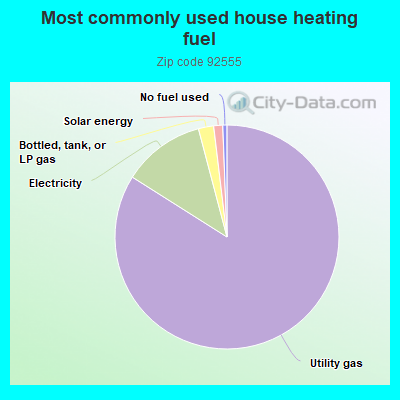
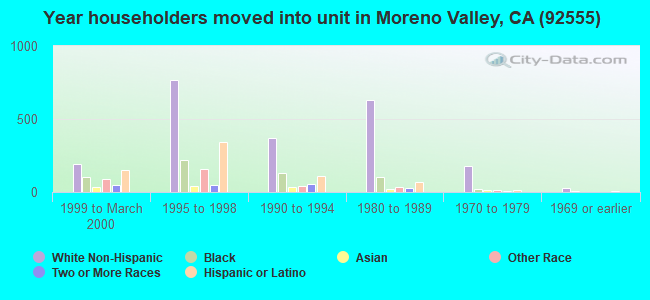
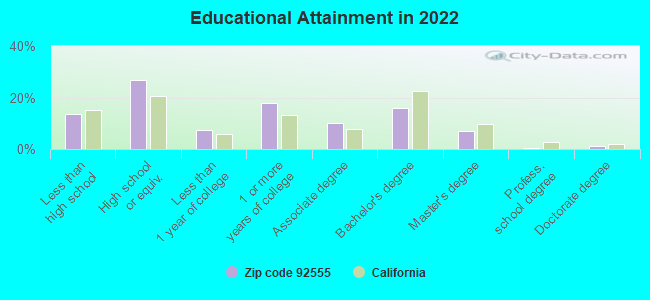
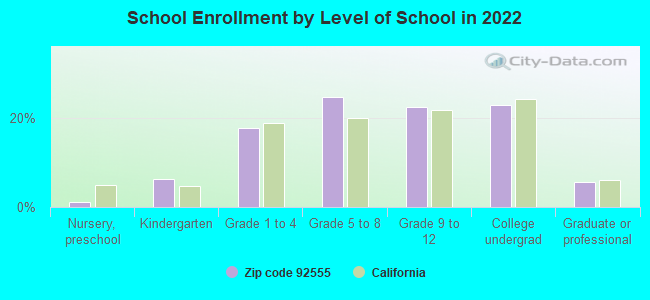
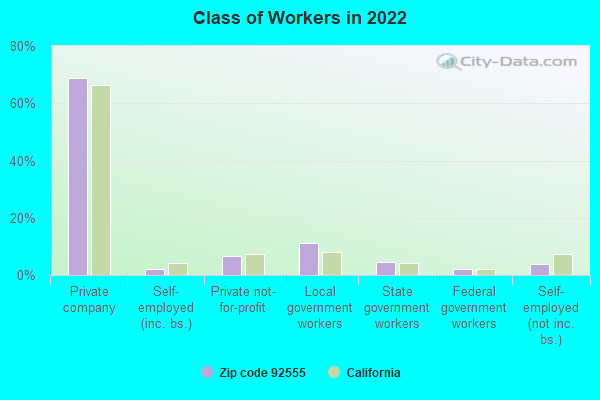
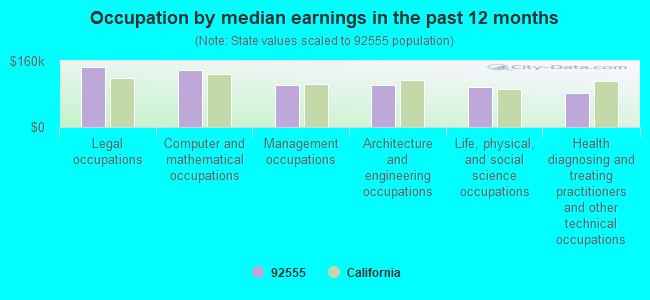
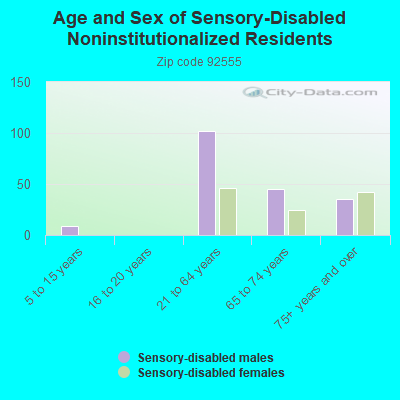
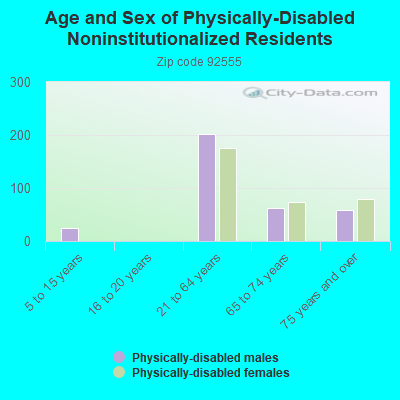
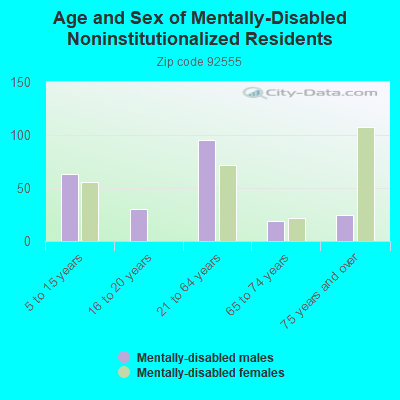
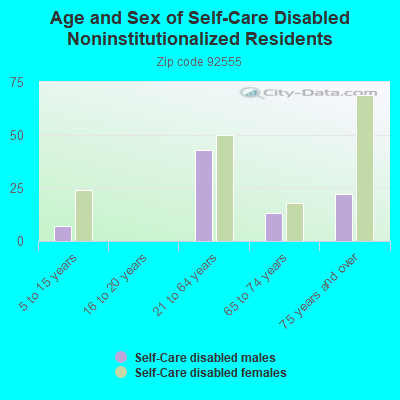
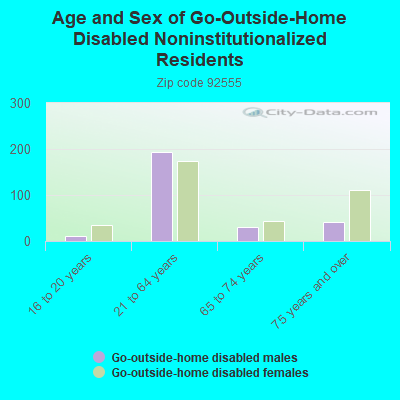
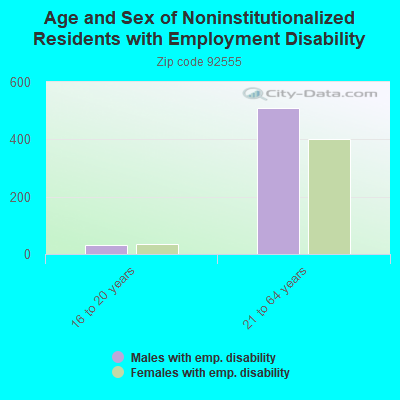
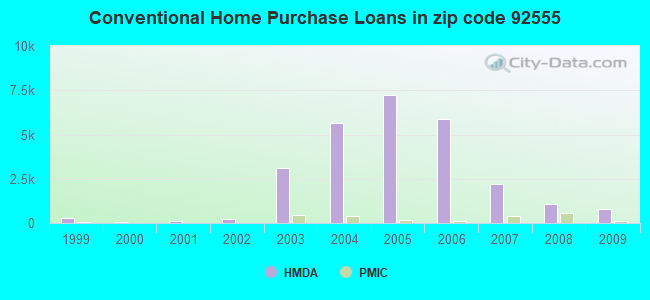
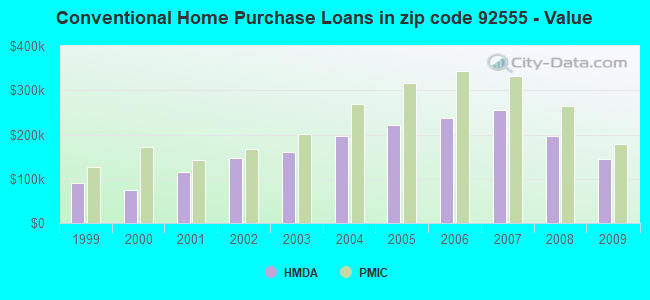
 Based on the data from the years 2006 - 2018 the average number of fires per year is 77. The highest number of fires - 115 took place in 2017, and the least - 15 in 2006. The data has a growing trend.
 When looking into fire subcategories, the most incidents belonged to: Outside Fires (47.2%), and Mobile Property/Vehicle Fires (30.9%).