Estimated zip code population in 2022: 42,153 Zip code population in 2010: 41,083 Zip code population in 2000: 23,159
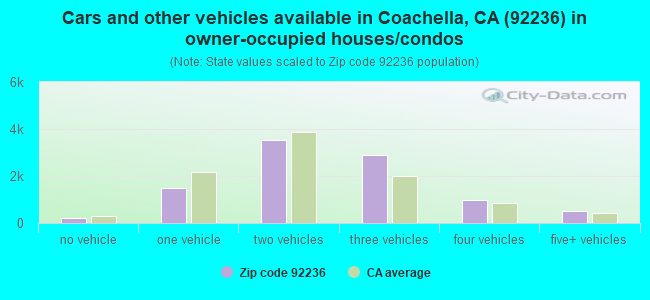
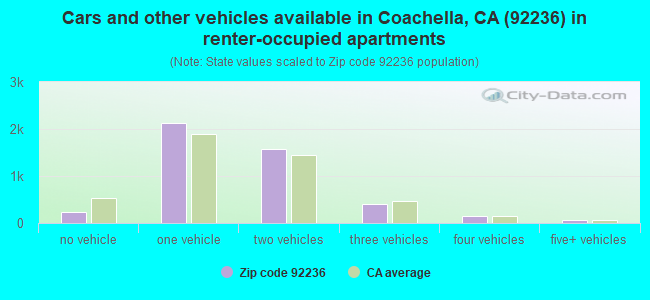
Houses and condos: 14,430 Renter-occupied apartments: 4,542
% of renters here:
32%
State:
44%
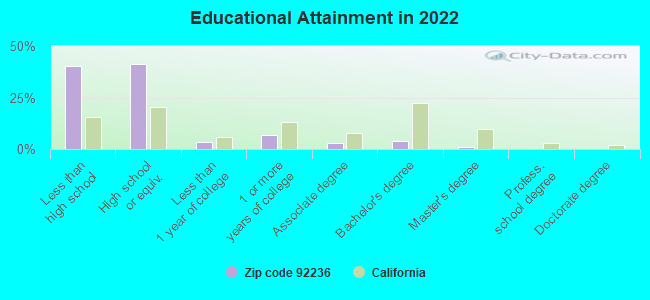
March 2022 cost of living index in zip code 92236: 81.6 (low, U.S. average is 100)
Land area: 21.9 sq. mi. Water area: 0.0 sq. mi.
Population density: 1,926 people per square mile
(low).
OSM Map
General Map
Google Map
MSN Map
OSM Map
General Map
Google Map
MSN Map
OSM Map
General Map
Google Map
MSN Map
OSM Map
General Map
Google Map
MSN Map
Please wait while loading the map...
Real estate property taxes paid for housing units in 2022:
This zip code:
1.1% ($3,727)
California:
0.7% ($4,831)
Median real estate property taxes paid for housing units with mortgages in 2022: $4,329 (1.2%) Median real estate property taxes paid for housing units with no mortgage in 2022: $2,623 (1.0%)
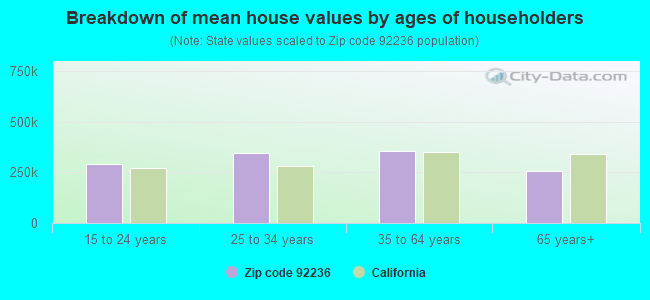
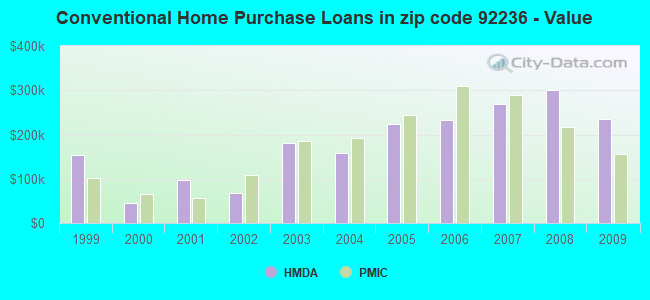
Estimated median house/condo value in 2022: $327,818
92236:
$327,818
California:
$715,900
According to our research of California and other state lists, there were 28 registered sex offenders living in 92236 zip code as of May 17, 2024. The ratio of all residents to sex offenders in zip code 92236 is 1,598 to 1. The ratio of registered sex offenders to all residents in this zip code is lower than the state average.
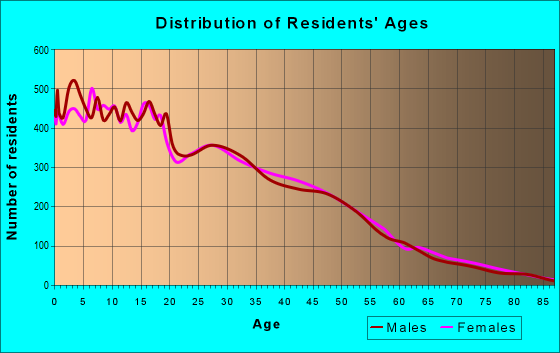
Median resident age:
This zip code:
35.5 years
California median age:
37.9 years
Average household size:
This zip code:
3.0 people
California:
2.8 people
Averages for the 2020 tax year for zip code 92236, filed in 2021:
Average Adjusted Gross Income (AGI) in 2020: $35,431 (Individual Income Tax Returns)
Here:
$35,431
State:
$95,910
Salary/wage: $31,613 (reported on 90.7% of returns)
Here:
$31,613
State:
$77,331
(% of AGI for various income ranges: 1533.2% for AGIs below $25k, 4095.2% for AGIs $25k-50k, 7673.5% for AGIs $50k-75k, 11495.0% for AGIs $75k-100k, 17619.2% for AGIs $100k-200k)
Taxable interest for individuals: $128 (reported on 16.9% of returns)
This zip code:
$128
California:
$2,294
(% of AGI for various income ranges: 1.2% for AGIs below $25k, 2.4% for AGIs $25k-50k, 5.5% for AGIs $50k-75k, 9.8% for AGIs $75k-100k, 14.7% for AGIs $100k-200k)
Ordinary dividends: $511 (reported on 1.4% of returns)
Here:
$511
State:
$10,949
(% of AGI for various income ranges: 0.3% for AGIs below $25k, 0.2% for AGIs $25k-50k, 1.4% for AGIs $50k-75k, 1.3% for AGIs $75k-100k, 22.4% for AGIs $100k-200k)
Net capital gain/loss in AGI: +$2,469 (reported on 1.8% of returns)
Here:
+$2,469
State:
+$49,306
(% of AGI for various income ranges: 2.8% for AGIs below $25k, 1.2% for AGIs $25k-50k, 17.3% for AGIs $50k-75k, 24.4% for AGIs $75k-100k, 60.5% for AGIs $100k-200k)
Profit/loss from business: +$8,135 (reported on 14.7% of returns)
Here:
+$8,135
State:
+$15,671
(% of AGI for various income ranges: 166.3% for AGIs below $25k, 111.1% for AGIs $25k-50k, 244.3% for AGIs $50k-75k, 264.5% for AGIs $75k-100k, 851.8% for AGIs $100k-200k)
Taxable individual retirement arrangement distribution: $6,493 (reported on 0.7% of returns)
92236:
$6,493
California:
$23,505
(% of AGI for various income ranges: 2.2% for AGIs below $25k, 4.5% for AGIs $25k-50k, 19.9% for AGIs $50k-75k, 33.7% for AGIs $75k-100k)
Total itemized deductions: $24,546 (reported on 5.6% of returns)
Here:
$24,546
State:
$39,517
(% of AGI for various income ranges: 22.5% for AGIs below $25k, 165.7% for AGIs $25k-50k, 443.9% for AGIs $50k-75k, 828.9% for AGIs $75k-100k, 1325.8% for AGIs $100k-200k)
Charity contributions: $5,393 (reported on 4.5% of returns)
Here:
$5,393
State:
$12,598
(% of AGI for various income ranges: 2.6% for AGIs below $25k, 28.2% for AGIs $25k-50k, 71.8% for AGIs $50k-75k, 140.2% for AGIs $75k-100k, 300.0% for AGIs $100k-200k)
Taxes paid: $8,086 (reported on 5.6% of returns)
92236:
$8,086
State:
$8,807
(% of AGI for various income ranges: 6.5% for AGIs below $25k, 51.7% for AGIs $25k-50k, 155.5% for AGIs $50k-75k, 270.3% for AGIs $75k-100k, 433.9% for AGIs $100k-200k)
Earned income credit: $2,573 (reported on 34.7% of returns)
Here:
$2,573
State:
$2,074
(% of AGI for various income ranges: 188.5% for AGIs below $25k, 139.3% for AGIs $25k-50k, 4.7% for AGIs $50k-75k)
Percentage of individuals using paid preparers for their 2020 taxes: 87.4%
Here:
87%
State:
92%
(% for various income ranges: 84.6% for AGIs below $25k, 88.4% for AGIs $25k-50k, 90.9% for AGIs $50k-75k, 90.6% for AGIs $75k-100k, 92.1% for AGIs $100k-200k, 100.0% for AGIs over 200k)
Averages for the 2012 tax year for zip code 92236, filed in 2013:
Average Adjusted Gross Income (AGI) in 2012: $26,756 (Individual Income Tax Returns)
Here:
$26,756
State:
$72,726
Salary/wage: $24,778 (reported on 92.6% of returns)
Here:
$24,778
State:
$59,079
(% of AGI for various income ranges: 81.2% for AGIs below $25k, 91.0% for AGIs $25k-50k, 90.6% for AGIs $50k-75k, 88.8% for AGIs $75k-100k, 62.1% for AGIs $100k-200k)
Taxable interest for individuals: $169 (reported on 13.4% of returns)
This zip code:
$169
California:
$2,146
(% of AGI for various income ranges: 0.1% for AGIs $50k-75k, 0.3% for AGIs $100k-200k)
Ordinary dividends: $1,059 (reported on 1.0% of returns)
Here:
$1,059
State:
$9,308
(% of AGI for various income ranges: 0.2% for AGIs $75k-100k)
Net capital gain/loss in AGI: +$729 (reported on 1.0% of returns)
Here:
+$729
State:
+$30,460
(% of AGI for various income ranges: 0.5% for AGIs $75k-100k)
Profit/loss from business: +$7,948 (reported on 16.3% of returns)
Here:
+$7,948
State:
+$17,064
(% of AGI for various income ranges: 10.4% for AGIs below $25k, 2.5% for AGIs $25k-50k, 1.3% for AGIs $50k-75k, 1.3% for AGIs $75k-100k, 2.2% for AGIs $100k-200k)
Taxable individual retirement arrangement distribution: $7,318 (reported on 0.7% of returns)
92236:
$7,318
California:
$19,557
(% of AGI for various income ranges: 0.1% for AGIs $25k-50k, 0.6% for AGIs $50k-75k)
Total itemized deductions: $17,841 (34% of AGI, reported on 14.8% of returns)
Here:
$17,841
State:
$34,004
Here:
33.8% of AGI
State:
22.7% of AGI
(% of AGI for various income ranges: 2.7% for AGIs below $25k, 10.2% for AGIs $25k-50k, 17.3% for AGIs $50k-75k, 18.2% for AGIs $75k-100k, 17.7% for AGIs $100k-200k)
Charity contributions: $2,279 (reported on 10.6% of returns)
Here:
$2,279
State:
$4,659
(% of AGI for various income ranges: 0.1% for AGIs below $25k, 0.9% for AGIs $25k-50k, 1.8% for AGIs $50k-75k, 1.7% for AGIs $75k-100k, 1.8% for AGIs $100k-200k)
Taxes paid: $4,479 (reported on 14.8% of returns)
92236:
$4,479
State:
$14,448
(% of AGI for various income ranges: 0.6% for AGIs below $25k, 2.2% for AGIs $25k-50k, 4.2% for AGIs $50k-75k, 4.9% for AGIs $75k-100k, 6.7% for AGIs $100k-200k)
Earned income credit: $3,002 (reported on 48.3% of returns)
Here:
$3,002
State:
$2,286
(% of AGI for various income ranges: 12.8% for AGIs below $25k, 3.0% for AGIs $25k-50k)
Percentage of individuals using paid preparers for their 2012 taxes: 73.2%
Here:
73%
State:
64%
(% for various income ranges: 71.1% for AGIs below $25k, 75.4% for AGIs $25k-50k, 79.7% for AGIs $50k-75k, 78.4% for AGIs $75k-100k, 77.8% for AGIs $100k-200k)
Averages for the 2004 tax year for zip code 92236, filed in 2005:
Average Adjusted Gross Income (AGI) in 2004: $25,484 (Individual Income Tax Returns)
Here:
$25,484
State:
$58,600
Salary/wage: $23,061 (reported on 95.0% of returns)
Here:
$23,061
State:
$49,455
(% of AGI for various income ranges: 96.7% for AGIs below $10k, 89.6% for AGIs $10k-25k, 93.9% for AGIs $25k-50k, 92.9% for AGIs $50k-75k, 85.1% for AGIs $75k-100k, 24.1% for AGIs over 100k)
Taxable interest for individuals: $752 (reported on 12.8% of returns)
This zip code:
$752
California:
$2,365
(% of AGI for various income ranges: 0.2% for AGIs below $10k, 0.1% for AGIs $10k-25k, 0.1% for AGIs $25k-50k, 0.1% for AGIs $50k-75k, 0.1% for AGIs $75k-100k, 3.3% for AGIs over 100k)
Taxable dividends: $563 (reported on 1.6% of returns)
Here:
$563
State:
$4,746
(% of AGI for various income ranges: 0.0% for AGIs below $10k, 0.0% for AGIs $10k-25k, 0.0% for AGIs $25k-50k, 0.0% for AGIs $50k-75k, 0.0% for AGIs $75k-100k, 0.2% for AGIs over 100k)
Net capital gain/loss: +$27,912 (reported on 2.3% of returns)
Here:
+$27,912
State:
+$23,418
(% of AGI for various income ranges: -0.4% for AGIs below $10k, -0.1% for AGIs $10k-25k, -0.1% for AGIs $25k-50k, 0.5% for AGIs $50k-75k, 2.9% for AGIs $75k-100k, 26.9% for AGIs over 100k)
Profit/loss from business: +$7,817 (reported on 11.1% of returns)
Here:
+$7,817
State:
+$16,826
(% of AGI for various income ranges: 11.8% for AGIs below $10k, 4.8% for AGIs $10k-25k, 2.0% for AGIs $25k-50k, 1.5% for AGIs $50k-75k, 4.1% for AGIs $75k-100k, 3.6% for AGIs over 100k)
IRA payment deduction: $2,077 (reported on 0.2% of returns)
92236:
$2,077
California:
$3,192
Total itemized deductions: $16,003 (28% of AGI, reported on 14.5% of returns)
Here:
$16,003
State:
$28,113
Here:
28.2% of AGI
State:
25.3% of AGI
(% of AGI for various income ranges: 3.1% for AGIs $10k-25k, 10.7% for AGIs $25k-50k, 16.1% for AGIs $50k-75k, 18.7% for AGIs $75k-100k, 10.7% for AGIs over 100k)
Charity contributions deductions: $2,174 (4% of AGI, reported on 12.3% of returns)
Here:
$2,174
State:
$3,923
Here:
3.7% of AGI
State:
3.3% of AGI
(% of AGI for various income ranges: 0.3% for AGIs $10k-25k, 1.3% for AGIs $25k-50k, 2.1% for AGIs $50k-75k, 2.3% for AGIs $75k-100k, 0.9% for AGIs over 100k)
Total tax: $2,602 (reported on 43.9% of returns)
92236:
$2,602
State:
$10,761
(% of AGI for various income ranges: 2.6% for AGIs below $10k, 1.9% for AGIs $10k-25k, 2.9% for AGIs $25k-50k, 5.5% for AGIs $50k-75k, 8.4% for AGIs $75k-100k, 17.3% for AGIs over 100k)
Earned income credit: $2,185 (reported on 50.4% of returns)
Here:
$2,185
State:
$1,763
Percentage of individuals using paid preparers for their 2004 taxes: 79.0%
Here:
79%
State:
66%
(% for various income ranges: 72.6% for AGIs below $10k, 79.3% for AGIs $10k-25k, 82.6% for AGIs $25k-50k, 81.1% for AGIs $50k-75k, 74.0% for AGIs $75k-100k, 80.0% for AGIs over 100k)
Likely homosexual households (counted as self-reported same-sex unmarried-partner households)
Lesbian couples: 0.1% of all households
Gay men: 0.0% of all households
Household received Food Stamps/SNAP in the past 12 months: 3,841 Household did not receive Food Stamps/SNAP in the past 12 months: 10,832
Women who had a birth in the past 12 months: 563 (417 now married, 146 unmarried) Women who did not have a birth in the past 12 months: 11,075 (4,451 now married, 6,621 unmarried)
Housing units in zip code 92236 with a mortgage: 5,952 (79 second mortgage, 45 both second mortgage and home equity loan) Median monthly owner costs for units with a mortgage: $1,724 Median monthly owner costs for units without a mortgage: $564
Residents with income below the poverty level in 2022:
This zip code:
11.0%
Whole state:
12.2%
Residents with income below 50% of the poverty level in 2022:
This zip code:
7.4%
Whole state:
6.2%
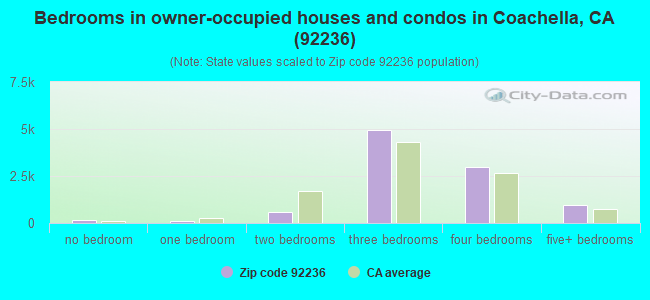
Median number of rooms in houses and condos:
Here:
5.4
State:
6.0
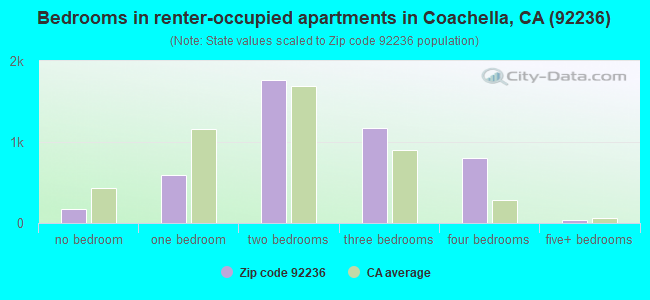
Median number of rooms in apartments:
Here:
4.3
State:
3.9
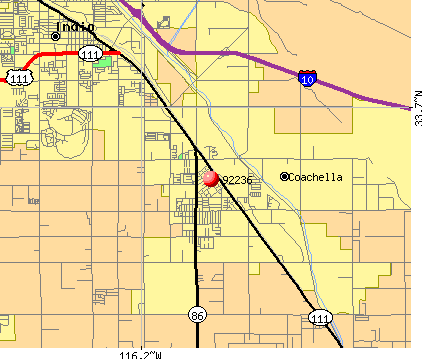
Notable locations in this zip code not listed on our city pages
Notable locations in zip code 92236: Coachella Wastewater Treatment Plant (A), Happy Wanderer Recreational Vehicle Park (B), American Medical Response Coachella (C), Coachella Chamber of Commerce (D), Coachella Branch Riverside City and County Public Library (E), Riverside County Fire Department Station 79 Coachella (F). Display/hide their locations on the map
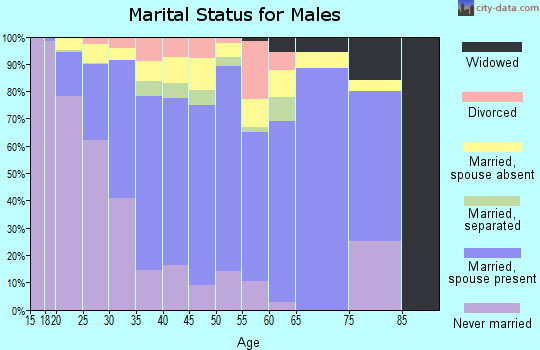
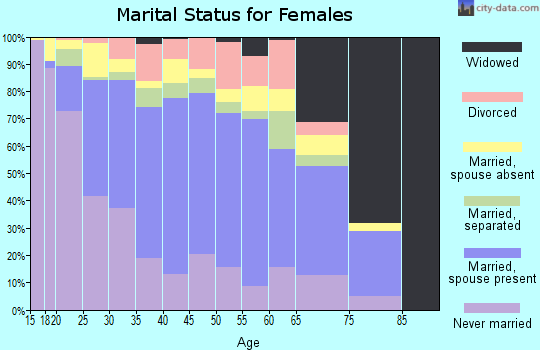
5,739 married couples with children.
1,940 single-parent households (333 men, 1,607 women).
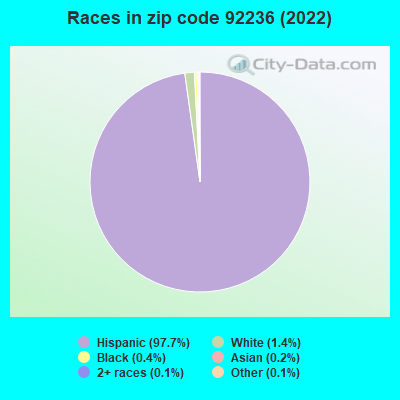
18.4% of residents of 92236 zip code speak English at home.
81.5% of residents speak Spanish at home (48% very well, 23% well, 12% not well, 17% not at all).
0.1% of residents speak Asian or Pacific Island language at home (71% very well, 29% well).
0.2% of residents speak other language at home (12% very well, 38% well, 49% not well).
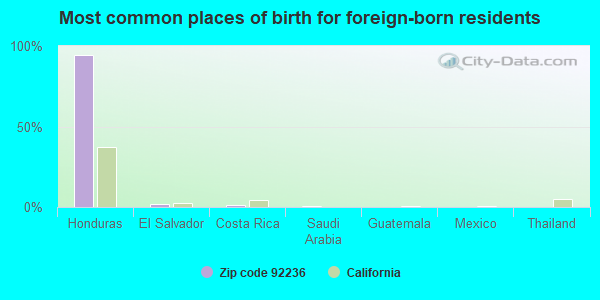
Foreign born population: 17,371 (41.2%) (46.1% of them are naturalized citizens)
This zip code:
41.2%
Whole state:
26.7%
94%Honduras
2%El Salvador
1%Costa Rica
0%Saudi Arabia
0%Guatemala
0%Mexico
0%Thailand
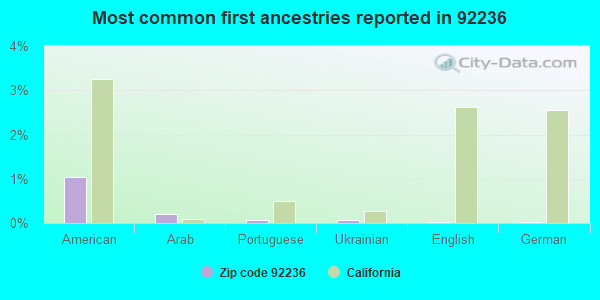
1%American
0%Arab
0%Portuguese
0%Ukrainian
0%English
0%German
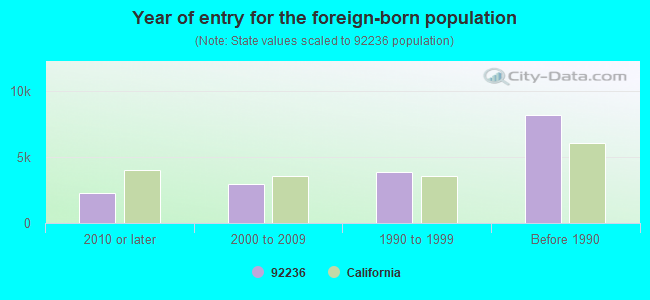
Year of entry for the foreign-born population
2,2652010 or later
2,9842000 to 2009
3,8421990 to 1999
8,190Before 1990
Facilities with environmental interests located in this zip code:
GARNER IMPLEMENT CO (49 980 HWY 86 in COACHELLA, CA)
STATE MASTER (California - Hazardous Waste Tracking) - HAZARDOU WASTE PROGRAM Small Quantity Generators, between 100 kg and 1000 kg of hazardous waste/month (Resource Conservation and Recovery Act (tracking hazardous waste)) - notification Organizations: JACK AND MARY GARNER (CONTACT/OWNER)
LEE ESCHER GIL COMPANY INC (85 119 AVENUE 50 in COACHELLA, CA)
STATE MASTER (California - Hazardous Waste Tracking) - HAZARDOU WASTE PROGRAM Small Quantity Generators, between 100 kg and 1000 kg of hazardous waste/month (Resource Conservation and Recovery Act (tracking hazardous waste)) Alternative names: LEE ESCHER OIL CO INC
ALTENATIVE EDUCATION CENTER (1099 ORCHAD AVENUE in COACHELLA, CA)
(National Center for Education Statistics) - STATE ID-3331048 Organizations: COACHELLA VALLEY UNIFIED (SCHOOL DISTRICT)
CAHUILLA DESERT ACADEMY (JR. HIGH) (82-489 AVENUE 52 in COACHELLA, CA)
(National Center for Education Statistics) - STATE ID-6112874 Organizations: COACHELLA VALLEY UNIFIED (SCHOOL DISTRICT)
ERNIE BALL INC (53973 POLK ST in COACHELLA, CA)
Small Quantity Generators, between 100 kg and 1000 kg of hazardous waste/month (Resource Conservation and Recovery Act (tracking hazardous waste)) Organizations: STERLING BALL (CONTACT/OPERATOR)
FOSTER GARDNER INCORPORATED (1577 1ST ST in COACHELLA, CA)
COMPLIANCE ACTIVITY (Tracking inspections of insecticide, fungicide, and rodenticide, and toxic substances) Small Quantity Generators, between 100 kg and 1000 kg of hazardous waste/month (Resource Conservation and Recovery Act (tracking hazardous waste)) Business NAICS classification: FERTILIZER (MIXING ONLY) MANUFACTURING. Alternative names: FOSTER MFG INC
MC CALLA DIV OF LAYNE WESTERN (53 381 HWY 111 in COACHELLA, CA)
Small Quantity Generators, between 100 kg and 1000 kg of hazardous waste/month (Resource Conservation and Recovery Act (tracking hazardous waste)) - notification
CALIFORNIA CHEMICAL COACHELLA VALLEY (85220 AVENUE 50 in COACHELLA, CA)
COMPLIANCE ACTIVITY (Tracking inspections of insecticide, fungicide, and rodenticide, and toxic substances) Alternative names: CALIFORNIA CHEMICAL OF COACHELLA VALLEY
AMIGO MINI MART (85 509 HIGHWAY 111 in COA CHELLA, CA)
Small Quantity Generators, between 100 kg and 1000 kg of hazardous waste/month (Resource Conservation and Recovery Act (tracking hazardous waste))
GENERAL TELPHONE OF CA (723 VINE ST in COACHELLA, CA)
Small Quantity Generators, between 100 kg and 1000 kg of hazardous waste/month (Resource Conservation and Recovery Act (tracking hazardous waste))
IMPERIAL IRRIGATION DISTRICT- 06286 (1280 GRAPEFRUIT in COACHELLA, CA)
CRITERIA AND HAZARDOUS AIR POLLUTANT INVENTORY (Inventory of air pollution sources) Business SIC classification: ELECTRIC AND OTHER SERVICES COMBINED Alternative names: IMPERIAL IRRIGATION DISTRICT
CATHEDRAL LIQUID SITE (AVENUE 54 WEST OF POLK ST in COACHELLA, CA)
CRITERIA AND HAZARDOUS AIR POLLUTANT INVENTORY (Inventory of air pollution sources) Business SIC classification: REFUSE SYSTEMS Business NAICS classification: SOLID WASTE LANDFILL.
Housing units lacking complete plumbing facilities: 0.4% Housing units lacking complete kitchen facilities: 0.4%
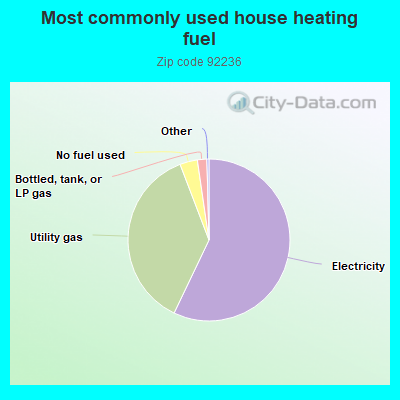
57.1%Electricity
37.1%Utility gas
3.5%No fuel used
1.9%Bottled, tank, or LP gas
Population in 1990: 17,147. Population change in the 1990s: +6,012 (+35.1%).
Place of birth for U.S.-born residents:
This state: 23,741
Northeast: 82
Midwest: 106
South: 531
West: 255
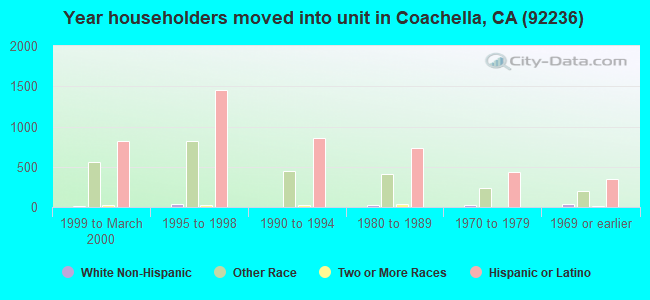
62% of the 92236 zip code residents lived in the same house 5 years ago. Out of people who lived in different houses, 89% lived in this county. Out of people who lived in different counties, 50% lived in California.
99% of the 92236 zip code residents lived in the same house 1 year ago. Out of people who lived in different houses, 118% moved from this county. Out of people who lived in different houses, 13% moved from different county within same state. Out of people who lived in different houses, 5% moved from different state. Out of people who lived in different houses, 3% moved from abroad.
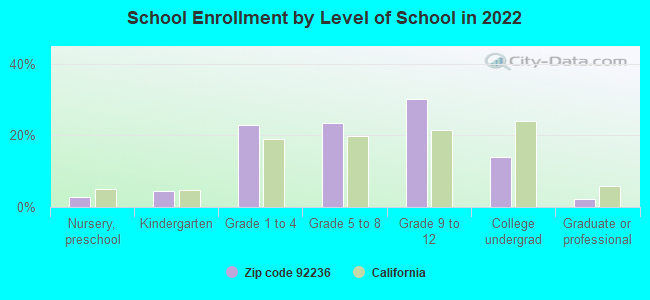
Private vs. public school enrollment:
Students in private schools in grades 1 to 8 (elementary and middle school): 242
Here:
5.8%
California:
10.5%
Students in private schools in grades 9 to 12 (high school): 51
Here:
1.9%
California:
8.5%
Students in private undergraduate colleges: 53
Here:
4.2%
California:
15.9%
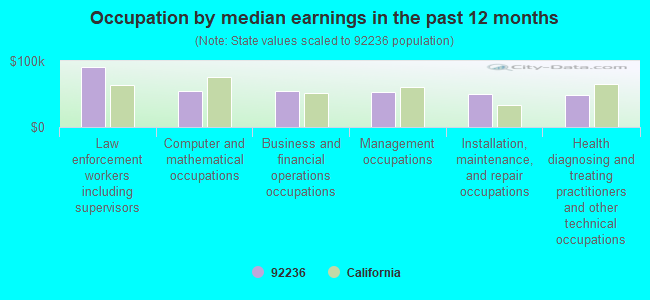
Occupation by median earnings in the past 12 months ($)
90,503Law enforcement workers including supervisors
54,659Computer and mathematical occupations
54,335Business and financial operations occupations
53,285Management occupations
50,058Installation, maintenance, and repair occupations
49,090Health diagnosing and treating practitioners and other technical occupations
Companies with federal contracts located in this zip code (COACHELLA, CA):
ARMTEC DEFENSE PRODUCTS CO (85901 AVENUE 53) : $326,148,149 in 88 contractsfrom 1999 to 2006
Contracts for Ammunition -- Operational Systems Development (R&D), Pyrotechnics, Ammunition, 75 mm through 125 mm, Ammunition, over 30 mm up to 75 mm, and moreby Army, Air Force, Navy Signed by year:2000: $25,520,593; 2001: $45,751,224; 2002: $4,000,571; 2003: $108,148,587; 2004: $27,036,321; 2005: $60,225,158; 2006: $53,729,117.
Biggest contracts:
$32,951,468 with Army for Ammunition -- Operational Systems Development (R&D). Signed on 2003-03-20. Completion date: 2008-03-28.
$26,423,250 with Army for Pyrotechnics. Signed on 2006-02-07. Completion date: 2006-03-15.
$24,123,000 with Army for Ammunition -- Operational Systems Development (R&D). Signed on 2001-11-29. Completion date: 2003-06-30.
$22,005,345, same as above.Signed on 2003-11-20. Completion date: 2008-03-28.
ARMTEC COUNTERMEASURES COMPANY (85901 AVENUE 53; small business) : $81,356,921 in 34 contractsfrom 2003 to 2006
Contracts for Electronic Countermeasures, Counter-Countermeasures and Quick Reaction Capability Equipment, Pyrotechnics, Cartridge and Propellant Actuated Devices and Components by Navy, Army, Air Force, Defense Logistics Agency, and others Signed by year:2000: $0; 2001: $0; 2002: $0; 2003: $5,962,301; 2004: $37,832,582; 2005: $14,380,228; 2006: $23,181,810.
Biggest contracts:
$12,639,068 with Navy for Electronic Countermeasures, Counter-Countermeasures and Quick Reaction Capability Equipment. Signed on 2004-06-10. Completion date: 2006-06-30.
$10,809,113 with Army for Pyrotechnics. Signed on 2006-02-28. Completion date: 2007-04-30.
$6,985,692 with Air Force for Pyrotechnics. Signed on 2004-09-30. Completion date: 2006-06-30.
$5,941,996 with Navy for Electronic Countermeasures, Counter-Countermeasures and Quick Reaction Capability Equipment. Signed on 2005-02-15. Completion date: 2006-07-31.
LEE ESCHER OIL COMPANY INC (85119 AVENUE 50; small business) : $6,625,246 in 35 contractsfrom 2002 to 2005
Contracts for Liquid Propellants and Fuels, Petroleum Base, Fuel Oils by Defense Logistics Agency Signed by year:2000: $0; 2001: $0; 2002: $30,578; 2003: $0; 2004: $268,048; 2005: $6,326,620; 2006: $0.
Biggest contracts:
$5,809,757 with Defense Logistics Agency for Liquid Propellants and Fuels, Petroleum Base. Signed on 2005-04-01. Completion date: 2009-08-31.
$140,033 with Defense Logistics Agency for Fuel Oils. Signed on 2005-05-26. Completion date: 2007-03-31.
$90,495, same as above.Signed on 2004-02-18. Completion date: 2004-02-26.
$90,495, same as above.Signed on 2004-02-18. Completion date: 2004-02-23.
SEACON BRANTNER & ASSOCIATES (86695 AVENUE 54, UNIT C; small business) : $92,793 in 7 contractsfrom 2004 to 2006
Contracts for Connectors, Electrical, Switches, Cable, Cord, and Wire Assemblies: Communications Equipment, Miscellaneous Electric Power and Distribution Equipment by Navy Signed by year:2000: $0; 2001: $0; 2002: $0; 2003: $0; 2004: $60,801; 2005: $23,867; 2006: $8,125.
Biggest contracts:
$34,994 with Navy for Connectors, Electrical. Signed on 2004-04-07. Completion date: 2004-05-28.
$12,900 with Navy for Switches. Signed on 2005-05-31. Completion date: 2005-06-21.
$11,390 with Navy for Cable, Cord, and Wire Assemblies: Communications Equipment. Signed on 2004-06-01. Completion date: 2004-07-19.
$10,967 with Navy for Connectors, Electrical. Signed on 2005-03-29. Completion date: 2005-06-20.
Top industries in this zip code by the number of employees in 2005:
2006 - 2018 National Fire Incident Reporting System (NFIRS) incidents
According to the data from the years 2006 - 2018 the average number of fires per year is 126. The highest number of fire incidents - 227 took place in 2007, and the least - 26 in 2006. The data has an increasing trend.
When looking into fire subcategories, the most incidents belonged to: Outside Fires (55.7%), and Mobile Property/Vehicle Fires (26.4%).
Fire incident types reported to NFIRS in Zip Code 92236


 Nearest zip codes: 92201, 92203, 92253, 92210, 92211, 92241.
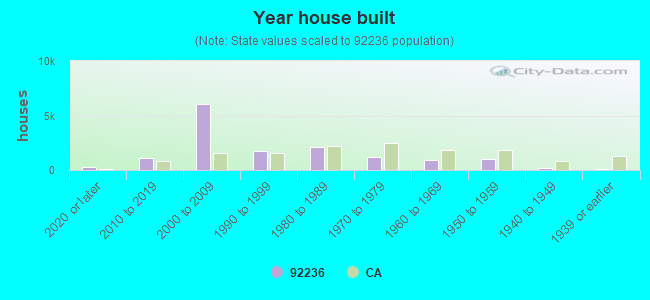


 According to the data from the years 2006 - 2018 the average number of fires per year is 126. The highest number of fire incidents - 227 took place in 2007, and the least - 26 in 2006. The data has an increasing trend.
 When looking into fire subcategories, the most incidents belonged to: Outside Fires (55.7%), and Mobile Property/Vehicle Fires (26.4%).