Estimated zip code population in 2022: 17,455 Zip code population in 2010: 23,575 Zip code population in 2000: 24,085
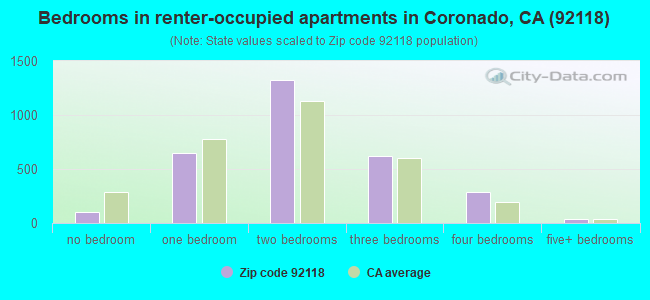
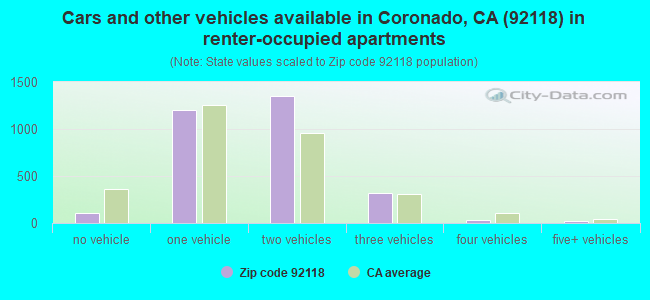
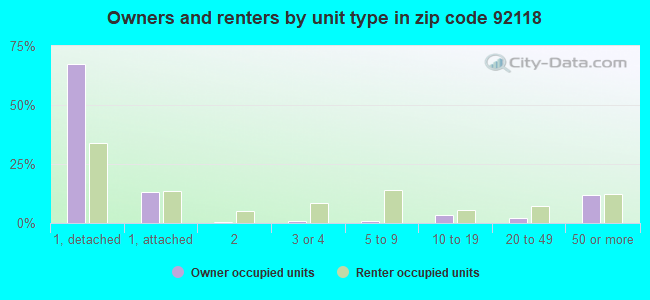
Houses and condos: 9,396 Renter-occupied apartments: 3,033
% of renters here:
46%
State:
44%
March 2022 cost of living index in zip code 92118: 135.3 (high, U.S. average is 100)
Land area: 7.8 sq. mi. Water area: 1.6 sq. mi.
Population density: 2,252 people per square mile
(low).
OSM Map
General Map
Google Map
MSN Map
OSM Map
General Map
Google Map
MSN Map
OSM Map
General Map
Google Map
MSN Map
OSM Map
General Map
Google Map
MSN Map
Please wait while loading the map...
Real estate property taxes paid for housing units in 2022:
This zip code:
0.5% ($9,689)
California:
0.7% ($4,831)
Median real estate property taxes paid for housing units with mortgages in 2022: $10,330 (0.5%) Median real estate property taxes paid for housing units with no mortgage in 2022: $7,699 (0.4%)
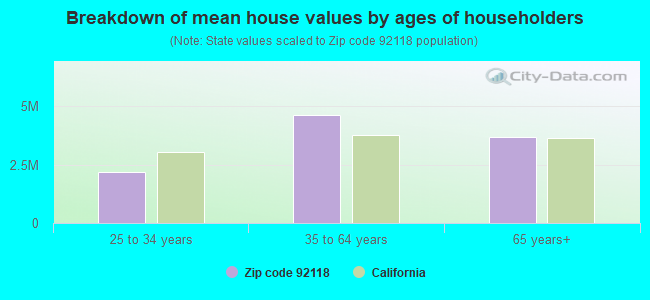
Estimated median house/condo value in 2022: $2,032,709
92118:
$2,032,709
California:
$715,900
According to our research of California and other state lists, there were 3 registered sex offenders living in 92118 zip code as of May 04, 2024. The ratio of all residents to sex offenders in zip code 92118 is 7,936 to 1. The ratio of registered sex offenders to all residents in this zip code is much lower than the state average.
Median resident age:
This zip code:
42.8 years
California median age:
37.9 years
Average household size:
This zip code:
2.3 people
California:
2.8 people
Averages for the 2020 tax year for zip code 92118, filed in 2021:
Average Adjusted Gross Income (AGI) in 2020: $170,475 (Individual Income Tax Returns)
Here:
$170,475
State:
$95,910
Salary/wage: $111,842 (reported on 70.1% of returns)
Here:
$111,842
State:
$77,331
(% of AGI for various income ranges: 1280.8% for AGIs below $25k, 3655.2% for AGIs $25k-50k, 6508.6% for AGIs $50k-75k, 9336.2% for AGIs $75k-100k, 17338.3% for AGIs $100k-200k, 98880.3% for AGIs over 200k)
Taxable interest for individuals: $4,162 (reported on 54.8% of returns)
This zip code:
$4,162
California:
$2,294
(% of AGI for various income ranges: 35.0% for AGIs below $25k, 95.8% for AGIs $25k-50k, 159.5% for AGIs $50k-75k, 225.1% for AGIs $75k-100k, 540.7% for AGIs $100k-200k, 2920.3% for AGIs over 200k)
Ordinary dividends: $20,350 (reported on 46.8% of returns)
Here:
$20,350
State:
$10,949
(% of AGI for various income ranges: 114.3% for AGIs below $25k, 224.8% for AGIs $25k-50k, 490.0% for AGIs $50k-75k, 719.7% for AGIs $75k-100k, 1471.2% for AGIs $100k-200k, 14822.9% for AGIs over 200k)
Net capital gain/loss in AGI: +$50,915 (reported on 44.5% of returns)
Here:
+$50,915
State:
+$49,306
(% of AGI for various income ranges: 62.5% for AGIs below $25k, 131.9% for AGIs $25k-50k, 217.2% for AGIs $50k-75k, 622.6% for AGIs $75k-100k, 1412.0% for AGIs $100k-200k, 43561.8% for AGIs over 200k)
Profit/loss from business: +$35,118 (reported on 18.9% of returns)
Here:
+$35,118
State:
+$15,671
(% of AGI for various income ranges: 185.0% for AGIs below $25k, 180.4% for AGIs $25k-50k, 383.3% for AGIs $50k-75k, 492.6% for AGIs $75k-100k, 888.3% for AGIs $100k-200k, 10230.5% for AGIs over 200k)
Taxable individual retirement arrangement distribution: $33,721 (reported on 14.7% of returns)
92118:
$33,721
California:
$23,505
(% of AGI for various income ranges: 66.5% for AGIs below $25k, 175.7% for AGIs $25k-50k, 315.7% for AGIs $50k-75k, 662.1% for AGIs $75k-100k, 1453.7% for AGIs $100k-200k, 5687.4% for AGIs over 200k)
Self-employed (Keogh) retirement plans: $36,600 (reported on 2.4% of returns)
92118:
$36,600
California:
$30,163
(% of AGI for various income ranges: 105.3% for AGIs $100k-200k, 1605.5% for AGIs over 200k)
Total itemized deductions: $47,351 (reported on 25.2% of returns)
Here:
$47,351
State:
$39,517
(% of AGI for various income ranges: 222.2% for AGIs below $25k, 443.0% for AGIs $25k-50k, 877.2% for AGIs $50k-75k, 1388.2% for AGIs $75k-100k, 2798.6% for AGIs $100k-200k, 15107.1% for AGIs over 200k)
Charity contributions: $15,455 (reported on 22.0% of returns)
Here:
$15,455
State:
$12,598
(% of AGI for various income ranges: 9.1% for AGIs below $25k, 41.2% for AGIs $25k-50k, 94.3% for AGIs $50k-75k, 201.0% for AGIs $75k-100k, 542.1% for AGIs $100k-200k, 5586.8% for AGIs over 200k)
Taxes paid: $8,968 (reported on 25.2% of returns)
92118:
$8,968
State:
$8,807
(% of AGI for various income ranges: 41.7% for AGIs below $25k, 73.4% for AGIs $25k-50k, 174.0% for AGIs $50k-75k, 304.6% for AGIs $75k-100k, 695.1% for AGIs $100k-200k, 2477.1% for AGIs over 200k)
Earned income credit: $1,606 (reported on 6.0% of returns)
Here:
$1,606
State:
$2,074
(% of AGI for various income ranges: 39.1% for AGIs below $25k, 51.4% for AGIs $25k-50k)
Percentage of individuals using paid preparers for their 2020 taxes: 93.2%
Here:
93%
State:
92%
(% for various income ranges: 90.7% for AGIs below $25k, 93.9% for AGIs $25k-50k, 93.7% for AGIs $50k-75k, 93.2% for AGIs $75k-100k, 94.5% for AGIs $100k-200k, 93.4% for AGIs over 200k)
Averages for the 2012 tax year for zip code 92118, filed in 2013:
Average Adjusted Gross Income (AGI) in 2012: $117,315 (Individual Income Tax Returns)
Here:
$117,315
State:
$72,726
Salary/wage: $80,477 (reported on 71.6% of returns)
Here:
$80,477
State:
$59,079
(% of AGI for various income ranges: 71.8% for AGIs below $25k, 69.7% for AGIs $25k-50k, 61.0% for AGIs $50k-75k, 59.2% for AGIs $75k-100k, 53.0% for AGIs $100k-200k, 41.2% for AGIs over 200k)
Taxable interest for individuals: $3,862 (reported on 54.9% of returns)
This zip code:
$3,862
California:
$2,146
(% of AGI for various income ranges: 3.0% for AGIs below $25k, 1.6% for AGIs $25k-50k, 1.9% for AGIs $50k-75k, 1.6% for AGIs $75k-100k, 1.9% for AGIs $100k-200k, 1.8% for AGIs over 200k)
Ordinary dividends: $10,617 (reported on 42.6% of returns)
Here:
$10,617
State:
$9,308
(% of AGI for various income ranges: 5.1% for AGIs below $25k, 3.0% for AGIs $25k-50k, 4.3% for AGIs $50k-75k, 4.1% for AGIs $75k-100k, 4.5% for AGIs $100k-200k, 3.5% for AGIs over 200k)
Net capital gain/loss in AGI: +$37,826 (reported on 37.7% of returns)
Here:
+$37,826
State:
+$30,460
(% of AGI for various income ranges: 0.9% for AGIs below $25k, 1.5% for AGIs $25k-50k, 1.5% for AGIs $50k-75k, 1.7% for AGIs $75k-100k, 2.6% for AGIs $100k-200k, 20.9% for AGIs over 200k)
Profit/loss from business: +$27,078 (reported on 19.1% of returns)
Here:
+$27,078
State:
+$17,064
(% of AGI for various income ranges: 10.1% for AGIs below $25k, 4.9% for AGIs $25k-50k, 4.4% for AGIs $50k-75k, 3.0% for AGIs $75k-100k, 4.6% for AGIs $100k-200k, 4.2% for AGIs over 200k)
Taxable individual retirement arrangement distribution: $30,540 (reported on 16.3% of returns)
92118:
$30,540
California:
$19,557
(% of AGI for various income ranges: 3.9% for AGIs below $25k, 2.6% for AGIs $25k-50k, 3.4% for AGIs $50k-75k, 4.5% for AGIs $75k-100k, 5.2% for AGIs $100k-200k, 4.1% for AGIs over 200k)
Self-employment retirement plans: $31,147 (reported on 2.4% of returns)
92118:
$31,147
California:
$24,530
(% of AGI for various income ranges: 0.6% for AGIs $25k-50k, 0.4% for AGIs $100k-200k, 0.9% for AGIs over 200k)
Total itemized deductions: $45,953 (22% of AGI, reported on 45.0% of returns)
Here:
$45,953
State:
$34,004
Here:
22.1% of AGI
State:
22.7% of AGI
(% of AGI for various income ranges: 19.7% for AGIs below $25k, 13.0% for AGIs $25k-50k, 15.2% for AGIs $50k-75k, 17.2% for AGIs $75k-100k, 19.3% for AGIs $100k-200k, 17.6% for AGIs over 200k)
Charity contributions: $6,589 (reported on 39.4% of returns)
Here:
$6,589
State:
$4,659
(% of AGI for various income ranges: 1.2% for AGIs below $25k, 1.2% for AGIs $25k-50k, 1.8% for AGIs $50k-75k, 2.4% for AGIs $75k-100k, 2.5% for AGIs $100k-200k, 2.3% for AGIs over 200k)
Taxes paid: $20,380 (reported on 44.8% of returns)
92118:
$20,380
State:
$14,448
(% of AGI for various income ranges: 4.6% for AGIs below $25k, 3.2% for AGIs $25k-50k, 4.3% for AGIs $50k-75k, 5.1% for AGIs $75k-100k, 7.3% for AGIs $100k-200k, 9.4% for AGIs over 200k)
Earned income credit: $1,771 (reported on 8.2% of returns)
Here:
$1,771
State:
$2,286
(% of AGI for various income ranges: 3.3% for AGIs below $25k, 0.7% for AGIs $25k-50k)
Percentage of individuals using paid preparers for their 2012 taxes: 60.0%
Here:
60%
State:
64%
(% for various income ranges: 51.2% for AGIs below $25k, 48.6% for AGIs $25k-50k, 59.0% for AGIs $50k-75k, 64.2% for AGIs $75k-100k, 67.3% for AGIs $100k-200k, 80.6% for AGIs over 200k)
Averages for the 2004 tax year for zip code 92118, filed in 2005:
Average Adjusted Gross Income (AGI) in 2004: $92,072 (Individual Income Tax Returns)
Here:
$92,072
State:
$58,600
Salary/wage: $63,008 (reported on 69.2% of returns)
Here:
$63,008
State:
$49,455
(% of AGI for various income ranges: 65.3% for AGIs $10k-25k, 69.7% for AGIs $25k-50k, 61.3% for AGIs $50k-75k, 54.9% for AGIs $75k-100k, 39.4% for AGIs over 100k)
Taxable interest for individuals: $4,135 (reported on 64.5% of returns)
This zip code:
$4,135
California:
$2,365
(% of AGI for various income ranges: 3.9% for AGIs $10k-25k, 2.5% for AGIs $25k-50k, 3.3% for AGIs $50k-75k, 2.7% for AGIs $75k-100k, 2.6% for AGIs over 100k)
Taxable dividends: $8,596 (reported on 47.8% of returns)
Here:
$8,596
State:
$4,746
(% of AGI for various income ranges: 4.5% for AGIs $10k-25k, 3.2% for AGIs $25k-50k, 4.2% for AGIs $50k-75k, 4.2% for AGIs $75k-100k, 4.4% for AGIs over 100k)
Net capital gain/loss: +$34,328 (reported on 43.1% of returns)
Here:
+$34,328
State:
+$23,418
(% of AGI for various income ranges: 0.7% for AGIs $10k-25k, 1.0% for AGIs $25k-50k, 2.3% for AGIs $50k-75k, 2.3% for AGIs $75k-100k, 22.1% for AGIs over 100k)
Profit/loss from business: +$29,613 (reported on 17.7% of returns)
Here:
+$29,613
State:
+$16,826
(% of AGI for various income ranges: 7.7% for AGIs $10k-25k, 3.9% for AGIs $25k-50k, 3.2% for AGIs $50k-75k, 4.9% for AGIs $75k-100k, 6.3% for AGIs over 100k)
IRA payment deduction: $3,370 (reported on 3.5% of returns)
92118:
$3,370
California:
$3,192
(% of AGI for various income ranges: 0.3% for AGIs $10k-25k, 0.3% for AGIs $25k-50k, 0.2% for AGIs $50k-75k, 0.2% for AGIs $75k-100k, 0.1% for AGIs over 100k)
Self-employed pension: $26,115 (reported on 3.1% of returns)
Here:
$26,115
California:
$17,688
(% of AGI for various income ranges: 0.2% for AGIs $25k-50k, 0.2% for AGIs $50k-75k, 0.4% for AGIs $75k-100k, 1.2% for AGIs over 100k)
Total itemized deductions: $38,058 (22% of AGI, reported on 43.0% of returns)
Here:
$38,058
State:
$28,113
Here:
22.3% of AGI
State:
25.3% of AGI
(% of AGI for various income ranges: 19.5% for AGIs $10k-25k, 13.2% for AGIs $25k-50k, 17.7% for AGIs $50k-75k, 19.2% for AGIs $75k-100k, 17.6% for AGIs over 100k)
Charity contributions deductions: $5,802 (3% of AGI, reported on 39.0% of returns)
Here:
$5,802
State:
$3,923
Here:
3.2% of AGI
State:
3.3% of AGI
(% of AGI for various income ranges: 1.2% for AGIs $10k-25k, 1.5% for AGIs $25k-50k, 2.3% for AGIs $50k-75k, 2.5% for AGIs $75k-100k, 2.6% for AGIs over 100k)
Total tax: $17,738 (reported on 82.9% of returns)
92118:
$17,738
State:
$10,761
(% of AGI for various income ranges: 5.2% for AGIs $10k-25k, 7.5% for AGIs $25k-50k, 9.4% for AGIs $50k-75k, 11.0% for AGIs $75k-100k, 18.8% for AGIs over 100k)
Earned income credit: $1,230 (reported on 6.4% of returns)
Here:
$1,230
State:
$1,763
Percentage of individuals using paid preparers for their 2004 taxes: 62.4%
Here:
62%
State:
66%
(% for various income ranges: 55.5% for AGIs below $10k, 57.4% for AGIs $10k-25k, 58.7% for AGIs $25k-50k, 62.0% for AGIs $50k-75k, 63.2% for AGIs $75k-100k, 73.2% for AGIs over 100k)
Likely homosexual households (counted as self-reported same-sex unmarried-partner households)
Lesbian couples: 0.0% of all households
Gay men: 0.0% of all households
Household received Food Stamps/SNAP in the past 12 months: 129 Household did not receive Food Stamps/SNAP in the past 12 months: 6,381
Women who had a birth in the past 12 months: 139 (139 now married, 0 unmarried) Women who did not have a birth in the past 12 months: 3,027 (1,587 now married, 1,424 unmarried)
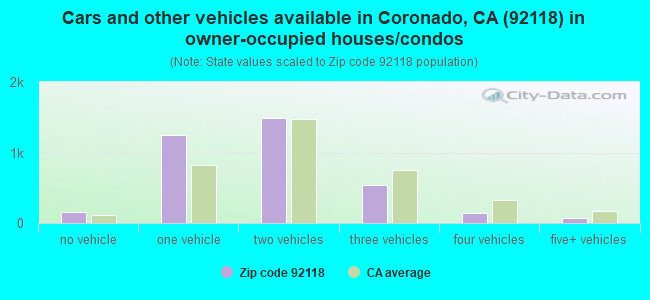
Housing units in zip code 92118 with a mortgage: 1,953 (290 second mortgage, 278 both second mortgage and home equity loan) Houses without a mortgage: 31
Median monthly owner costs for units with a mortgage: $3,876 Median monthly owner costs for units without a mortgage: $1,328
Residents with income below the poverty level in 2022:
This zip code:
6.0%
Whole state:
12.2%
Residents with income below 50% of the poverty level in 2022:
This zip code:
1.4%
Whole state:
6.2%
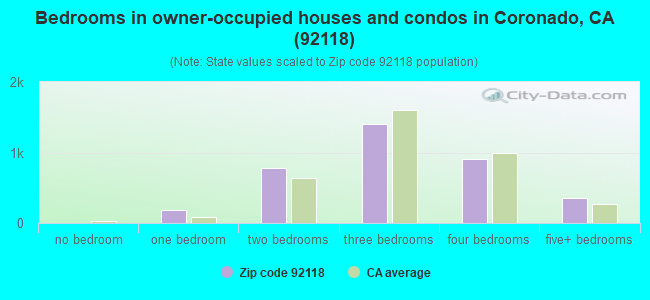
Median number of rooms in houses and condos:
Here:
6.1
State:
6.0
Median number of rooms in apartments:
Here:
4.4
State:
3.9
Notable locations in this zip code not listed on our city pages
Notable locations in zip code 92118: Coronado Municipal Golf Course (A), Coronado Yacht Club (B), Glorietta Bay Marina (C), Coronado Public Library (D), Coronado Fire Department Station 37 (E), Federal Fire Department Station 1 (F), Coronado Fire Department Station 36 (G), Hotel Del Coronado (H), Coronado City Public Library (I), Coronado Baptist Day Care Center (J), Coronado Museum of History and Art (K). Display/hide their locations on the map
Shopping Centers: Coronado Ferry Landing Shopping Center (1), Old Ferry Landing Shopping Center (2), Coronado Shopping Plaza Shopping Center (3). Display/hide their locations on the map
Churches in zip code 92118 include: Christ Episcopal Church (A), Coronado Baptist Church (B), First Baptist Church (C), First Church of Christ Scientist (D), Graham Memorial Presbyterian Church (E), Living Waters Christian Fellowship Church (F), Resurrection Lutheran Church (G), Sacred Heart Roman Catholic Church (H), Saint Pauls United Methodist Church (I). Display/hide their locations on the map
Parks in zip code 92118 include: Silver Strand State Beach (1), Star Park (2), Sunset Park (3), Bayview Park (4), Centennial Park (5), Cutler Field (6), L C Bandell Park (7), Mathenson Park (8), Shoreline Park (9). Display/hide their locations on the map
In group quarters: 2,207 (-1 institutionalized population)
Size of family households: 2,704 2-persons, 1,053 3-persons, 639 4-persons, 218 5-persons, 56 6-persons, 50 7-or-more-persons
Size of nonfamily households: 1,672 1-person, 282 2-persons, 16 3-persons
2,495 married couples with children.
574 single-parent households (86 men, 488 women).
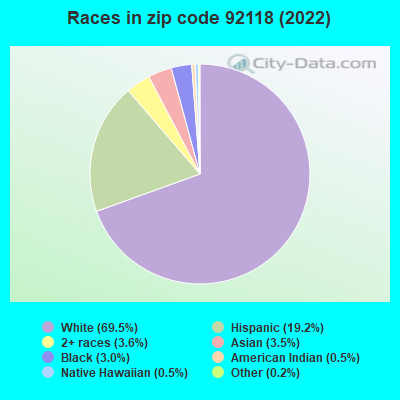
83.7% of residents of 92118 zip code speak English at home.
11.2% of residents speak Spanish at home (78% very well, 18% well, 4% not well).
2.5% of residents speak other Indo-European language at home (100% very well).
2.0% of residents speak Asian or Pacific Island language at home (74% very well, 22% well, 4% not well).
0.5% of residents speak other language at home (19% very well, 81% well).
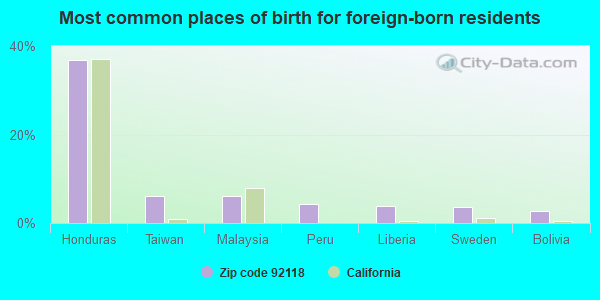
Foreign born population: 1,728 (9.9%) (66.9% of them are naturalized citizens)
This zip code:
9.9%
Whole state:
26.7%
37%Honduras
6%Taiwan
6%Malaysia
4%Peru
4%Liberia
4%Sweden
3%Bolivia
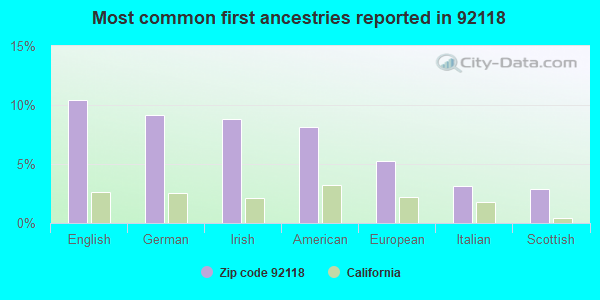
10%English
9%German
9%Irish
8%American
5%European
3%Italian
3%Scottish
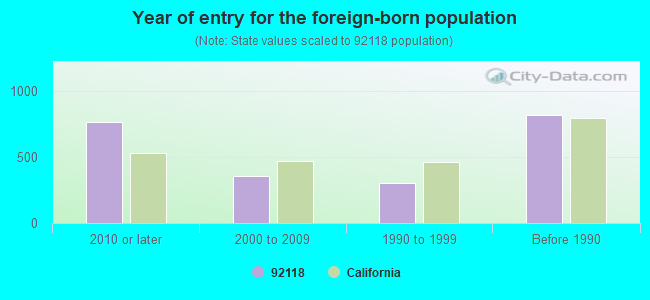
Year of entry for the foreign-born population
7682010 or later
3592000 to 2009
3071990 to 1999
821Before 1990
Facilities with environmental interests located in this zip code:
ISLAND CLEANERS (822 ORANGE AVE in CORONADO, CA)
STATE MASTER (California - Hazardous Waste Tracking) - HAZARDOU WASTE PROGRAM CRITERIA AND HAZARDOUS AIR POLLUTANT INVENTORY (Inventory of air pollution sources) Small Quantity Generators, between 100 kg and 1000 kg of hazardous waste/month (Resource Conservation and Recovery Act (tracking hazardous waste)) - notification Business SIC classification: DRYCLEANING PLANTS, EXCEPT RUG CLEANING Organizations: NADIA TERZIBACHIAN (CONTACT/OWNER)
LOEWS CORONADO BAY RESORT (4000 CORONADO BAY RD in CORONADO, CA)
STATE MASTER (California - Hazardous Waste Tracking) - HAZARDOU WASTE PROGRAM CRITERIA AND HAZARDOUS AIR POLLUTANT INVENTORY (Inventory of air pollution sources) Small Quantity Generators, between 100 kg and 1000 kg of hazardous waste/month (Resource Conservation and Recovery Act (tracking hazardous waste)) - notification Business SIC classification: HOTELS AND MOTELS Organizations: CORONADO BAY VENTURE (CONTACT/OWNER)
NAVIGATIONAL SERVICES INC (NORTH ISLAND NAVAL STATION in CORONADO, CA)
Small Quantity Generators, between 100 kg and 1000 kg of hazardous waste/month (Resource Conservation and Recovery Act (tracking hazardous waste)) Organizations: FRANK SOTO SR (CONTACT/OPERATOR)
, FRANK SOTO (CONTACT/OWNER)
HOTEL DEL CORONADO (1500 ORANGE AVE in CORONADO, CA)
COMPLIANCE ACTIVITY (Tracking inspections of insecticide, fungicide, and rodenticide, and toxic substances) CRITERIA AND HAZARDOUS AIR POLLUTANT INVENTORY (Inventory of air pollution sources) Business SIC classification: IRON AND STEEL FORGINGS; HOTELS AND MOTELS Business NAICS classification: IRON AND STEEL FORGING.
GOLF COURSE GARBAGE DISP AREA (SHERMAN ROAD NAS NORTH ISLAND in CORONADO, CA)
CRITERIA AND HAZARDOUS AIR POLLUTANT INVENTORY (Inventory of air pollution sources) Business SIC classification: REFUSE SYSTEMS Business NAICS classification: SOLID WASTE LANDFILL.
GRAND CARIBE ISLE STOCKPILES (CARIBE CAY BOULEVARD NORTH in CORONADO, CA)
CRITERIA AND HAZARDOUS AIR POLLUTANT INVENTORY (Inventory of air pollution sources) Business SIC classification: REFUSE SYSTEMS Business NAICS classification: SOLID WASTE LANDFILL.
CHRIST CHURCH DAY SCHOOL (P O BOX 66 in CORONADO, CA)
COMPLIANCE ACTIVITY (Tracking inspections of insecticide, fungicide, and rodenticide, and toxic substances)
Housing units lacking complete plumbing facilities: 0.2% Housing units lacking complete kitchen facilities: 0.8%
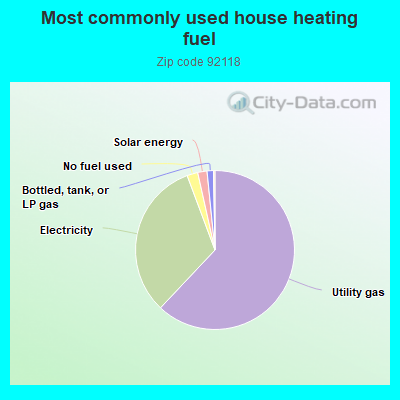
62.1%Utility gas
32.3%Electricity
2.2%No fuel used
1.9%Solar energy
1.3%Bottled, tank, or LP gas
Population in 1990: 16,670. Population change in the 1990s: +7,415 (+44.5%).
Place of birth for U.S.-born residents:
This state: 6,643
Northeast: 2,207
Midwest: 1,872
South: 2,962
West: 1,335
37% of the 92118 zip code residents lived in the same house 5 years ago. Out of people who lived in different houses, 38% lived in this county. Out of people who lived in different counties, 50% lived in California.
82% of the 92118 zip code residents lived in the same house 1 year ago. Out of people who lived in different houses, 41% moved from this county. Out of people who lived in different houses, 21% moved from different county within same state. Out of people who lived in different houses, 30% moved from different state. Out of people who lived in different houses, 8% moved from abroad.
Private vs. public school enrollment:
Students in private schools in grades 1 to 8 (elementary and middle school): 349
Here:
24.1%
California:
10.5%
Students in private schools in grades 9 to 12 (high school): 59
Here:
6.4%
California:
8.5%
Students in private undergraduate colleges: 151
Here:
19.1%
California:
15.9%
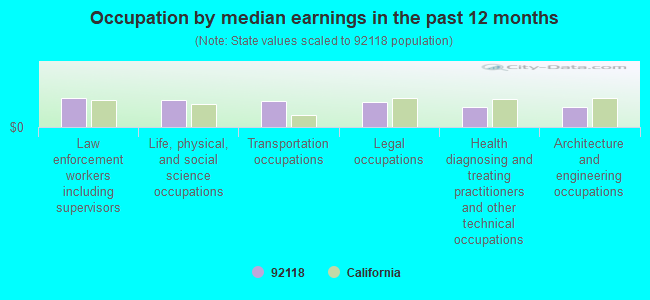
Occupation by median earnings in the past 12 months ($)
179,559Law enforcement workers including supervisors
165,316Life, physical, and social science occupations
163,408Transportation occupations
155,465Legal occupations
126,677Health diagnosing and treating practitioners and other technical occupations
121,062Architecture and engineering occupations
Companies with biggest federal contracts located in this zip code:
MAXWELL TECHNOLOGIES, INC (888 BALBOA AVE in SAN DIEGO, CA) : $8,609,010 in 34 contractsfrom 1999 to 2000
Contracts for Other Defense -- Applied Research and Exploratory Development (R&D), Other Defense -- Engineering Development (R&D), Aeronautics and Space Technology -- Engineering Development (R&D), Defense Missile and Space Systems -- Advanced Development (R&D), and moreby Department of Defense, NASA Signed by year:2000: $5,330,990; 2001: $0; 2002: $0; 2003: $0; 2004: $0; 2005: $0; 2006: $0.
Biggest contracts:
$1,101,076 with Department of Defense for Other Defense -- Applied Research and Exploratory Development (R&D). Signed on 2000-03-23. Completion date: 2001-10-23.
$919,000, same as above.Signed on 2000-12-20. Completion date: 2005-11-24.
$894,000 with Department of Defense for Other Defense -- Engineering Development (R&D). Signed on 1999-12-10. Completion date: 2000-09-30.
$500,000 with Department of Defense for Other Defense -- Applied Research and Exploratory Development (R&D). Signed on 2000-03-27. Completion date: 2000-08-30.
PROSPECTIVE COMPUTER ANALYSTS (1224 10TH ST STE 207 in CORONADO, CA; small business) : $4,507,594 in 16 contractsfrom 2000 to 2003
Contracts for ADP Software by Navy, Army, Air Force Signed by year:2000: $906,086; 2001: $1,262,995; 2002: $1,378,700; 2003: $959,813; 2004: $0; 2005: $0; 2006: $0.
Biggest contracts:
$829,946 with Navy for ADP Software. Taking place in NY. Signed on 2002-12-31. Completion date: 2003-12-31.
$751,382 with Navy for ADP Software. Signed on 2001-12-01. Completion date: 2002-11-30.
$350,000 with Navy for ADP Software. Taking place in NY. Signed on 2003-08-07. Completion date: 2003-10-31.
$349,928, same as above.Signed on 2001-06-11. Completion date: 2001-06-10.
TACTICAL AIR OPERATIONS, INC (600 MARGARITA AVE in CORONADO, CA; small business) : $2,328,360 in 23 contractsfrom 2004 to 2006
Contracts for Education Services, Other Education and Training Services by Navy Signed by year:2000: $0; 2001: $0; 2002: $0; 2003: $0; 2004: $1,826,010; 2005: $0; 2006: $502,350.
Biggest contracts:
$213,422 with Navy for Education Services. Signed on 2004-04-13. Completion date: 2005-03-31.
$205,688 with Navy for Other Education and Training Services. Signed on 2004-02-25. Completion date: 2004-03-26.
$175,281 with Navy for Education Services. Signed on 2004-06-08. Completion date: 2004-06-25.
$149,850 with Navy for Other Education and Training Services. Signed on 2006-02-08. Completion date: 2006-05-31.
SILVERMAN, EUGENE (321 I AVE in CORONADO, CA; small business) : $991,296 in 4 contractsfrom 2003 to 2005
$292,320 with Navy for Radiology Services. Signed on 2005-10-19. Completion date: 2005-09-30.
$283,968, same as above.Signed on 2004-10-14. Completion date: 2005-09-30.
$276,672, same as above.Signed on 2003-10-01. Completion date: 2004-09-30.
$138,336, same as above.Signed on 2003-02-06. Completion date: 2003-09-30.
LUIKEN, GEORGE A , MD (1211 ALAMEDA BLVD in CORONADO, CA; small business) : $718,891 in 3 contractsfrom 2004 to 2005
$327,461 with Navy for Other Medical Services. Signed on 2005-10-20. Completion date: 2004-09-30.
$314,870, same as above.Signed on 2004-10-14. Completion date: 2004-09-30.
$76,560, same as above.Signed on 2004-04-30. Completion date: 2004-09-30.
PERFORMANCE PARTNERS PLUS (1012 PARK PLACE in CORONADO, CA; small business) : $597,622 in 16 contractsfrom 1999 to 2006
Contracts for Other Social Services, Medical/Psychiatric Consultation Services, Dependent Medicare Services by Navy Signed by year:2000: $58,300; 2001: $60,261; 2002: $96,894; 2003: $99,688; 2004: $84,453; 2005: $25,200; 2006: $12,600.
Biggest contracts:
$84,453 with Navy for Other Social Services. Signed on 2004-09-30. Completion date: 2004-02-14.
$81,787 with Navy for Medical/Psychiatric Consultation Services. Signed on 1999-10-01. Completion date: 1999-09-30.
$78,439, same as above.Signed on 1999-10-01. Completion date: 2000-09-30.
$70,368 with Navy for Other Social Services. Signed on 2003-09-30. Completion date: 2004-02-14.
MERRI BETH CULLY PA-C (971 CABRILLO AVE in CORONADO, CA; small business) : $312,233 in 3 contractsfrom 2004 to 2005
$141,482 with Navy for Other Medical Services. Signed on 2005-10-20. Completion date: 2005-09-30.
$137,223, same as above.Signed on 2004-10-22. Completion date: 2005-09-30.
$33,528, same as above.Signed on 2004-06-15. Completion date: 2004-09-30.
GARRISON TECHNOLOGY INCORPORAT (631 A AVENUE in CORONADO, CA; small business) : $299,981 in 3 contractsfrom 2002 to 2003
$99,997 with Navy for Engineering and Technical Services. Signed on 2002-06-07. Completion date: 2003-04-11.
$99,993, same as above.Signed on 2003-01-09. Completion date: 2003-10-31.
$99,991, same as above.Signed on 2003-06-17. Completion date: 2004-04-30.
BRE/HOMESTEAD VILLAGE, LLC (7444 MISSION VALLEY ROAD in SAN DIEGO, CA; small business) : $271,486 in 4 contractsfrom 2003 to 2004
$126,000 with Navy for Lodging - Hotel/Motel. Signed on 2003-12-03. Completion date: 2003-10-16.
$112,800, same as above.Signed on 2003-11-04. Completion date: 2003-10-16.
$30,000, same as above.Signed on 2004-03-10. Completion date: 2003-10-16.
$2,686, same as above.Signed on 2004-03-12. Completion date: 2003-10-16.
KAUPP & ASSOCIATES INC (1133 1ST ST UNIT 418 in CORONADO, CA; small business) : $247,128 in 4 contractsfrom 2002 to 2004
$105,404 with Navy for Medical and Health Studies. Signed on 2004-10-01. Completion date: 2005-09-30.
$89,960 with Navy for Biomedical -- Basic Research (R&D). Signed on 2002-02-26. Completion date: 2002-03-01.
$31,136 with Navy for Biomedical -- Engineering Development (R&D). Signed on 2003-03-11. Completion date: 2003-07-15.
$20,628, same as above.Signed on 2004-07-14. Completion date: 2004-09-30.
Top industries in this zip code by the number of employees in 2005:
Other Services (except Public Administration): Other Similar Organizations (except Business, Professional, Labor, and Political Organizations) (20-49: 3, 10-19: 7, 5-9: 1, 1-4: 2)
Health Care and Social Assistance: Offices of Physicians (except Mental Health Specialists) (20-49: 1, 10-19: 3, 5-9: 4, 1-4: 25)
Accommodation and Food Services: Snack and Nonalcoholic Beverage Bars (20-49: 3, 10-19: 1, 5-9: 1, 1-4: 4)
Real Estate and Rental and Leasing: Offices of Real Estate Agents and Brokers (10-19: 1, 5-9: 5, 1-4: 24)
People in group quarters in 2010:
5,785 people in military ships
518 people in military barracks and dormitories (nondisciplinary)
115 people in nursing facilities/skilled-nursing facilities
61 people in maritime/merchant vessels
3 people in other noninstitutional facilities
People in group quarters in 2000:
3,029 people in military ships
2,892 people in military barracks, etc.
359 people in nursing homes
133 people in military transient quarters for temporary residents
97 people in military disciplinary barracks
28 people in crews of maritime vessels
2 people in religious group quarters
Fatal accident statistics in 2011:
Fatal accident count: 2
Vehicles involved in fatal accidents: 8
Fatal accidents caused by drunken drivers: 0
Fatalities: 3
Persons involved in fatal accidents: 7
Pedestrians involved in fatal accidents: 0
Fatal accident statistics in 2010:
Fatal accident count: 2
Vehicles involved in fatal accidents: 4
Fatal accidents caused by drunken drivers: 1
Fatalities: 2
Persons involved in fatal accidents: 7
Pedestrians involved in fatal accidents: 0
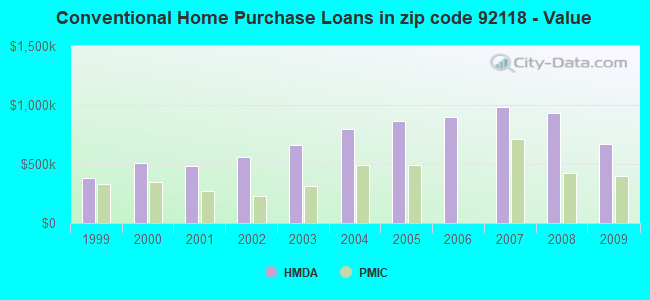
Home Mortgage Disclosure Act Aggregated Statistics For Year 2009 (Based on 7 full and 10 partial tracts)
A) FHA, FSA/RHS & VA Home Purchase Loans
B) Conventional Home Purchase Loans
C) Refinancings
D) Home Improvement Loans
F) Non-occupant Loans on < 5 Family Dwellings (A B C & D)
G) Loans On Manufactured Home Dwelling (A B C & D)
Number
Average Value
Number
Average Value
Number
Average Value
Number
Average Value
Number
Average Value
Number
Average Value
LOANS ORIGINATED
9
$742,747
133
$672,041
825
$522,168
23
$552,223
219
$613,563
0
$0
APPLICATIONS APPROVED, NOT ACCEPTED
3
$774,723
11
$865,722
58
$549,068
0
$0
9
$841,429
0
$0
APPLICATIONS DENIED
3
$285,680
41
$731,921
232
$627,428
9
$698,081
74
$494,119
2
$48,620
APPLICATIONS WITHDRAWN
2
$277,115
21
$625,654
176
$559,421
3
$1,430,990
42
$513,090
2
$24,450
FILES CLOSED FOR INCOMPLETENESS
0
$0
9
$543,850
32
$562,572
2
$116,085
8
$469,008
0
$0
Aggregated Statistics For Year 2008 (Based on 9 full and 10 partial tracts)
A) FHA, FSA/RHS & VA Home Purchase Loans
B) Conventional Home Purchase Loans
C) Refinancings
D) Home Improvement Loans
E) Loans on Dwellings For 5+ Families
F) Non-occupant Loans on < 5 Family Dwellings (A B C & D)
G) Loans On Manufactured Home Dwelling (A B C & D)
Number
Average Value
Number
Average Value
Number
Average Value
Number
Average Value
Number
Average Value
Number
Average Value
Number
Average Value
LOANS ORIGINATED
2
$984,590
151
$931,246
335
$803,790
33
$793,376
4
$449,750
168
$892,718
2
$67,920
APPLICATIONS APPROVED, NOT ACCEPTED
0
$0
31
$660,845
68
$593,588
4
$792,400
0
$0
26
$507,410
2
$60,675
APPLICATIONS DENIED
0
$0
40
$912,382
115
$947,193
9
$392,858
0
$0
57
$792,908
0
$0
APPLICATIONS WITHDRAWN
3
$307,097
46
$1,049,884
107
$718,206
12
$1,034,611
0
$0
27
$1,073,363
0
$0
FILES CLOSED FOR INCOMPLETENESS
0
$0
14
$1,338,825
18
$1,214,916
0
$0
2
$226,400
11
$1,068,035
0
$0
Aggregated Statistics For Year 2007 (Based on 9 full and 10 partial tracts)
B) Conventional Home Purchase Loans
C) Refinancings
D) Home Improvement Loans
E) Loans on Dwellings For 5+ Families
F) Non-occupant Loans on < 5 Family Dwellings (A B C & D)
G) Loans On Manufactured Home Dwelling (A B C & D)
Number
Average Value
Number
Average Value
Number
Average Value
Number
Average Value
Number
Average Value
Number
Average Value
LOANS ORIGINATED
391
$983,130
547
$794,785
56
$915,708
7
$987,657
346
$934,083
2
$45,800
APPLICATIONS APPROVED, NOT ACCEPTED
54
$802,725
96
$844,348
16
$493,159
0
$0
43
$770,430
0
$0
APPLICATIONS DENIED
91
$1,204,228
157
$992,651
17
$171,140
0
$0
71
$947,214
0
$0
APPLICATIONS WITHDRAWN
56
$645,823
92
$768,720
2
$1,608,020
0
$0
49
$724,270
0
$0
FILES CLOSED FOR INCOMPLETENESS
8
$1,036,269
26
$1,056,991
0
$0
0
$0
6
$754,040
0
$0
Aggregated Statistics For Year 2006 (Based on 9 full and 10 partial tracts)
B) Conventional Home Purchase Loans
C) Refinancings
D) Home Improvement Loans
E) Loans on Dwellings For 5+ Families
F) Non-occupant Loans on < 5 Family Dwellings (A B C & D)
Number
Average Value
Number
Average Value
Number
Average Value
Number
Average Value
Number
Average Value
LOANS ORIGINATED
328
$899,709
521
$717,157
76
$629,247
6
$1,147,712
251
$782,097
APPLICATIONS APPROVED, NOT ACCEPTED
53
$801,143
83
$685,930
5
$1,046,282
2
$181,120
31
$1,003,618
APPLICATIONS DENIED
68
$835,239
137
$801,337
30
$619,384
0
$0
34
$884,451
APPLICATIONS WITHDRAWN
52
$746,398
113
$668,110
11
$421,124
0
$0
38
$606,426
FILES CLOSED FOR INCOMPLETENESS
5
$702,226
17
$750,222
4
$178,580
0
$0
2
$322,900
Aggregated Statistics For Year 2005 (Based on 9 full and 10 partial tracts)
B) Conventional Home Purchase Loans
C) Refinancings
D) Home Improvement Loans
E) Loans on Dwellings For 5+ Families
F) Non-occupant Loans on < 5 Family Dwellings (A B C & D)
G) Loans On Manufactured Home Dwelling (A B C & D)
Number
Average Value
Number
Average Value
Number
Average Value
Number
Average Value
Number
Average Value
Number
Average Value
LOANS ORIGINATED
372
$863,095
714
$708,474
83
$601,380
11
$895,045
300
$682,497
0
$0
APPLICATIONS APPROVED, NOT ACCEPTED
93
$718,311
139
$575,541
15
$254,795
0
$0
65
$579,638
2
$39,955
APPLICATIONS DENIED
69
$777,324
167
$715,044
35
$376,057
0
$0
53
$671,528
0
$0
APPLICATIONS WITHDRAWN
88
$811,035
127
$546,389
14
$886,780
0
$0
50
$819,326
0
$0
FILES CLOSED FOR INCOMPLETENESS
17
$652,145
52
$670,663
0
$0
0
$0
7
$908,463
0
$0
Aggregated Statistics For Year 2004 (Based on 9 full and 10 partial tracts)
A) FHA, FSA/RHS & VA Home Purchase Loans
B) Conventional Home Purchase Loans
C) Refinancings
D) Home Improvement Loans
E) Loans on Dwellings For 5+ Families
F) Non-occupant Loans on < 5 Family Dwellings (A B C & D)
G) Loans On Manufactured Home Dwelling (A B C & D)
Number
Average Value
Number
Average Value
Number
Average Value
Number
Average Value
Number
Average Value
Number
Average Value
Number
Average Value
LOANS ORIGINATED
0
$0
443
$796,634
953
$589,544
39
$423,942
6
$595,857
259
$671,570
4
$91,165
APPLICATIONS APPROVED, NOT ACCEPTED
0
$0
69
$578,634
93
$669,563
9
$348,246
0
$0
26
$492,842
0
$0
APPLICATIONS DENIED
2
$212,015
86
$902,587
156
$597,441
13
$805,982
0
$0
34
$627,760
0
$0
APPLICATIONS WITHDRAWN
0
$0
61
$833,531
148
$478,282
10
$224,984
2
$407,520
45
$850,345
0
$0
FILES CLOSED FOR INCOMPLETENESS
0
$0
23
$570,493
49
$446,950
3
$363,780
0
$0
17
$547,275
0
$0
Aggregated Statistics For Year 2003 (Based on 9 full and 10 partial tracts)
B) Conventional Home Purchase Loans
C) Refinancings
D) Home Improvement Loans
E) Loans on Dwellings For 5+ Families
F) Non-occupant Loans on < 5 Family Dwellings (A B C & D)
Number
Average Value
Number
Average Value
Number
Average Value
Number
Average Value
Number
Average Value
LOANS ORIGINATED
363
$664,630
2,260
$413,418
13
$104,045
11
$905,449
507
$422,551
APPLICATIONS APPROVED, NOT ACCEPTED
41
$622,582
230
$381,966
0
$0
0
$0
38
$443,619
APPLICATIONS DENIED
37
$646,448
284
$458,963
10
$50,188
3
$1,488,893
71
$421,690
APPLICATIONS WITHDRAWN
44
$448,765
273
$351,343
2
$77,960
0
$0
45
$364,138
FILES CLOSED FOR INCOMPLETENESS
4
$560,640
50
$472,617
0
$0
0
$0
13
$387,015
Aggregated Statistics For Year 2002 (Based on 9 full and 10 partial tracts)
A) FHA, FSA/RHS & VA Home Purchase Loans
B) Conventional Home Purchase Loans
C) Refinancings
D) Home Improvement Loans
E) Loans on Dwellings For 5+ Families
F) Non-occupant Loans on < 5 Family Dwellings (A B C & D)
Number
Average Value
Number
Average Value
Number
Average Value
Number
Average Value
Number
Average Value
Number
Average Value
LOANS ORIGINATED
3
$88,053
411
$560,779
1,705
$423,141
21
$130,871
6
$430,405
402
$418,226
APPLICATIONS APPROVED, NOT ACCEPTED
2
$187,675
54
$621,459
225
$422,303
2
$47,745
0
$0
44
$350,425
APPLICATIONS DENIED
0
$0
49
$591,015
219
$605,452
12
$81,159
0
$0
50
$468,700
APPLICATIONS WITHDRAWN
0
$0
70
$492,895
191
$417,893
11
$85,794
0
$0
39
$363,974
FILES CLOSED FOR INCOMPLETENESS
0
$0
13
$419,116
58
$375,539
2
$46,435
0
$0
12
$363,652
Aggregated Statistics For Year 2001 (Based on 9 full and 10 partial tracts)
A) FHA, FSA/RHS & VA Home Purchase Loans
B) Conventional Home Purchase Loans
C) Refinancings
D) Home Improvement Loans
E) Loans on Dwellings For 5+ Families
F) Non-occupant Loans on < 5 Family Dwellings (A B C & D)
Number
Average Value
Number
Average Value
Number
Average Value
Number
Average Value
Number
Average Value
Number
Average Value
LOANS ORIGINATED
2
$108,670
293
$481,310
1,086
$384,206
49
$58,718
5
$582,988
270
$386,265
APPLICATIONS APPROVED, NOT ACCEPTED
0
$0
39
$454,616
156
$344,353
5
$257,358
0
$0
25
$463,667
APPLICATIONS DENIED
2
$65,150
67
$595,608
232
$413,524
13
$177,468
0
$0
55
$426,558
APPLICATIONS WITHDRAWN
0
$0
21
$434,865
149
$338,269
9
$31,788
2
$1,364,300
20
$257,556
FILES CLOSED FOR INCOMPLETENESS
0
$0
14
$601,509
45
$394,279
3
$91,213
2
$520,720
11
$364,935
Aggregated Statistics For Year 2000 (Based on 9 full and 10 partial tracts)
A) FHA, FSA/RHS & VA Home Purchase Loans
B) Conventional Home Purchase Loans
C) Refinancings
D) Home Improvement Loans
E) Loans on Dwellings For 5+ Families
F) Non-occupant Loans on < 5 Family Dwellings (A B C & D)
Number
Average Value
Number
Average Value
Number
Average Value
Number
Average Value
Number
Average Value
Number
Average Value
LOANS ORIGINATED
2
$92,370
389
$508,667
278
$308,568
61
$65,488
5
$342,726
129
$436,017
APPLICATIONS APPROVED, NOT ACCEPTED
0
$0
57
$518,967
44
$340,559
9
$121,710
0
$0
21
$435,771
APPLICATIONS DENIED
0
$0
92
$526,513
78
$333,537
7
$44,094
0
$0
35
$398,996
APPLICATIONS WITHDRAWN
2
$150,345
37
$489,820
69
$236,577
7
$62,281
3
$100,950
18
$593,519
FILES CLOSED FOR INCOMPLETENESS
0
$0
21
$617,950
30
$265,082
2
$141,625
0
$0
4
$257,940
Aggregated Statistics For Year 1999 (Based on 4 full and 7 partial tracts)
A) FHA, FSA/RHS & VA Home Purchase Loans
B) Conventional Home Purchase Loans
C) Refinancings
D) Home Improvement Loans
E) Loans on Dwellings For 5+ Families
F) Non-occupant Loans on < 5 Family Dwellings (A B C & D)
2005 - 2018 National Fire Incident Reporting System (NFIRS) incidents
According to the data from the years 2005 - 2018 the average number of fires per year is 19. The highest number of fire incidents - 65 took place in 2007, and the least - 3 in 2009. The data has a decreasing trend.
When looking into fire subcategories, the most incidents belonged to: Structure Fires (53.0%), and Other (20.4%).
Fire incident types reported to NFIRS in Zip Code 92118

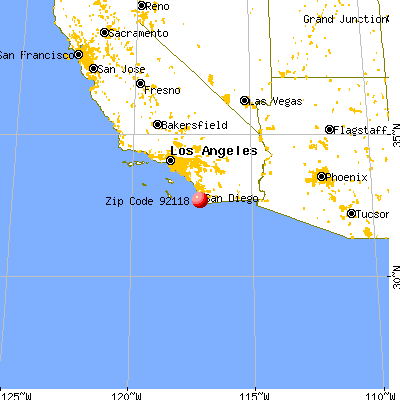


 Nearest zip codes: 92135, 92147, 92106, 92132, 92140, 92101.
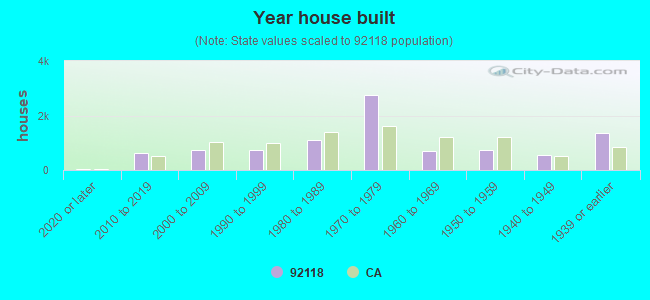


 According to the data from the years 2005 - 2018 the average number of fires per year is 19. The highest number of fire incidents - 65 took place in 2007, and the least - 3 in 2009. The data has a decreasing trend.
 When looking into fire subcategories, the most incidents belonged to: Structure Fires (53.0%), and Other (20.4%).