Estimated zip code population in 2022: 885 Zip code population in 2010: 923 Zip code population in 2000: 634
Houses and condos: 611 Renter-occupied apartments: 201
% of renters here:
37%
State:
29%
March 2022 cost of living index in zip code 87540: 93.9 (less than average, U.S. average is 100)
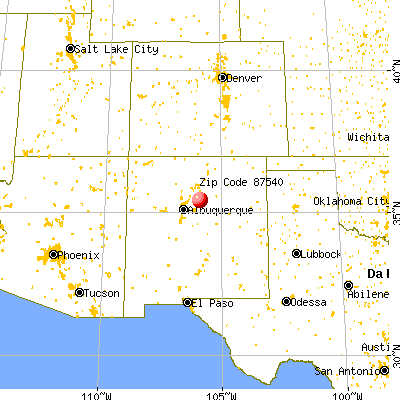
Land area: 84.9 sq. mi. Water area: 0.0 sq. mi.
Population density: 10 people per square mile
(very low).
OSM Map
General Map
Google Map
MSN Map
OSM Map
General Map
Google Map
MSN Map
OSM Map
General Map
Google Map
MSN Map
OSM Map
General Map
Google Map
MSN Map
Please wait while loading the map...
Real estate property taxes paid for housing units in 2022:
This zip code:
0.5% ($3,305)
New Mexico:
0.7% ($1,638)
Median real estate property taxes paid for housing units with mortgages in 2022: $2,618 (0.4%) Median real estate property taxes paid for housing units with no mortgage in 2022: $4,229 (0.6%)
Business Search- 14 Million verified businesses
Males: 503
(56.9%)
Females: 381
(43.1%)
For population 25 years and over in 87540:
High school or higher: 99.8%
Bachelor's degree or higher: 65.3%
Graduate or professional degree: 37.0%
Unemployed: 2.1%
Mean travel time to work (commute): 24.6 minutes
For population 15 years and over in 87540:
Never married: 11.1%
Now married: 56.6%
Separated: 0.0%
Widowed: 19.2%
Divorced: 13.1%
Zip code 87540 compared to state average:
Median house value significantly above state average.
Unemployed percentage below state average.
Black race population percentage significantly below state average.
Hispanic race population percentage significantly below state average.
Median age significantly above state average.
Foreign-born population percentage below state average.
Length of stay since moving in significantly below state average.
House age below state average.
Percentage of population with a bachelor's degree or higher significantly above state average.
Estimated median house/condo value in 2022: $704,315
87540:
$704,315
New Mexico:
$243,100
Median resident age:
This zip code:
61.9 years
New Mexico median age:
39.4 years
Average household size:
This zip code:
1.6 people
New Mexico:
2.4 people
Averages for the 2020 tax year for zip code 87540, filed in 2021:
Average Adjusted Gross Income (AGI) in 2020: $110,728 (Individual Income Tax Returns)
Here:
$110,728
State:
$59,146
Salary/wage: $78,975 (reported on 52.8% of returns)
Here:
$78,975
State:
$48,327
(% of AGI for various income ranges: 905.0% for AGIs below $25k, 2866.7% for AGIs $25k-50k, 4877.5% for AGIs $50k-75k, 4476.7% for AGIs $75k-100k, 12515.0% for AGIs $100k-200k, 57750.0% for AGIs over 200k)
Taxable interest for individuals: $2,277 (reported on 58.5% of returns)
This zip code:
$2,277
New Mexico:
$1,616
(% of AGI for various income ranges: 33.3% for AGIs below $25k, 150.0% for AGIs $25k-50k, 135.0% for AGIs $50k-75k, 283.3% for AGIs $75k-100k, 705.0% for AGIs $100k-200k, 875.0% for AGIs over 200k)
Ordinary dividends: $14,128 (reported on 47.2% of returns)
Here:
$14,128
State:
$7,816
(% of AGI for various income ranges: 216.7% for AGIs below $25k, 318.3% for AGIs $25k-50k, 495.0% for AGIs $50k-75k, 1056.7% for AGIs $75k-100k, 2265.0% for AGIs $100k-200k, 8950.0% for AGIs over 200k)
Net capital gain/loss in AGI: +$40,448 (reported on 47.2% of returns)
Here:
+$40,448
State:
+$19,595
(% of AGI for various income ranges: 83.3% for AGIs below $25k, 203.3% for AGIs $25k-50k, 932.5% for AGIs $50k-75k, 4095.0% for AGIs $100k-200k, 39645.0% for AGIs over 200k)
Profit/loss from business: +$23,124 (reported on 32.1% of returns)
Here:
+$23,124
State:
+$11,430
(% of AGI for various income ranges: 363.3% for AGIs below $25k, 823.3% for AGIs $25k-50k, 2332.5% for AGIs $50k-75k, 2920.0% for AGIs $100k-200k, 5590.0% for AGIs over 200k)
Taxable individual retirement arrangement distribution: $32,400 (reported on 20.8% of returns)
87540:
$32,400
New Mexico:
$20,970
(% of AGI for various income ranges: 486.7% for AGIs below $25k, 1067.5% for AGIs $50k-75k, 4252.5% for AGIs $100k-200k, 5720.0% for AGIs over 200k)
Total itemized deductions: $34,567 (reported on 22.6% of returns)
Here:
$34,567
State:
$33,187
(% of AGI for various income ranges: 2392.5% for AGIs $50k-75k, 2380.0% for AGIs $100k-200k, 11195.0% for AGIs over 200k)
Charity contributions: $16,611 (reported on 17.0% of returns)
Here:
$16,611
State:
$11,850
(% of AGI for various income ranges: 115.0% for AGIs $25k-50k, 432.5% for AGIs $100k-200k, 6265.0% for AGIs over 200k)
Taxes paid: $7,658 (reported on 22.6% of returns)
87540:
$7,658
State:
$7,150
(% of AGI for various income ranges: 590.0% for AGIs $50k-75k, 787.5% for AGIs $100k-200k, 1840.0% for AGIs over 200k)
Earned income credit: $1,560 (reported on 9.4% of returns)
Here:
$1,560
State:
$2,323
(% of AGI for various income ranges: 130.0% for AGIs below $25k)
Percentage of individuals using paid preparers for their 2020 taxes: 94.3%
Here:
94%
State:
92%
(% for various income ranges: 92.3% for AGIs below $25k, 90.0% for AGIs $25k-50k, 85.7% for AGIs $50k-75k, 100.0% for AGIs $75k-100k, 100.0% for AGIs $100k-200k, 100.0% for AGIs over 200k)
Averages for the 2012 tax year for zip code 87540, filed in 2013:
Average Adjusted Gross Income (AGI) in 2012: $91,668 (Individual Income Tax Returns)
Here:
$91,668
State:
$50,343
Salary/wage: $71,257 (reported on 63.6% of returns)
Here:
$71,257
State:
$41,171
(% of AGI for various income ranges: 52.6% for AGIs below $25k, 57.1% for AGIs $25k-50k, 43.9% for AGIs $50k-75k, 49.7% for AGIs $75k-100k, 51.9% for AGIs $100k-200k, 47.8% for AGIs over 200k)
Taxable interest for individuals: $1,908 (reported on 54.5% of returns)
This zip code:
$1,908
New Mexico:
$1,677
(% of AGI for various income ranges: 1.3% for AGIs below $25k, 1.0% for AGIs $25k-50k, 0.3% for AGIs $50k-75k, 0.8% for AGIs $75k-100k, 0.8% for AGIs $100k-200k, 1.6% for AGIs over 200k)
Ordinary dividends: $13,411 (reported on 40.9% of returns)
Here:
$13,411
State:
$6,939
(% of AGI for various income ranges: 9.0% for AGIs below $25k, 7.0% for AGIs $25k-50k, 14.6% for AGIs $50k-75k, 4.1% for AGIs $100k-200k, 5.7% for AGIs over 200k)
Net capital gain/loss in AGI: +$8,771 (reported on 38.6% of returns)
Here:
+$8,771
State:
+$14,311
(% of AGI for various income ranges: 0.7% for AGIs $50k-75k, 2.8% for AGIs $100k-200k, 6.5% for AGIs over 200k)
Profit/loss from business: +$17,567 (reported on 34.1% of returns)
Here:
+$17,567
State:
+$11,059
(% of AGI for various income ranges: 20.1% for AGIs below $25k, 7.7% for AGIs $25k-50k, 17.6% for AGIs $50k-75k, 13.9% for AGIs $100k-200k)
Taxable individual retirement arrangement distribution: $27,657 (reported on 15.9% of returns)
87540:
$27,657
New Mexico:
$15,706
(% of AGI for various income ranges: 13.9% for AGIs below $25k, 8.9% for AGIs $50k-75k, 13.6% for AGIs $100k-200k)
Total itemized deductions: $29,730 (20% of AGI, reported on 52.3% of returns)
Here:
$29,730
State:
$21,709
Here:
20.5% of AGI
State:
19.8% of AGI
(% of AGI for various income ranges: 31.9% for AGIs below $25k, 18.0% for AGIs $25k-50k, 22.4% for AGIs $50k-75k, 19.2% for AGIs $75k-100k, 19.6% for AGIs $100k-200k, 12.6% for AGIs over 200k)
Charity contributions: $3,818 (reported on 38.6% of returns)
Here:
$3,818
State:
$4,195
(% of AGI for various income ranges: 1.6% for AGIs $25k-50k, 2.4% for AGIs $50k-75k, 2.2% for AGIs $75k-100k, 2.5% for AGIs $100k-200k, 1.1% for AGIs over 200k)
Taxes paid: $9,504 (reported on 52.3% of returns)
87540:
$9,504
State:
$6,176
(% of AGI for various income ranges: 4.9% for AGIs below $25k, 4.4% for AGIs $25k-50k, 5.3% for AGIs $50k-75k, 4.7% for AGIs $75k-100k, 6.0% for AGIs $100k-200k, 5.5% for AGIs over 200k)
Earned income credit: $1,420 (reported on 11.4% of returns)
Here:
$1,420
State:
$2,311
(% of AGI for various income ranges: 4.3% for AGIs below $25k)
Percentage of individuals using paid preparers for their 2012 taxes: 61.4%
Here:
61%
State:
50%
(% for various income ranges: 57.1% for AGIs below $25k, 50.0% for AGIs $25k-50k, 57.1% for AGIs $50k-75k, 75.0% for AGIs $75k-100k, 71.4% for AGIs $100k-200k, 75.0% for AGIs over 200k)
Averages for the 2004 tax year for zip code 87540, filed in 2005:
Average Adjusted Gross Income (AGI) in 2004: $68,137 (Individual Income Tax Returns)
Here:
$68,137
State:
$39,572
Salary/wage: $47,858 (reported on 63.7% of returns)
Here:
$47,858
State:
$34,237
(% of AGI for various income ranges: 57.1% for AGIs $10k-25k, 71.6% for AGIs $25k-50k, 54.4% for AGIs $50k-75k, 52.3% for AGIs $75k-100k, 34.5% for AGIs over 100k)
Taxable interest for individuals: $2,367 (reported on 58.2% of returns)
This zip code:
$2,367
New Mexico:
$1,873
(% of AGI for various income ranges: 1.0% for AGIs $10k-25k, 0.8% for AGIs $25k-50k, 5.1% for AGIs $50k-75k, 1.9% for AGIs $75k-100k, 1.6% for AGIs over 100k)
Taxable dividends: $6,910 (reported on 42.1% of returns)
Here:
$6,910
State:
$3,554
(% of AGI for various income ranges: 5.6% for AGIs $10k-25k, 1.1% for AGIs $25k-50k, 8.9% for AGIs $50k-75k, 4.5% for AGIs $75k-100k, 3.4% for AGIs over 100k)
Net capital gain/loss: +$18,474 (reported on 40.1% of returns)
Here:
+$18,474
State:
+$10,425
(% of AGI for various income ranges: -0.2% for AGIs $10k-25k, 0.4% for AGIs $25k-50k, 2.1% for AGIs $50k-75k, 14.5% for AGIs $75k-100k, 14.3% for AGIs over 100k)
Profit/loss from business: +$13,484 (reported on 36.3% of returns)
Here:
+$13,484
State:
+$8,875
(% of AGI for various income ranges: 18.1% for AGIs $10k-25k, 20.4% for AGIs $25k-50k, 3.7% for AGIs $50k-75k, 5.5% for AGIs over 100k)
IRA payment deduction: $3,900 (reported on 2.9% of returns)
87540:
$3,900
New Mexico:
$2,940
Total itemized deductions: $25,982 (22% of AGI, reported on 47.7% of returns)
Here:
$25,982
State:
$18,103
Here:
21.6% of AGI
State:
21.5% of AGI
(% of AGI for various income ranges: 25.2% for AGIs $10k-25k, 17.4% for AGIs $25k-50k, 27.8% for AGIs $50k-75k, 22.9% for AGIs $75k-100k, 14.7% for AGIs over 100k)
Charity contributions deductions: $3,200 (3% of AGI, reported on 38.0% of returns)
Here:
$3,200
State:
$3,246
Here:
2.5% of AGI
State:
3.6% of AGI
(% of AGI for various income ranges: 1.0% for AGIs $10k-25k, 1.0% for AGIs $25k-50k, 2.2% for AGIs $50k-75k, 1.8% for AGIs $75k-100k, 1.9% for AGIs over 100k)
Total tax: $13,460 (reported on 80.7% of returns)
87540:
$13,460
State:
$6,237
(% of AGI for various income ranges: 6.4% for AGIs $10k-25k, 8.6% for AGIs $25k-50k, 8.9% for AGIs $50k-75k, 9.2% for AGIs $75k-100k, 20.2% for AGIs over 100k)
Earned income credit: $1,333 (reported on 12.3% of returns)
Here:
$1,333
State:
$1,796
Percentage of individuals using paid preparers for their 2004 taxes: 69.6%
Here:
70%
State:
57%
(% for various income ranges: 60.0% for AGIs below $10k, 65.3% for AGIs $10k-25k, 69.1% for AGIs $25k-50k, 67.4% for AGIs $50k-75k, 73.3% for AGIs $75k-100k, 87.5% for AGIs over 100k)
Household received Food Stamps/SNAP in the past 12 months: 11 Household did not receive Food Stamps/SNAP in the past 12 months: 536
Women who did not have a birth in the past 12 months: 153 (54 now married, 99 unmarried)
Housing units in zip code 87540 with a mortgage: 195 (27 second mortgage, 26 both second mortgage and home equity loan) Median monthly owner costs for units with a mortgage: $2,214 Median monthly owner costs for units without a mortgage: $772
Residents with income below the poverty level in 2022:
This zip code:
3.8%
Whole state:
17.6%
Residents with income below 50% of the poverty level in 2022:
This zip code:
1.7%
Whole state:
9.7%
Median number of rooms in houses and condos:
Here:
5.6
State:
5.9
Median number of rooms in apartments:
Here:
4.7
State:
4.2
Notable locations in this zip code not listed on our city pages
Notable locations in zip code 87540: Los Angeles Windmill (A), Piedra Lumbre Windmill (B), Middle Well (C), North Well (D), Pueblo los Tanos Ruins (E), Pueblo Well (F), Pump Jack Well (G), Rock House Well (H), School House Windmill (I), Spring Well (J), Thornton Ranch (K), Elsie Windmill (L), Elsie Well (M), Pueblo Largo (N), Pueblo of She (O), Ranchitos De Galisteo (P), San Cristobal Ranch (Q), Galisteo Historic District (R), Pueblo Colorado North Historic Site (S), Bar S Ranch (T). Display/hide their locations on the map
Parks in zip code 87540 include: Southern Rockies Historical Marker (1), Galisteo Pueblo Historical Marker (2), Galisteo Basin Historical Marker (3). Display/hide their locations on the map
In group quarters: 1 (-1 institutionalized population)
Size of family households: 240 2-persons, 43 3-persons, 7 4-persons
Size of nonfamily households: 260 1-person, 12 2-persons
11 married couples with children.
50 single-parent households (50 women).
99.3% of residents of 87540 zip code speak English at home.
1.5% of residents speak Spanish at home (100% very well).
2.7% of residents speak Asian or Pacific Island language at home (100% very well).
Foreign born population: 35 (4.1%) (100.0% of them are naturalized citizens)
This zip code:
4.1%
Whole state:
9.3%
58%Bhutan
57%English
13%American
9%European
5%Irish
4%Scottish
4%Norwegian
2%British
Year of entry for the foreign-born population
02010 or later
02000 to 2009
141990 to 1999
26Before 1990
57.7%Bottled, tank, or LP gas
17.5%Utility gas
11.1%Solar energy
8.1%Electricity
3.2%Wood
2.8%Other fuel
Population in 1990: 516. Population change in the 1990s: +118 (+22.9%).
Place of birth for U.S.-born residents:
This state: 330
Northeast: 131
Midwest: 121
South: 118
West: 143
51% of the 87540 zip code residents lived in the same house 5 years ago. Out of people who lived in different houses, 23% lived in this county. Out of people who lived in different counties, 50% lived in New Mexico.
93% of the 87540 zip code residents lived in the same house 1 year ago. Out of people who lived in different houses, 119% moved from different state.
Private vs. public school enrollment:
Students in private schools in grades 1 to 8 (elementary and middle school):
Here:
0.0%
New Mexico:
10.2%
Students in private schools in grades 9 to 12 (high school):
Here:
0.0%
New Mexico:
10.0%
Students in private undergraduate colleges:
Here:
0.0%
New Mexico:
12.3%
Occupation by median earnings in the past 12 months ($)
92,097Management occupations
65,874Education, training, and library occupations
52,061Health diagnosing and treating practitioners and other technical occupations
27,224Arts, design, entertainment, sports, and media occupations
Top industries in this zip code by the number of employees in 2005:
Health Care and Social Assistance: Other Residential Care Facilities (10-19 employees: 1 establishment)
Construction: New Single-Family Housing Construction (except Operative Builders) (5-9: 1, 1-4: 2)
Other Services (except Public Administration): Other Personal Care Services (5-9: 1)
Construction: Masonry Contractors (1-4: 2)
Professional, Scientific, and Technical Services: Administrative Management and General Management Consulting Services (1-4: 1)
Professional, Scientific, and Technical Services: Other Accounting Services (1-4: 1)
Arts, Entertainment, and Recreation: Independent Artists, Writers, and Performers (1-4: 1)
Professional, Scientific, and Technical Services: Human Resources and Executive Search Consulting Services (1-4: 1)
Professional, Scientific, and Technical Services: Advertising Agencies (1-4: 1)
Fatal accident statistics in 2012:
Fatal accident count: 1
Vehicles involved in fatal accidents: 2
Fatal accidents caused by drunken drivers: 1
Fatalities: 1
Persons involved in fatal accidents: 4
Pedestrians involved in fatal accidents: 0
Home Mortgage Disclosure Act Aggregated Statistics For Year 2009 (Based on 4 partial tracts)
A) FHA, FSA/RHS & VA Home Purchase Loans
B) Conventional Home Purchase Loans
C) Refinancings
D) Home Improvement Loans
F) Non-occupant Loans on < 5 Family Dwellings (A B C & D)
G) Loans On Manufactured Home Dwelling (A B C & D)
Number
Average Value
Number
Average Value
Number
Average Value
Number
Average Value
Number
Average Value
Number
Average Value
LOANS ORIGINATED
11
$210,015
19
$247,091
120
$251,095
5
$124,080
10
$295,372
5
$94,446
APPLICATIONS APPROVED, NOT ACCEPTED
1
$117,800
3
$232,807
16
$262,469
2
$143,500
1
$246,380
2
$77,645
APPLICATIONS DENIED
2
$175,080
2
$207,210
41
$270,288
4
$23,642
4
$241,372
5
$87,660
APPLICATIONS WITHDRAWN
1
$221,220
3
$219,140
29
$240,426
1
$48,120
2
$350,845
3
$103,837
FILES CLOSED FOR INCOMPLETENESS
0
$0
0
$0
8
$219,988
0
$0
1
$125,830
1
$61,720
Aggregated Statistics For Year 2008 (Based on 4 partial tracts)
A) FHA, FSA/RHS & VA Home Purchase Loans
B) Conventional Home Purchase Loans
C) Refinancings
D) Home Improvement Loans
F) Non-occupant Loans on < 5 Family Dwellings (A B C & D)
G) Loans On Manufactured Home Dwelling (A B C & D)
Number
Average Value
Number
Average Value
Number
Average Value
Number
Average Value
Number
Average Value
Number
Average Value
LOANS ORIGINATED
7
$199,674
31
$294,753
64
$237,071
9
$92,686
11
$344,727
6
$109,837
APPLICATIONS APPROVED, NOT ACCEPTED
0
$0
5
$298,308
9
$222,567
1
$48,310
2
$250,990
1
$128,650
APPLICATIONS DENIED
2
$118,870
6
$278,153
38
$230,379
8
$72,811
4
$165,192
9
$98,842
APPLICATIONS WITHDRAWN
1
$124,490
5
$271,322
19
$222,939
3
$113,440
1
$436,110
2
$102,655
FILES CLOSED FOR INCOMPLETENESS
1
$94,380
1
$368,320
2
$199,845
0
$0
0
$0
0
$0
Aggregated Statistics For Year 2007 (Based on 4 partial tracts)
A) FHA, FSA/RHS & VA Home Purchase Loans
B) Conventional Home Purchase Loans
C) Refinancings
D) Home Improvement Loans
F) Non-occupant Loans on < 5 Family Dwellings (A B C & D)
G) Loans On Manufactured Home Dwelling (A B C & D)
Number
Average Value
Number
Average Value
Number
Average Value
Number
Average Value
Number
Average Value
Number
Average Value
LOANS ORIGINATED
12
$209,492
74
$252,513
92
$241,024
17
$127,415
20
$269,760
10
$94,367
APPLICATIONS APPROVED, NOT ACCEPTED
2
$237,200
15
$233,510
11
$256,403
2
$81,260
4
$261,608
2
$110,705
APPLICATIONS DENIED
1
$144,180
11
$215,341
36
$233,016
11
$109,191
4
$220,372
8
$94,145
APPLICATIONS WITHDRAWN
1
$200,450
4
$259,085
21
$209,006
4
$68,525
2
$200,865
3
$91,303
FILES CLOSED FOR INCOMPLETENESS
0
$0
2
$295,945
6
$246,402
0
$0
0
$0
1
$63,690
Aggregated Statistics For Year 2006 (Based on 4 partial tracts)
A) FHA, FSA/RHS & VA Home Purchase Loans
B) Conventional Home Purchase Loans
C) Refinancings
D) Home Improvement Loans
F) Non-occupant Loans on < 5 Family Dwellings (A B C & D)
G) Loans On Manufactured Home Dwelling (A B C & D)
Number
Average Value
Number
Average Value
Number
Average Value
Number
Average Value
Number
Average Value
Number
Average Value
LOANS ORIGINATED
7
$162,039
86
$236,571
88
$232,769
16
$101,409
24
$240,616
12
$104,324
APPLICATIONS APPROVED, NOT ACCEPTED
0
$0
13
$228,932
15
$246,434
2
$77,260
2
$178,480
2
$110,405
APPLICATIONS DENIED
1
$139,420
19
$216,701
46
$218,747
11
$62,130
5
$258,608
12
$85,489
APPLICATIONS WITHDRAWN
1
$168,950
11
$226,905
28
$202,368
2
$103,785
2
$312,020
3
$89,553
FILES CLOSED FOR INCOMPLETENESS
0
$0
2
$255,600
9
$199,397
1
$225,360
1
$80,130
0
$0
Aggregated Statistics For Year 2005 (Based on 4 partial tracts)
A) FHA, FSA/RHS & VA Home Purchase Loans
B) Conventional Home Purchase Loans
C) Refinancings
D) Home Improvement Loans
F) Non-occupant Loans on < 5 Family Dwellings (A B C & D)
G) Loans On Manufactured Home Dwelling (A B C & D)
Number
Average Value
Number
Average Value
Number
Average Value
Number
Average Value
Number
Average Value
Number
Average Value
LOANS ORIGINATED
8
$126,555
94
$231,681
105
$241,352
13
$92,765
20
$261,051
8
$94,446
APPLICATIONS APPROVED, NOT ACCEPTED
1
$111,400
12
$205,924
11
$208,724
1
$101,650
2
$265,205
3
$76,157
APPLICATIONS DENIED
1
$62,300
12
$165,459
48
$181,133
8
$74,731
3
$129,243
12
$85,864
APPLICATIONS WITHDRAWN
1
$62,650
11
$188,019
31
$182,760
6
$184,788
3
$192,037
6
$103,483
FILES CLOSED FOR INCOMPLETENESS
0
$0
2
$216,755
6
$234,105
1
$25,710
0
$0
0
$0
Aggregated Statistics For Year 2004 (Based on 4 partial tracts)
A) FHA, FSA/RHS & VA Home Purchase Loans
B) Conventional Home Purchase Loans
C) Refinancings
D) Home Improvement Loans
F) Non-occupant Loans on < 5 Family Dwellings (A B C & D)
G) Loans On Manufactured Home Dwelling (A B C & D)
Number
Average Value
Number
Average Value
Number
Average Value
Number
Average Value
Number
Average Value
Number
Average Value
LOANS ORIGINATED
9
$122,403
78
$209,307
103
$211,796
13
$62,343
16
$241,518
14
$83,776
APPLICATIONS APPROVED, NOT ACCEPTED
1
$47,010
6
$245,032
14
$230,113
2
$21,685
1
$217,510
2
$70,615
APPLICATIONS DENIED
1
$161,310
14
$176,216
40
$186,182
11
$60,785
2
$183,825
11
$75,938
APPLICATIONS WITHDRAWN
1
$54,190
7
$187,746
24
$190,728
1
$64,880
2
$211,905
4
$107,028
FILES CLOSED FOR INCOMPLETENESS
0
$0
1
$219,580
5
$220,660
1
$51,540
0
$0
0
$0
Aggregated Statistics For Year 2003 (Based on 4 partial tracts)
A) FHA, FSA/RHS & VA Home Purchase Loans
B) Conventional Home Purchase Loans
C) Refinancings
D) Home Improvement Loans
F) Non-occupant Loans on < 5 Family Dwellings (A B C & D)
Number
Average Value
Number
Average Value
Number
Average Value
Number
Average Value
Number
Average Value
LOANS ORIGINATED
7
$135,037
79
$201,328
242
$198,416
7
$71,837
24
$211,957
APPLICATIONS APPROVED, NOT ACCEPTED
0
$0
8
$168,506
27
$187,830
1
$33,090
2
$190,410
APPLICATIONS DENIED
1
$86,730
11
$164,768
60
$181,018
5
$34,992
4
$95,982
APPLICATIONS WITHDRAWN
1
$92,060
6
$186,155
39
$189,545
1
$23,930
3
$125,193
FILES CLOSED FOR INCOMPLETENESS
0
$0
1
$97,590
8
$210,815
1
$46,160
1
$146,580
Aggregated Statistics For Year 2002 (Based on 2 partial tracts)
A) FHA, FSA/RHS & VA Home Purchase Loans
B) Conventional Home Purchase Loans
C) Refinancings
D) Home Improvement Loans
F) Non-occupant Loans on < 5 Family Dwellings (A B C & D)
Number
Average Value
Number
Average Value
Number
Average Value
Number
Average Value
Number
Average Value
LOANS ORIGINATED
8
$128,306
20
$125,944
54
$141,767
3
$26,247
4
$127,698
APPLICATIONS APPROVED, NOT ACCEPTED
0
$0
5
$94,492
8
$134,184
0
$0
0
$0
APPLICATIONS DENIED
1
$68,090
6
$79,110
24
$122,676
3
$20,457
1
$77,120
APPLICATIONS WITHDRAWN
0
$0
2
$152,565
13
$129,411
0
$0
1
$131,430
FILES CLOSED FOR INCOMPLETENESS
0
$0
1
$44,350
3
$83,723
0
$0
0
$0
Aggregated Statistics For Year 2001 (Based on 2 partial tracts)
A) FHA, FSA/RHS & VA Home Purchase Loans
B) Conventional Home Purchase Loans
C) Refinancings
D) Home Improvement Loans
F) Non-occupant Loans on < 5 Family Dwellings (A B C & D)
Number
Average Value
Number
Average Value
Number
Average Value
Number
Average Value
Number
Average Value
LOANS ORIGINATED
5
$120,294
18
$117,556
41
$122,751
3
$30,187
4
$134,300
APPLICATIONS APPROVED, NOT ACCEPTED
0
$0
3
$79,670
9
$123,327
0
$0
1
$120,200
APPLICATIONS DENIED
1
$84,650
6
$107,637
30
$96,461
2
$12,100
1
$132,590
APPLICATIONS WITHDRAWN
1
$108,040
3
$98,893
13
$105,645
1
$38,790
1
$133,290
FILES CLOSED FOR INCOMPLETENESS
0
$0
1
$104,680
2
$155,575
0
$0
0
$0
Aggregated Statistics For Year 2000 (Based on 2 partial tracts)
A) FHA, FSA/RHS & VA Home Purchase Loans
B) Conventional Home Purchase Loans
C) Refinancings
D) Home Improvement Loans
F) Non-occupant Loans on < 5 Family Dwellings (A B C & D)
Number
Average Value
Number
Average Value
Number
Average Value
Number
Average Value
Number
Average Value
LOANS ORIGINATED
6
$104,452
19
$112,162
19
$97,041
4
$30,080
2
$147,990
APPLICATIONS APPROVED, NOT ACCEPTED
0
$0
5
$97,296
7
$99,456
2
$31,380
0
$0
APPLICATIONS DENIED
1
$57,090
14
$89,414
23
$84,554
4
$27,010
1
$129,700
APPLICATIONS WITHDRAWN
1
$59,640
4
$151,032
7
$90,606
0
$0
0
$0
FILES CLOSED FOR INCOMPLETENESS
0
$0
1
$55,470
1
$138,270
0
$0
0
$0
Aggregated Statistics For Year 1999 (Based on 1 partial tract)
A) FHA, FSA/RHS & VA Home Purchase Loans
B) Conventional Home Purchase Loans
C) Refinancings
D) Home Improvement Loans
F) Non-occupant Loans on < 5 Family Dwellings (A B C & D)


 Nearest zip codes: 87508, 87505, 87535, 87010, 87562, 87507.


