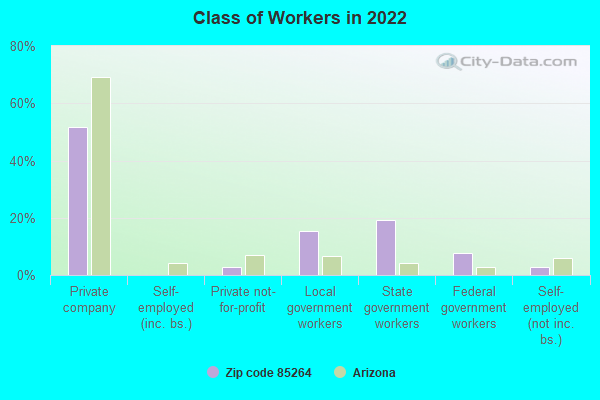
Estimated zip code population in 2022: 1,405 Zip code population in 2010: 1,249 Zip code population in 2000: 935
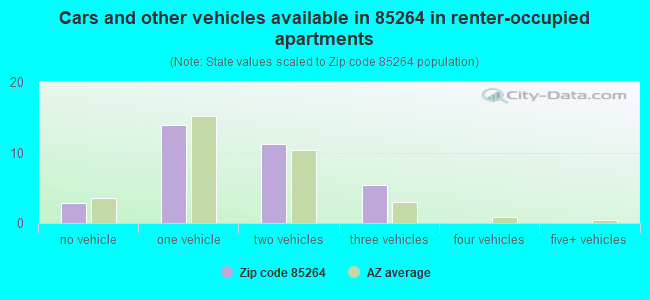
Houses and condos: 382 Renter-occupied apartments: 33
% of renters here:
9%
State:
33%
March 2022 cost of living index in zip code 85264: 94.3 (less than average, U.S. average is 100)
Land area: 213.3 sq. mi. Water area: 3.1 sq. mi.
Population density: 7 people per square mile
(very low).
OSM Map
General Map
Google Map
MSN Map
OSM Map
General Map
Google Map
MSN Map
OSM Map
General Map
Google Map
MSN Map
OSM Map
General Map
Google Map
MSN Map
Please wait while loading the map...
Real estate property taxes paid for housing units in 2022:
This zip code:
0.5% ($2,764)
Arizona:
0.4% ($1,786)
Median real estate property taxes paid for housing units with mortgages in 2022: $2,873 (0.4%) Median real estate property taxes paid for housing units with no mortgage in 2022: $2,140 (0.8%)
Estimated median house/condo value in 2022: $578,383
85264:
$578,383
Arizona:
$402,800
Median resident age:
This zip code:
34.4 years
Arizona median age:
38.8 years
Average household size:
This zip code:
3.8 people
Arizona:
2.5 people
Averages for the 2020 tax year for zip code 85264, filed in 2021:
Average Adjusted Gross Income (AGI) in 2020: $86,192 (Individual Income Tax Returns)
Here:
$86,192
State:
$73,499
Salary/wage: $50,793 (reported on 58.9% of returns)
Here:
$50,793
State:
$59,499
(% of AGI for various income ranges: 875.0% for AGIs below $25k, 1223.7% for AGIs $25k-50k, 3024.4% for AGIs $50k-75k, 4378.0% for AGIs $75k-100k, 10580.0% for AGIs $100k-200k)
Taxable interest for individuals: $493 (reported on 19.2% of returns)
This zip code:
$493
Arizona:
$2,325
(% of AGI for various income ranges: 2.5% for AGIs below $25k, 7.8% for AGIs $50k-75k, 6.0% for AGIs $75k-100k, 43.3% for AGIs $100k-200k)
Ordinary dividends: $1,743 (reported on 19.2% of returns)
Here:
$1,743
State:
$8,711
(% of AGI for various income ranges: 11.7% for AGIs below $25k, 22.2% for AGIs $50k-75k, 50.0% for AGIs $75k-100k, 131.7% for AGIs $100k-200k)
Net capital gain/loss in AGI: +$7,586 (reported on 19.2% of returns)
Here:
+$7,586
State:
+$31,332
(% of AGI for various income ranges: 14.2% for AGIs below $25k, 66.7% for AGIs $50k-75k, 238.0% for AGIs $75k-100k, 383.3% for AGIs $100k-200k)
Profit/loss from business: +$11,240 (reported on 6.8% of returns)
Here:
+$11,240
State:
+$13,214
(% of AGI for various income ranges: 197.5% for AGIs below $25k, 541.7% for AGIs $100k-200k)
Taxable individual retirement arrangement distribution: $43,475 (reported on 5.5% of returns)
85264:
$43,475
Arizona:
$23,364
(% of AGI for various income ranges: 121.1% for AGIs $25k-50k, 2515.0% for AGIs $100k-200k)
Total itemized deductions: $34,060 (reported on 6.8% of returns)
Here:
$34,060
State:
$36,308
(% of AGI for various income ranges: 1746.0% for AGIs $75k-100k)
Charity contributions: $9,433 (reported on 4.1% of returns)
Here:
$9,433
State:
$11,955
(% of AGI for various income ranges: )
Taxes paid: $7,200 (reported on 6.8% of returns)
85264:
$7,200
State:
$6,820
(% of AGI for various income ranges: 272.0% for AGIs $75k-100k)
Earned income credit: $2,200 (reported on 9.6% of returns)
Here:
$2,200
State:
$2,383
(% of AGI for various income ranges: 60.0% for AGIs below $25k, 43.2% for AGIs $25k-50k)
Percentage of individuals using paid preparers for their 2020 taxes: 97.3%
Here:
97%
State:
93%
(% for various income ranges: 93.8% for AGIs below $25k, 95.8% for AGIs $25k-50k, 100.0% for AGIs $50k-75k, 100.0% for AGIs $75k-100k, 100.0% for AGIs $100k-200k, 100.0% for AGIs over 200k)
Averages for the 2012 tax year for zip code 85264, filed in 2013:
Average Adjusted Gross Income (AGI) in 2012: $60,959 (Individual Income Tax Returns)
Here:
$60,959
State:
$57,644
Salary/wage: $45,080 (reported on 50.8% of returns)
Here:
$45,080
State:
$47,932
(% of AGI for various income ranges: 44.6% for AGIs below $25k, 12.0% for AGIs $25k-50k, 25.3% for AGIs $50k-75k, 43.3% for AGIs $75k-100k, 57.5% for AGIs $100k-200k)
Taxable interest for individuals: $491 (reported on 18.6% of returns)
This zip code:
$491
Arizona:
$2,064
(% of AGI for various income ranges: 0.3% for AGIs $100k-200k)
Ordinary dividends: $1,600 (reported on 35.6% of returns)
Here:
$1,600
State:
$7,268
(% of AGI for various income ranges: 1.5% for AGIs below $25k, 1.1% for AGIs $25k-50k, 1.3% for AGIs $50k-75k, 0.9% for AGIs $100k-200k)
Net capital gain/loss in AGI: +$1,285 (reported on 33.9% of returns)
Here:
+$1,285
State:
+$15,530
(% of AGI for various income ranges: 1.4% for AGIs $25k-50k, 0.8% for AGIs $50k-75k, 0.5% for AGIs $100k-200k)
Taxable individual retirement arrangement distribution: $21,167 (reported on 5.1% of returns)
85264:
$21,167
Arizona:
$18,280
Total itemized deductions: $32,929 (22% of AGI, reported on 11.9% of returns)
Here:
$32,929
State:
$23,651
Here:
21.6% of AGI
State:
20.6% of AGI
Charity contributions: $3,017 (reported on 10.2% of returns)
Here:
$3,017
State:
$4,114
Taxes paid: $9,733 (reported on 10.2% of returns)
85264:
$9,733
State:
$6,509
Earned income credit: $1,660 (reported on 8.5% of returns)
Here:
$1,660
State:
$2,432
(% of AGI for various income ranges: 6.0% for AGIs below $25k)
Percentage of individuals using paid preparers for their 2012 taxes: 93.2%
Here:
93%
State:
52%
(% for various income ranges: 81.8% for AGIs below $25k, 95.7% for AGIs $25k-50k, 100.0% for AGIs $50k-75k, 100.0% for AGIs $75k-100k, 87.5% for AGIs $100k-200k)
Averages for the 2004 tax year for zip code 85264, filed in 2005:
Average Adjusted Gross Income (AGI) in 2004: $63,436 (Individual Income Tax Returns)
Here:
$63,436
State:
$50,097
Salary/wage: $36,669 (reported on 61.3% of returns)
Here:
$36,669
State:
$42,146
(% of AGI for various income ranges: 40.2% for AGIs below $10k, 37.1% for AGIs $10k-25k, 11.7% for AGIs $25k-50k, 22.7% for AGIs $50k-75k, 35.2% for AGIs $75k-100k, 55.9% for AGIs over 100k)
Taxable interest for individuals: $663 (reported on 20.0% of returns)
This zip code:
$663
Arizona:
$2,374
(% of AGI for various income ranges: 1.9% for AGIs below $10k, 0.1% for AGIs $25k-50k, 0.2% for AGIs $50k-75k, 0.2% for AGIs $75k-100k, 0.3% for AGIs over 100k)
Taxable dividends: $4,000 (reported on 22.1% of returns)
Here:
$4,000
State:
$3,888
(% of AGI for various income ranges: 20.1% for AGIs $10k-25k, 1.7% for AGIs $25k-50k, 1.2% for AGIs $50k-75k, 0.2% for AGIs over 100k)
Net capital gain/loss: +$2,394 (reported on 21.9% of returns)
Here:
+$2,394
State:
+$17,569
(% of AGI for various income ranges: -7.5% for AGIs $10k-25k, -0.6% for AGIs $25k-50k, -0.2% for AGIs $50k-75k, 1.8% for AGIs $75k-100k, 2.6% for AGIs over 100k)
Total itemized deductions: $28,950 (19% of AGI, reported on 14.0% of returns)
Here:
$28,950
State:
$19,781
Here:
18.9% of AGI
State:
21.8% of AGI
(% of AGI for various income ranges: 5.8% for AGIs $50k-75k, 5.7% for AGIs $75k-100k, 11.2% for AGIs over 100k)
Charity contributions deductions: $4,460 (3% of AGI, reported on 11.7% of returns)
Here:
$4,460
State:
$3,389
Here:
2.7% of AGI
State:
3.5% of AGI
(% of AGI for various income ranges: 0.7% for AGIs $50k-75k, 0.5% for AGIs $75k-100k, 1.6% for AGIs over 100k)
Total tax: $9,603 (reported on 85.8% of returns)
85264:
$9,603
State:
$8,323
(% of AGI for various income ranges: 1.9% for AGIs below $10k, 4.8% for AGIs $10k-25k, 7.9% for AGIs $25k-50k, 10.4% for AGIs $50k-75k, 12.0% for AGIs $75k-100k, 19.1% for AGIs over 100k)
Earned income credit: $1,889 (reported on 6.3% of returns)
Here:
$1,889
State:
$1,786
Percentage of individuals using paid preparers for their 2004 taxes: 93.5%
Here:
93%
State:
60%
(% for various income ranges: 83.3% for AGIs below $10k, 92.2% for AGIs $10k-25k, 97.2% for AGIs $25k-50k, 93.4% for AGIs $50k-75k, 95.2% for AGIs $75k-100k, 93.5% for AGIs over 100k)
Household received Food Stamps/SNAP in the past 12 months: 23 Household did not receive Food Stamps/SNAP in the past 12 months: 342
Women who had a birth in the past 12 months: 6 (0 now married, 6 unmarried) Women who did not have a birth in the past 12 months: 340 (87 now married, 254 unmarried)
Housing units in zip code 85264 with a mortgage: 193 Median monthly owner costs for units with a mortgage: $2,070 Median monthly owner costs for units without a mortgage: $233
Residents with income below the poverty level in 2022:
This zip code:
15.1%
Whole state:
12.5%
Residents with income below 50% of the poverty level in 2022:
This zip code:
3.7%
Whole state:
6.0%
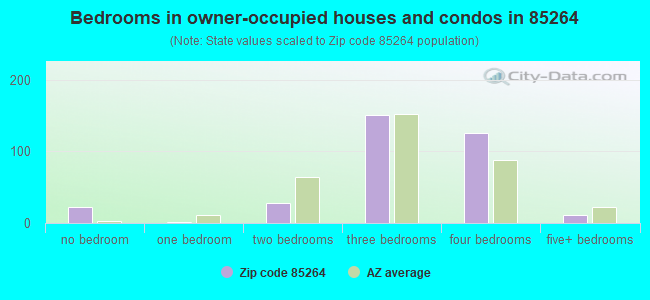
Median number of rooms in houses and condos:
Here:
5.9
State:
6.0
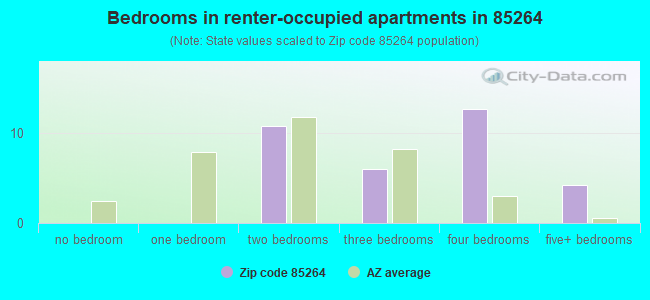
Median number of rooms in apartments:
Here:
4.8
State:
4.1
Notable locations in this zip code not listed on our city pages
Notable locations in zip code 85264: Adams Camp (A), Blue Point Recreation Site (B), Cottonwood Camp (C), Sheep Camp (D), Phoenix Filter Plant (E), The Point Recreation Site (F), Cottonwood Trailhead (G), Cane Spring Trialhead (H), Soldier Camp Trailhead (I), Goldfield Ranch (J), Fort McDowell (K), Butcher Jones Picnic Area (L), Saguaro Del Norte Picnic Area (M), Fort McDowell Yavapai Nation Tribal Library (N), Fort McDowell Indian Community - Wassaja Memorial Health Center (O). Display/hide their locations on the map
Reservoirs: Beeline Tank (A), Black Mesa Tanks (B), Brownie Tank (C), Hughes Tank (D), McDowell Tank (E), Mesquite Spring Tank (F), Flower Tank (G), Palo Fiero Tank (H). Display/hide their locations on the map
Streams, rivers, and creeks: Mesquite Wash (A), Ironwood Wash (B), Rock Creek (C), Boulder Creek (D), Alder Creek (E), Cottonwood Creek (F), Ash Creek (G), Sycamore Creek (H). Display/hide their locations on the map
Parks in zip code 85264 include: Saguaro del Norte Recreation Site (1), Camp Reno Historical Marker (2), Butcher Jones Recreation Site (3), Three Bar Wildlife Area (4). Display/hide their locations on the map
Size of family households: 72 2-persons, 97 3-persons, 27 4-persons, 43 5-persons, 22 6-persons, 21 7-or-more-persons
Size of nonfamily households: 75 1-person, 4 2-persons
95 married couples with children.
121 single-parent households (39 men, 82 women).
80.9% of residents of 85264 zip code speak English at home.
7.7% of residents speak Spanish at home (94% very well, 3% well, 3% not at all).
0.3% of residents speak other Indo-European language at home (100% very well).
0.2% of residents speak Asian or Pacific Island language at home (100% very well).
10.0% of residents speak other language at home (86% very well, 13% well, 1% not at all).
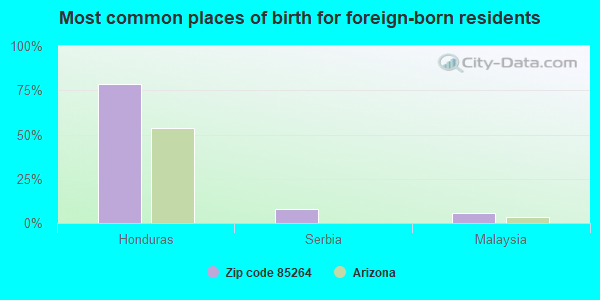
Foreign born population: 50 (3.6%) (35.9% of them are naturalized citizens)
This zip code:
3.6%
Whole state:
13.1%
78%Honduras
8%Serbia
6%Malaysia
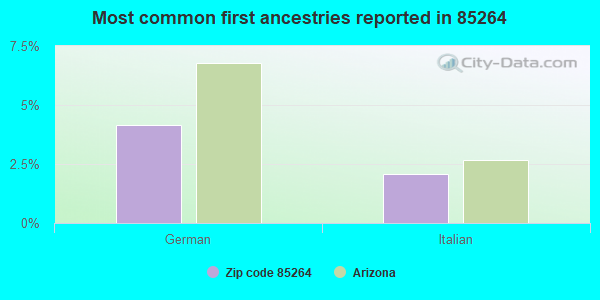
4%German
2%Italian
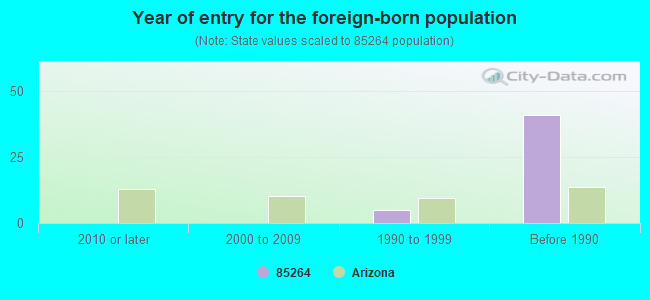
Year of entry for the foreign-born population
02010 or later
02000 to 2009
51990 to 1999
41Before 1990
Private school in in zip code 85264 not listed on the city page:
H'MAN 'SHAWA EARLY CHILDHOOD DEVELOPMENT CENTER (Students: 46, Location: 17650 E YAVAPAI RD, Grades: PK-KG)
Facilities with environmental interests located in this zip code:
VERDE WATER TREATMENT PLANT (7696 NORTH RED MOUNTAIN ROAD in SCOTTSDALE, AZ) . Tribal Land
ENFORCEMENT/COMPLIANCE ACTIVITY (Integrated Compliance Information System) - ICIS-09-1998-0115, FORMAL ENFORCEMENT ACTION (Integrated Compliance Information System) - ICIS-09-1998-0115, FORMAL ENFORCEMENT ACTION HAZARDOUS WASTE BIENNIAL REPORTER (Resource Conservation and Recovery Act (tracking hazardous waste)) Large Quantity Generators, more that 1000 kg of hazardous waste/month (Resource Conservation and Recovery Act (tracking hazardous waste)) Business SIC classification: INDUSTRIAL INSTRUMENTS FOR MEASUREMENT, DISPLAY, AND CONTROL OF PROCESS VARIABLES; AND RELATED PRODUCTS; WATER SUPPLY; BUSINESS ASSOCIATIONS Organizations: CITY OF PHOENIX (CONTACT/OPERATOR)
Alternative names: PHOENIX VERDE WTP CITY OF
FORT MCDOWELL YAVAPAI MATERIALS (13106 N HIAWATHIA HOOD RD in FORT MCDOWELL, AZ) . Tribal Land
(Resource Conservation and Recovery Act (tracking hazardous waste))
Housing units lacking complete plumbing facilities: 0.5% Housing units lacking complete kitchen facilities: 0.4%
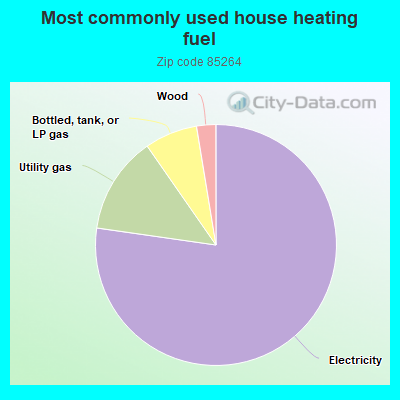
77.5%Electricity
13.1%Utility gas
7.1%Bottled, tank, or LP gas
2.6%Wood
Population in 1990: 619. Population change in the 1990s: +316 (+51.1%).
Place of birth for U.S.-born residents:
This state: 1,019
Northeast: 2
Midwest: 229
South: 40
West: 56
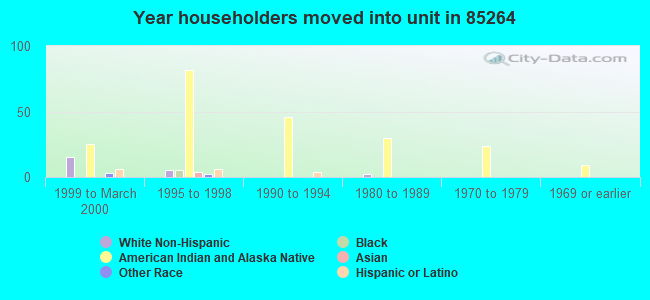
57% of the 85264 zip code residents lived in the same house 5 years ago. Out of people who lived in different houses, 75% lived in this county. Out of people who lived in different counties, 50% lived in Arizona.
93% of the 85264 zip code residents lived in the same house 1 year ago. Out of people who lived in different houses, 67% moved from this county. Out of people who lived in different houses, 21% moved from different county within same state. Out of people who lived in different houses, 18% moved from different state.
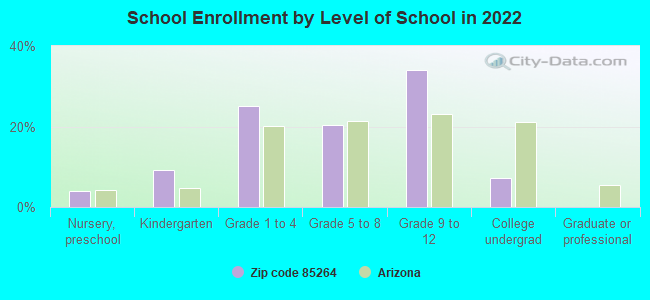
Private vs. public school enrollment:
Students in private schools in grades 1 to 8 (elementary and middle school):
Here:
0.0%
Arizona:
10.4%
Students in private schools in grades 9 to 12 (high school): 2
Here:
1.6%
Arizona:
8.8%
Students in private undergraduate colleges: 1
Here:
5.7%
Arizona:
13.1%
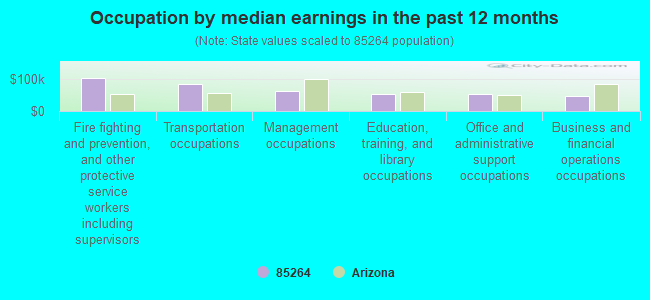
Occupation by median earnings in the past 12 months ($)
104,077Fire fighting and prevention, and other protective service workers including supervisors
84,131Transportation occupations
63,192Management occupations
53,945Education, training, and library occupations
52,289Office and administrative support occupations
46,250Business and financial operations occupations
Top industries in this zip code by the number of employees in 2005:
Arts, Entertainment, and Recreation: Other Gambling Industries (500-999 employees: 1 establishment)
Administrative and Support and Waste Management and Remediation Services: Landscaping Services (10-19: 1)
Arts, Entertainment, and Recreation: Zoos and Botanical Gardens (10-19: 1)
Construction: Framing Contractors (10-19: 1)
Finance and Insurance: Direct Title Insurance Carriers (10-19: 1)
Construction: Poured Concrete Foundation and Structure Contractors (5-9: 1)
Construction: Plumbing, Heating, and Air-Conditioning Contractors (5-9: 1)
Real Estate and Rental and Leasing: Passenger Car Rental (1-4: 1)
Fatal accident statistics in 2014:
Fatal accident count: 1
Vehicles involved in fatal accidents: 1
Fatal accidents caused by drunken drivers: 1
Fatalities: 1
Persons involved in fatal accidents: 2
Pedestrians involved in fatal accidents: 0
Fatal accident statistics in 2013:
Fatal accident count: 3
Vehicles involved in fatal accidents: 3
Fatal accidents caused by drunken drivers: 1
Fatalities: 3
Persons involved in fatal accidents: 7
Pedestrians involved in fatal accidents: 0
Home Mortgage Disclosure Act Aggregated Statistics For Year 2009 (Based on 2 full and 4 partial tracts)
A) FHA, FSA/RHS & VA Home Purchase Loans
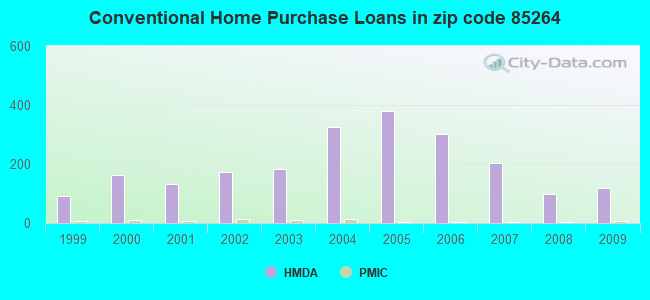
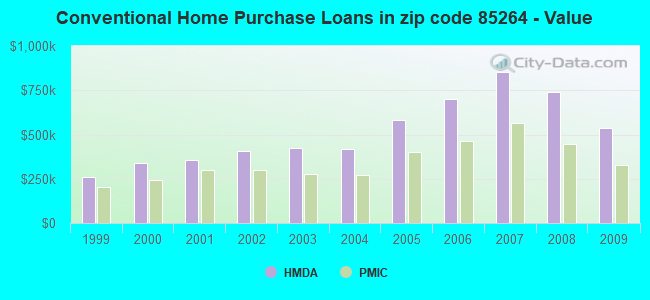
B) Conventional Home Purchase Loans
C) Refinancings
D) Home Improvement Loans
F) Non-occupant Loans on < 5 Family Dwellings (A B C & D)
G) Loans On Manufactured Home Dwelling (A B C & D)
Number
Average Value
Number
Average Value
Number
Average Value
Number
Average Value
Number
Average Value
Number
Average Value
LOANS ORIGINATED
14
$289,704
117
$534,907
242
$394,692
4
$291,252
107
$553,349
2
$88,105
APPLICATIONS APPROVED, NOT ACCEPTED
0
$0
17
$435,926
21
$359,262
1
$203,670
9
$505,267
1
$12,160
APPLICATIONS DENIED
5
$276,538
35
$590,863
98
$552,638
5
$113,742
28
$633,578
2
$69,440
APPLICATIONS WITHDRAWN
0
$0
25
$527,488
41
$504,137
2
$181,395
16
$596,505
0
$0
FILES CLOSED FOR INCOMPLETENESS
0
$0
3
$727,383
9
$452,826
0
$0
4
$368,670
0
$0
Aggregated Statistics For Year 2008 (Based on 2 full and 4 partial tracts)
A) FHA, FSA/RHS & VA Home Purchase Loans
B) Conventional Home Purchase Loans
C) Refinancings
D) Home Improvement Loans
F) Non-occupant Loans on < 5 Family Dwellings (A B C & D)
G) Loans On Manufactured Home Dwelling (A B C & D)
Number
Average Value
Number
Average Value
Number
Average Value
Number
Average Value
Number
Average Value
Number
Average Value
LOANS ORIGINATED
3
$195,617
97
$739,729
142
$652,846
5
$797,600
67
$854,126
1
$102,300
APPLICATIONS APPROVED, NOT ACCEPTED
1
$231,450
22
$649,374
24
$706,506
3
$741,097
9
$881,334
4
$62,538
APPLICATIONS DENIED
0
$0
36
$1,080,351
103
$826,420
11
$1,023,438
28
$1,047,115
4
$179,680
APPLICATIONS WITHDRAWN
0
$0
19
$741,306
40
$683,490
3
$1,000,417
16
$825,711
0
$0
FILES CLOSED FOR INCOMPLETENESS
0
$0
6
$542,542
12
$771,337
0
$0
5
$673,690
0
$0
Aggregated Statistics For Year 2007 (Based on 2 full and 4 partial tracts)
B) Conventional Home Purchase Loans
C) Refinancings
D) Home Improvement Loans
F) Non-occupant Loans on < 5 Family Dwellings (A B C & D)
G) Loans On Manufactured Home Dwelling (A B C & D)
Number
Average Value
Number
Average Value
Number
Average Value
Number
Average Value
Number
Average Value
LOANS ORIGINATED
205
$853,083
234
$687,258
18
$352,158
90
$859,478
6
$96,497
APPLICATIONS APPROVED, NOT ACCEPTED
37
$847,340
52
$696,852
8
$216,586
15
$798,831
2
$88,250
APPLICATIONS DENIED
75
$826,990
125
$736,980
18
$353,503
29
$835,393
9
$108,251
APPLICATIONS WITHDRAWN
41
$905,876
46
$712,655
2
$216,785
12
$956,556
2
$152,355
FILES CLOSED FOR INCOMPLETENESS
9
$1,009,501
13
$816,024
1
$169,360
3
$1,404,337
0
$0
Aggregated Statistics For Year 2006 (Based on 2 full and 4 partial tracts)
B) Conventional Home Purchase Loans
C) Refinancings
D) Home Improvement Loans
F) Non-occupant Loans on < 5 Family Dwellings (A B C & D)
G) Loans On Manufactured Home Dwelling (A B C & D)
Number
Average Value
Number
Average Value
Number
Average Value
Number
Average Value
Number
Average Value
LOANS ORIGINATED
302
$701,089
245
$631,532
22
$380,508
122
$734,863
6
$202,163
APPLICATIONS APPROVED, NOT ACCEPTED
39
$750,028
45
$591,083
6
$284,702
13
$746,671
2
$38,775
APPLICATIONS DENIED
72
$741,270
82
$607,291
12
$419,522
28
$900,666
7
$100,417
APPLICATIONS WITHDRAWN
41
$740,484
54
$606,283
5
$178,428
14
$636,528
0
$0
FILES CLOSED FOR INCOMPLETENESS
6
$763,940
15
$704,306
1
$139,050
3
$1,032,893
0
$0
Aggregated Statistics For Year 2005 (Based on 2 full and 4 partial tracts)
A) FHA, FSA/RHS & VA Home Purchase Loans
B) Conventional Home Purchase Loans
C) Refinancings
D) Home Improvement Loans
F) Non-occupant Loans on < 5 Family Dwellings (A B C & D)
G) Loans On Manufactured Home Dwelling (A B C & D)
Number
Average Value
Number
Average Value
Number
Average Value
Number
Average Value
Number
Average Value
Number
Average Value
LOANS ORIGINATED
3
$146,957
381
$582,334
279
$500,436
18
$270,334
131
$701,137
6
$75,182
APPLICATIONS APPROVED, NOT ACCEPTED
0
$0
37
$486,498
32
$552,754
2
$154,225
10
$712,752
2
$117,330
APPLICATIONS DENIED
0
$0
59
$499,518
60
$495,802
11
$198,945
19
$591,118
6
$50,182
APPLICATIONS WITHDRAWN
0
$0
46
$464,571
46
$504,083
2
$221,205
16
$589,439
4
$136,332
FILES CLOSED FOR INCOMPLETENESS
0
$0
11
$656,888
25
$585,430
2
$542,965
3
$695,397
0
$0
Aggregated Statistics For Year 2004 (Based on 2 full and 4 partial tracts)
A) FHA, FSA/RHS & VA Home Purchase Loans
B) Conventional Home Purchase Loans
C) Refinancings
D) Home Improvement Loans
F) Non-occupant Loans on < 5 Family Dwellings (A B C & D)
G) Loans On Manufactured Home Dwelling (A B C & D)
Number
Average Value
Number
Average Value
Number
Average Value
Number
Average Value
Number
Average Value
Number
Average Value
LOANS ORIGINATED
4
$135,570
327
$417,810
278
$403,687
19
$294,267
115
$530,403
4
$91,895
APPLICATIONS APPROVED, NOT ACCEPTED
0
$0
27
$564,916
29
$445,100
3
$166,537
4
$922,772
1
$52,260
APPLICATIONS DENIED
1
$104,630
54
$402,799
71
$461,882
13
$282,857
18
$502,904
9
$87,414
APPLICATIONS WITHDRAWN
0
$0
36
$484,697
55
$436,974
2
$338,755
19
$539,642
1
$69,050
FILES CLOSED FOR INCOMPLETENESS
0
$0
3
$500,280
17
$457,866
1
$137,090
2
$1,078,345
1
$126,860
Aggregated Statistics For Year 2003 (Based on 2 full and 4 partial tracts)
A) FHA, FSA/RHS & VA Home Purchase Loans
B) Conventional Home Purchase Loans
C) Refinancings
D) Home Improvement Loans
F) Non-occupant Loans on < 5 Family Dwellings (A B C & D)
Number
Average Value
Number
Average Value
Number
Average Value
Number
Average Value
Number
Average Value
LOANS ORIGINATED
4
$128,322
183
$424,434
476
$375,486
9
$93,610
156
$522,334
APPLICATIONS APPROVED, NOT ACCEPTED
0
$0
16
$371,121
46
$356,756
0
$0
8
$506,246
APPLICATIONS DENIED
0
$0
37
$367,701
95
$467,745
5
$75,542
20
$571,606
APPLICATIONS WITHDRAWN
0
$0
19
$473,331
79
$390,959
0
$0
16
$566,522
FILES CLOSED FOR INCOMPLETENESS
0
$0
2
$1,130,730
13
$539,690
0
$0
1
$381,400
Aggregated Statistics For Year 2002 (Based on 2 partial tracts)
A) FHA, FSA/RHS & VA Home Purchase Loans
B) Conventional Home Purchase Loans
C) Refinancings
D) Home Improvement Loans
F) Non-occupant Loans on < 5 Family Dwellings (A B C & D)
Number
Average Value
Number
Average Value
Number
Average Value
Number
Average Value
Number
Average Value
LOANS ORIGINATED
0
$0
172
$404,353
474
$440,961
7
$92,254
129
$472,635
APPLICATIONS APPROVED, NOT ACCEPTED
0
$0
15
$603,579
46
$425,164
2
$35,985
13
$590,797
APPLICATIONS DENIED
1
$136,110
19
$428,889
57
$361,342
3
$84,373
9
$539,376
APPLICATIONS WITHDRAWN
0
$0
26
$353,529
59
$992,054
0
$0
9
$366,276
FILES CLOSED FOR INCOMPLETENESS
0
$0
4
$400,738
8
$338,804
0
$0
1
$467,080
Aggregated Statistics For Year 2001 (Based on 2 partial tracts)
A) FHA, FSA/RHS & VA Home Purchase Loans
B) Conventional Home Purchase Loans
C) Refinancings
D) Home Improvement Loans
F) Non-occupant Loans on < 5 Family Dwellings (A B C & D)
Number
Average Value
Number
Average Value
Number
Average Value
Number
Average Value
Number
Average Value
LOANS ORIGINATED
23
$121,932
133
$357,183
240
$356,757
9
$39,277
93
$471,759
APPLICATIONS APPROVED, NOT ACCEPTED
0
$0
18
$338,749
24
$347,942
2
$43,330
7
$684,111
APPLICATIONS DENIED
23
$112,161
52
$272,020
54
$263,341
4
$41,615
11
$537,982
APPLICATIONS WITHDRAWN
0
$0
26
$424,973
32
$361,646
1
$48,960
9
$575,171
FILES CLOSED FOR INCOMPLETENESS
0
$0
6
$417,058
5
$395,108
0
$0
1
$718,730
Aggregated Statistics For Year 2000 (Based on 2 partial tracts)
A) FHA, FSA/RHS & VA Home Purchase Loans
B) Conventional Home Purchase Loans
C) Refinancings
D) Home Improvement Loans
F) Non-occupant Loans on < 5 Family Dwellings (A B C & D)
Number
Average Value
Number
Average Value
Number
Average Value
Number
Average Value
Number
Average Value
LOANS ORIGINATED
45
$104,851
164
$337,493
71
$301,014
6
$141,820
57
$442,719
APPLICATIONS APPROVED, NOT ACCEPTED
14
$104,390
67
$187,890
28
$122,278
1
$68,540
10
$339,880
APPLICATIONS DENIED
8
$107,956
132
$111,540
44
$198,600
4
$37,088
9
$282,119
APPLICATIONS WITHDRAWN
1
$107,710
90
$164,772
29
$222,312
1
$96,940
7
$478,060
FILES CLOSED FOR INCOMPLETENESS
0
$0
6
$393,557
2
$444,555
0
$0
2
$397,555
Aggregated Statistics For Year 1999 (Based on 2 partial tracts)
A) FHA, FSA/RHS & VA Home Purchase Loans
B) Conventional Home Purchase Loans
C) Refinancings
D) Home Improvement Loans
F) Non-occupant Loans on < 5 Family Dwellings (A B C & D)


 Nearest zip codes: 85215, 85263, 85207, 85268, 85119, 85120.
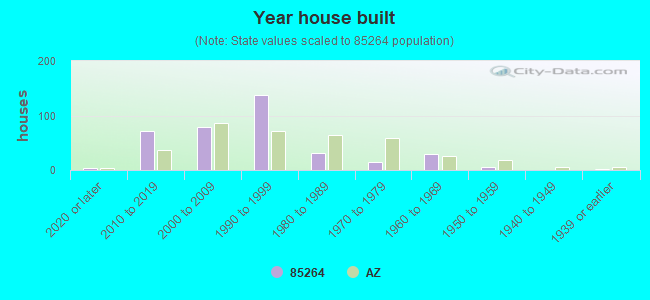


 (Students: 46, Location: 17650 E YAVAPAI RD, Grades: PK-KG)