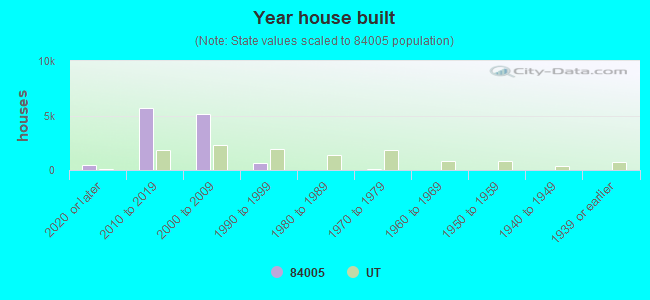
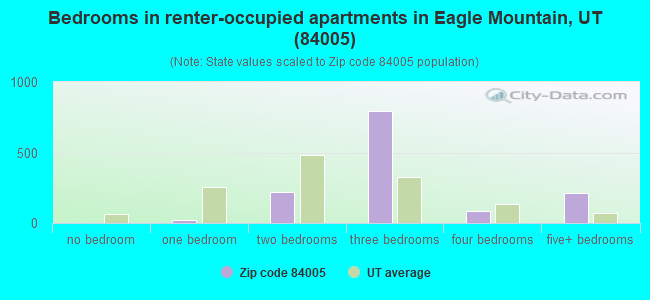
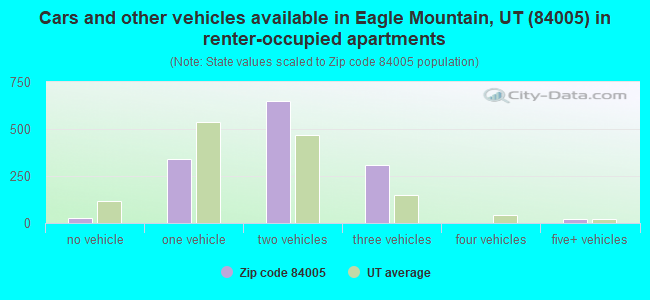
Houses and condos: 11,653 Renter-occupied apartments: 1,331
% of renters here:
12%
State:
29%
March 2022 cost of living index in zip code 84005: 87.6 (less than average, U.S. average is 100)
Land area: 30.8 sq. mi. Water area: 0.0 sq. mi.
Population density: 1,524 people per square mile
(low).
OSM Map
Google Map
MSN Map
OSM Map
General Map
Google Map
MSN Map
OSM Map
Google Map
MSN Map
OSM Map
Google Map
MSN Map
Please wait while loading the map...
Real estate property taxes paid for housing units in 2022:
This zip code:
0.4% ($2,036)
Utah:
0.5% ($2,376)
Median real estate property taxes paid for housing units with mortgages in 2022: $2,042 (0.4%) Median real estate property taxes paid for housing units with no mortgage in 2022: $2,013 (0.4%)
Business Search- 14 Million verified businesses
Males: 23,693
(50.4%)
Females: 23,291
(49.6%)
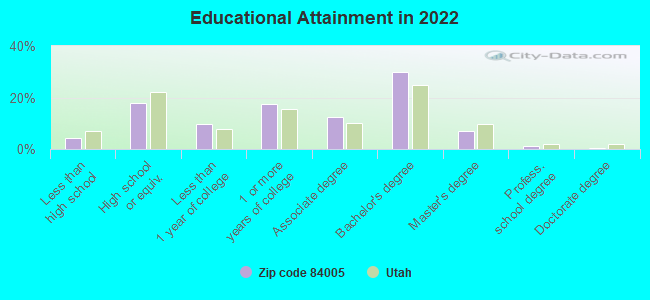
For population 25 years and over in 84005:
High school or higher: 95.5%
Bachelor's degree or higher: 38.3%
Graduate or professional degree: 8.6%
Unemployed: 3.0%
Mean travel time to work (commute): 30.7 minutes
For population 15 years and over in 84005:
Never married: 24.6%
Now married: 69.4%
Separated: 0.4%
Widowed: 0.6%
Divorced: 5.0%
Zip code 84005 compared to state average:
Black race population percentage significantly below state average.
Median age significantly below state average.
Renting percentage significantly below state average.
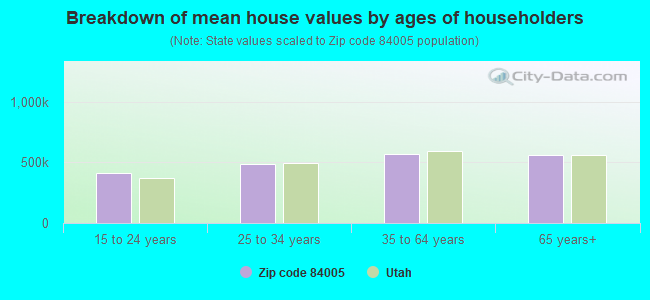
Estimated median house/condo value in 2022: $527,135
84005:
$527,135
Utah:
$499,500
According to our research of Utah and other state lists, there were 55 registered sex offenders living in 84005 zip code as of May 09, 2024. The ratio of all residents to sex offenders in zip code 84005 is 480 to 1. The ratio of registered sex offenders to all residents in this zip code is lower than the state average.
Median resident age:
This zip code:
22.4 years
Utah median age:
32.1 years
Average household size:
This zip code:
4.1 people
Utah:
3.0 people
Averages for the 2020 tax year for zip code 84005, filed in 2021:
Average Adjusted Gross Income (AGI) in 2020: $73,468 (Individual Income Tax Returns)
Here:
$73,468
State:
$81,660
Salary/wage: $67,467 (reported on 94.3% of returns)
Here:
$67,467
State:
$63,027
(% of AGI for various income ranges: 1312.9% for AGIs below $25k, 3842.8% for AGIs $25k-50k, 6955.1% for AGIs $50k-75k, 10185.9% for AGIs $75k-100k, 18480.0% for AGIs $100k-200k, 50869.0% for AGIs over 200k)
Taxable interest for individuals: $460 (reported on 18.6% of returns)
This zip code:
$460
Utah:
$2,255
(% of AGI for various income ranges: 3.0% for AGIs below $25k, 3.0% for AGIs $25k-50k, 6.8% for AGIs $50k-75k, 12.6% for AGIs $75k-100k, 12.2% for AGIs $100k-200k, 263.5% for AGIs over 200k)
Ordinary dividends: $1,385 (reported on 9.4% of returns)
Here:
$1,385
State:
$7,362
(% of AGI for various income ranges: 2.6% for AGIs below $25k, 5.2% for AGIs $25k-50k, 8.0% for AGIs $50k-75k, 9.4% for AGIs $75k-100k, 20.3% for AGIs $100k-200k, 534.0% for AGIs over 200k)
Net capital gain/loss in AGI: +$9,773 (reported on 12.5% of returns)
Here:
+$9,773
State:
+$43,433
(% of AGI for various income ranges: 3.2% for AGIs below $25k, 7.3% for AGIs $25k-50k, 22.1% for AGIs $50k-75k, 54.6% for AGIs $75k-100k, 210.0% for AGIs $100k-200k, 6681.5% for AGIs over 200k)
Profit/loss from business: +$6,986 (reported on 19.7% of returns)
Here:
+$6,986
State:
+$9,957
(% of AGI for various income ranges: 79.2% for AGIs below $25k, 133.3% for AGIs $25k-50k, 150.9% for AGIs $50k-75k, 150.0% for AGIs $75k-100k, 282.0% for AGIs $100k-200k, 1737.0% for AGIs over 200k)
Taxable individual retirement arrangement distribution: $19,391 (reported on 2.8% of returns)
84005:
$19,391
Utah:
$21,167
(% of AGI for various income ranges: 12.0% for AGIs below $25k, 26.4% for AGIs $25k-50k, 43.1% for AGIs $50k-75k, 47.6% for AGIs $75k-100k, 164.2% for AGIs $100k-200k, 1066.0% for AGIs over 200k)
Total itemized deductions: $32,681 (reported on 16.6% of returns)
Here:
$32,681
State:
$41,056
(% of AGI for various income ranges: 28.6% for AGIs below $25k, 110.5% for AGIs $25k-50k, 377.3% for AGIs $50k-75k, 634.8% for AGIs $75k-100k, 2041.4% for AGIs $100k-200k, 8362.0% for AGIs over 200k)
Charity contributions: $13,627 (reported on 14.5% of returns)
Here:
$13,627
State:
$22,261
(% of AGI for various income ranges: 4.8% for AGIs below $25k, 16.2% for AGIs $25k-50k, 68.2% for AGIs $50k-75k, 182.6% for AGIs $75k-100k, 765.2% for AGIs $100k-200k, 4694.5% for AGIs over 200k)
Taxes paid: $7,485 (reported on 16.6% of returns)
84005:
$7,485
State:
$7,985
(% of AGI for various income ranges: 3.6% for AGIs below $25k, 19.8% for AGIs $25k-50k, 72.6% for AGIs $50k-75k, 141.6% for AGIs $75k-100k, 524.4% for AGIs $100k-200k, 1615.5% for AGIs over 200k)
Earned income credit: $2,420 (reported on 12.0% of returns)
Here:
$2,420
State:
$2,169
(% of AGI for various income ranges: 76.4% for AGIs below $25k, 93.0% for AGIs $25k-50k, 3.8% for AGIs $50k-75k)
Percentage of individuals using paid preparers for their 2020 taxes: 96.2%
Here:
96%
State:
94%
(% for various income ranges: 94.8% for AGIs below $25k, 96.1% for AGIs $25k-50k, 96.4% for AGIs $50k-75k, 97.1% for AGIs $75k-100k, 96.8% for AGIs $100k-200k, 95.9% for AGIs over 200k)
Averages for the 2012 tax year for zip code 84005, filed in 2013:
Average Adjusted Gross Income (AGI) in 2012: $55,142 (Individual Income Tax Returns)
Here:
$55,142
State:
$60,327
Salary/wage: $51,544 (reported on 95.2% of returns)
Here:
$51,544
State:
$48,762
(% of AGI for various income ranges: 85.1% for AGIs below $25k, 92.4% for AGIs $25k-50k, 92.5% for AGIs $50k-75k, 91.6% for AGIs $75k-100k, 88.1% for AGIs $100k-200k, 52.0% for AGIs over 200k)
Taxable interest for individuals: $378 (reported on 25.6% of returns)
This zip code:
$378
Utah:
$1,534
(% of AGI for various income ranges: 0.4% for AGIs below $25k, 0.1% for AGIs $25k-50k, 0.1% for AGIs $50k-75k, 0.2% for AGIs $75k-100k, 0.2% for AGIs $100k-200k, 0.2% for AGIs over 200k)
Ordinary dividends: $1,033 (reported on 6.5% of returns)
Here:
$1,033
State:
$5,711
(% of AGI for various income ranges: 0.1% for AGIs below $25k, 0.1% for AGIs $25k-50k, 0.1% for AGIs $75k-100k, 0.5% for AGIs over 200k)
Net capital gain/loss in AGI: +$4,306 (reported on 7.7% of returns)
Here:
+$4,306
State:
+$23,734
(% of AGI for various income ranges: 0.2% for AGIs $50k-75k, 0.3% for AGIs $75k-100k, 9.3% for AGIs over 200k)
Profit/loss from business: +$5,829 (reported on 19.2% of returns)
Here:
+$5,829
State:
+$8,845
(% of AGI for various income ranges: 7.5% for AGIs below $25k, 2.8% for AGIs $25k-50k, 1.5% for AGIs $50k-75k, 1.0% for AGIs $75k-100k, 2.3% for AGIs $100k-200k)
Taxable individual retirement arrangement distribution: $11,204 (reported on 3.8% of returns)
84005:
$11,204
Utah:
$15,565
(% of AGI for various income ranges: 1.1% for AGIs below $25k, 0.5% for AGIs $25k-50k, 0.5% for AGIs $50k-75k, 0.8% for AGIs $75k-100k, 1.6% for AGIs $100k-200k)
Total itemized deductions: $20,879 (28% of AGI, reported on 51.6% of returns)
Here:
$20,879
State:
$25,197
Here:
27.5% of AGI
State:
22.4% of AGI
(% of AGI for various income ranges: 11.3% for AGIs below $25k, 16.3% for AGIs $25k-50k, 21.0% for AGIs $50k-75k, 21.4% for AGIs $75k-100k, 21.2% for AGIs $100k-200k, 16.7% for AGIs over 200k)
Charity contributions: $6,122 (reported on 45.0% of returns)
Here:
$6,122
State:
$8,502
(% of AGI for various income ranges: 2.0% for AGIs below $25k, 3.6% for AGIs $25k-50k, 5.1% for AGIs $50k-75k, 5.3% for AGIs $75k-100k, 6.2% for AGIs $100k-200k, 5.9% for AGIs over 200k)
Taxes paid: $4,389 (reported on 51.5% of returns)
84005:
$4,389
State:
$7,001
(% of AGI for various income ranges: 1.2% for AGIs below $25k, 2.6% for AGIs $25k-50k, 4.0% for AGIs $50k-75k, 4.9% for AGIs $75k-100k, 5.3% for AGIs $100k-200k, 4.9% for AGIs over 200k)
Earned income credit: $2,385 (reported on 22.2% of returns)
Here:
$2,385
State:
$2,259
(% of AGI for various income ranges: 8.8% for AGIs below $25k, 2.8% for AGIs $25k-50k)
Percentage of individuals using paid preparers for their 2012 taxes: 41.5%
Here:
42%
State:
51%
(% for various income ranges: 40.4% for AGIs below $25k, 41.1% for AGIs $25k-50k, 40.1% for AGIs $50k-75k, 41.2% for AGIs $75k-100k, 46.8% for AGIs $100k-200k, 83.3% for AGIs over 200k)
Likely homosexual households (counted as self-reported same-sex unmarried-partner households)
Lesbian couples: 0.0% of all households
Gay men: 0.1% of all households
Household received Food Stamps/SNAP in the past 12 months: 614 Household did not receive Food Stamps/SNAP in the past 12 months: 10,851
Women who had a birth in the past 12 months: 1,673 (1,620 now married, 73 unmarried) Women who did not have a birth in the past 12 months: 10,881 (6,833 now married, 3,997 unmarried)
Housing units in zip code 84005 with a mortgage: 8,743 (1,153 second mortgage, 56 home equity loan, 843 both second mortgage and home equity loan) Houses without a mortgage: 57
Median monthly owner costs for units with a mortgage: $1,909 Median monthly owner costs for units without a mortgage: $454
Residents with income below the poverty level in 2022:
This zip code:
3.3%
Whole state:
8.2%
Residents with income below 50% of the poverty level in 2022:
This zip code:
1.8%
Whole state:
4.3%
Median number of rooms in houses and condos:
Here:
7.2
State:
7.6
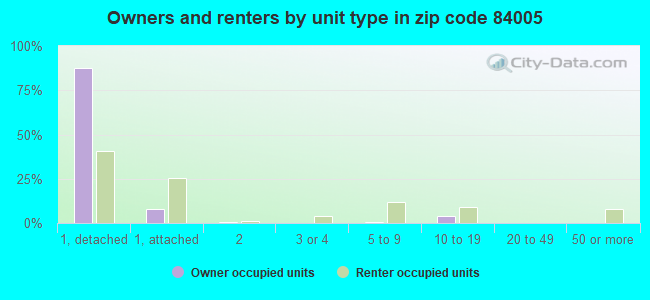
Median number of rooms in apartments:
Here:
5.3
State:
4.3
Notable locations in this zip code not listed on our city pages
Notable locations in zip code 84005: Eagle Mountain Fire Department Station 2 (A), Eagle Mountain Fire Department Station 1 (B). Display/hide their locations on the map
Size of family households: 1,754 2-persons, 1,449 3-persons, 2,665 4-persons, 2,307 5-persons, 1,381 6-persons, 1,007 7-or-more-persons
Size of nonfamily households: 538 1-person, 176 2-persons, 40 4-persons
18,247 married couples with children.
1,045 single-parent households (557 men, 488 women).
88.2% of residents of 84005 zip code speak English at home.
9.4% of residents speak Spanish at home (61% very well, 24% well, 10% not well, 5% not at all).
0.7% of residents speak other Indo-European language at home (93% very well, 7% not well).
0.7% of residents speak Asian or Pacific Island language at home (93% very well, 7% well).
0.2% of residents speak other language at home (68% very well, 32% not at all).
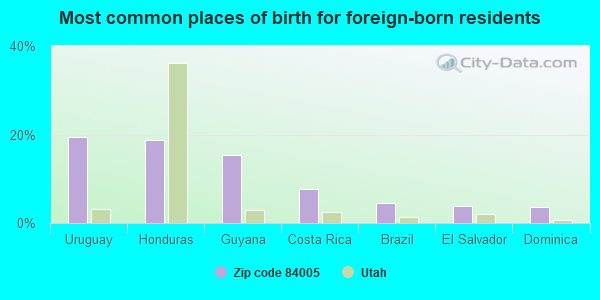
Foreign born population: 2,812 (6.0%) (32.8% of them are naturalized citizens)
This zip code:
6.0%
Whole state:
8.6%
19%Uruguay
19%Honduras
15%Guyana
8%Costa Rica
5%Brazil
4%El Salvador
4%Dominica
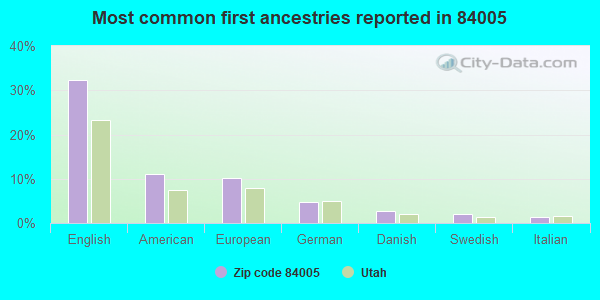
32%English
11%American
10%European
5%German
3%Danish
2%Swedish
1%Italian
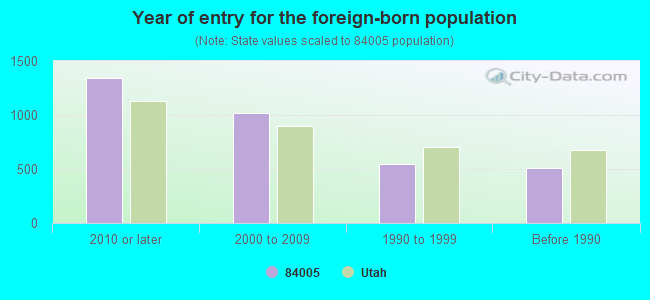
Year of entry for the foreign-born population
1,3422010 or later
1,0162000 to 2009
5451990 to 1999
511Before 1990
Housing units lacking complete plumbing facilities: 0.9% Housing units lacking complete kitchen facilities: 1.2%
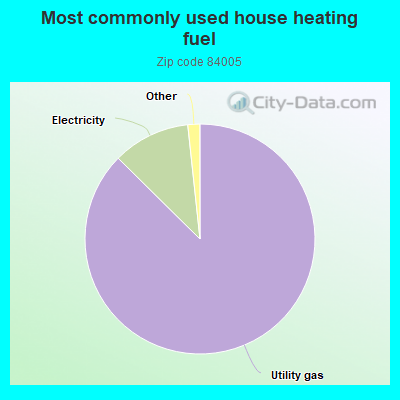
87.4%Utility gas
10.9%Electricity
0.8%Solar energy
0.7%Bottled, tank, or LP gas
Place of birth for U.S.-born residents:
This state: 33,201
Northeast: 812
Midwest: 987
South: 1,343
West: 7,127
87% of the 84005 zip code residents lived in the same house 1 year ago. Out of people who lived in different houses, 50% moved from this county. Out of people who lived in different houses, 31% moved from different county within same state. Out of people who lived in different houses, 16% moved from different state. Out of people who lived in different houses, 4% moved from abroad.
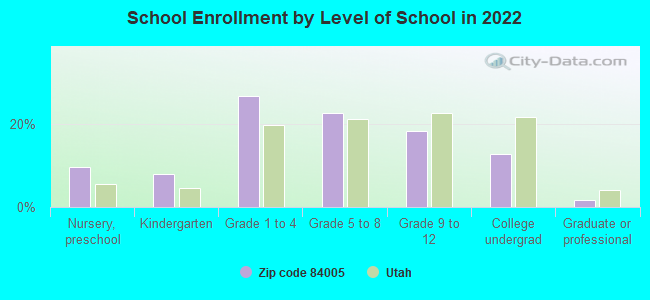
Private vs. public school enrollment:
Students in private schools in grades 1 to 8 (elementary and middle school): 1,309
Here:
15.6%
Utah:
7.2%
Students in private schools in grades 9 to 12 (high school): 176
Here:
5.7%
Utah:
5.3%
Students in private undergraduate colleges: 484
Here:
22.4%
Utah:
26.7%
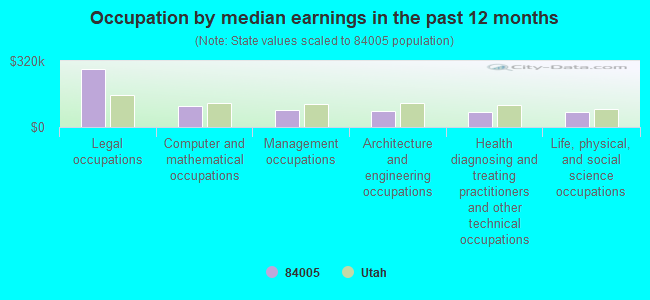
Occupation by median earnings in the past 12 months ($)
282,388Legal occupations
99,668Computer and mathematical occupations
83,716Management occupations
76,508Architecture and engineering occupations
74,756Health diagnosing and treating practitioners and other technical occupations
74,116Life, physical, and social science occupations
Top industries in this zip code by the number of employees in 2005:
Arts, Entertainment, and Recreation: Golf Courses and Country Clubs (10-19: 1)
Construction: All Other Specialty Trade Contractors (5-9: 1, 1-4: 2)
Professional, Scientific, and Technical Services: Surveying and Mapping (except Geophysical) Services (5-9: 1)
Health Care and Social Assistance: Child Day Care Services (5-9: 1)
Construction: New Single-Family Housing Construction (except Operative Builders) (1-4: 2)
Construction: Plumbing, Heating, and Air-Conditioning Contractors (1-4: 2)
Professional, Scientific, and Technical Services: Other Computer Related Services (1-4: 1)
Professional, Scientific, and Technical Services: Other Accounting Services (1-4: 1)
Accommodation and Food Services: Caterers (1-4: 1)
Fatal accident statistics in 2014:
Fatal accident count: 1
Vehicles involved in fatal accidents: 2
Fatal accidents caused by drunken drivers: 1
Fatalities: 2
Persons involved in fatal accidents: 5
Pedestrians involved in fatal accidents: 0
Fatal accident statistics in 2011:
Fatal accident count: 1
Vehicles involved in fatal accidents: 1
Fatal accidents caused by drunken drivers: 0
Fatalities: 1
Persons involved in fatal accidents: 1
Pedestrians involved in fatal accidents: 0
2006 - 2018 National Fire Incident Reporting System (NFIRS) incidents
According to the data from the years 2006 - 2018 the average number of fires per year is 33. The highest number of fire incidents - 64 took place in 2018, and the least - 4 in 2006. The data has an increasing trend.
When looking into fire subcategories, the most incidents belonged to: Outside Fires (45.3%), and Structure Fires (37.1%).
Fire incident types reported to NFIRS in Zip Code 84005


 According to the data from the years 2006 - 2018 the average number of fires per year is 33. The highest number of fire incidents - 64 took place in 2018, and the least - 4 in 2006. The data has an increasing trend.
 When looking into fire subcategories, the most incidents belonged to: Outside Fires (45.3%), and Structure Fires (37.1%).