Estimated zip code population in 2022: 1,856 Zip code population in 2010: 1,524 Zip code population in 2000: 1,497
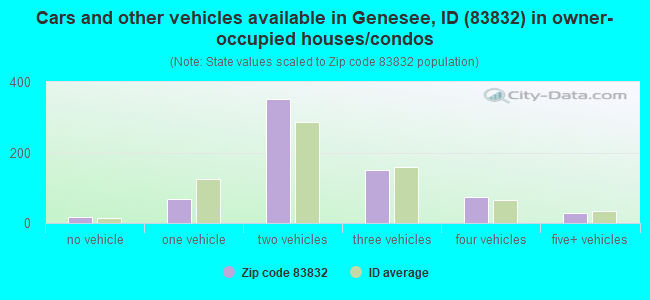
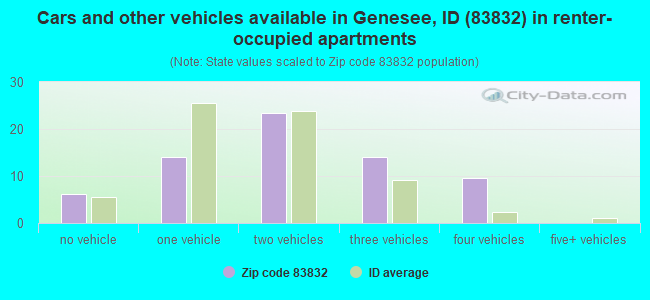
Houses and condos: 819 Renter-occupied apartments: 66
% of renters here:
9%
State:
28%
March 2022 cost of living index in zip code 83832: 87.4 (less than average, U.S. average is 100)
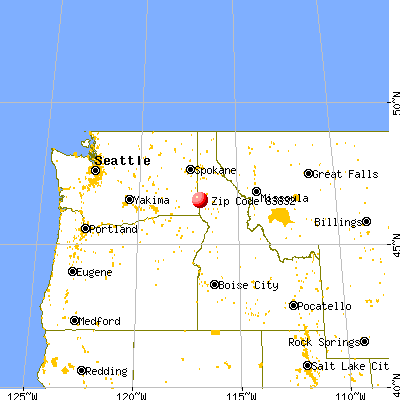
Land area: 145.6 sq. mi. Water area: 0.0 sq. mi.
Population density: 13 people per square mile
(very low).
OSM Map
General Map
Google Map
MSN Map
OSM Map
General Map
Google Map
MSN Map
OSM Map
General Map
Google Map
MSN Map
OSM Map
General Map
Google Map
MSN Map
Please wait while loading the map...
Real estate property taxes paid for housing units in 2022:
This zip code:
0.5% ($1,932)
Idaho:
0.5% ($1,995)
Median real estate property taxes paid for housing units with mortgages in 2022: $2,107 (0.6%) Median real estate property taxes paid for housing units with no mortgage in 2022: $1,515 (0.4%)
Business Search- 14 Million verified businesses
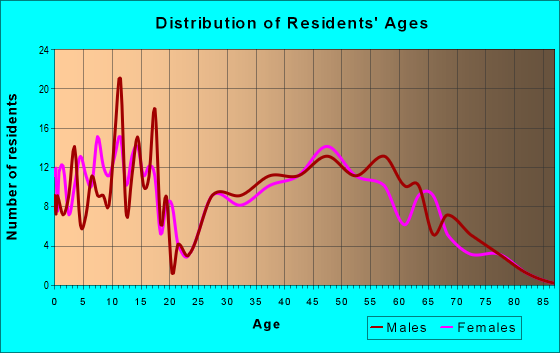
Males: 971
(52.4%)
Females: 884
(47.6%)
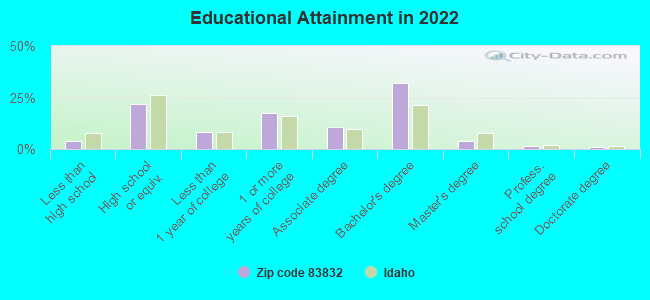
For population 25 years and over in 83832:
High school or higher: 97.1%
Bachelor's degree or higher: 38.4%
Graduate or professional degree: 6.3%
Unemployed: 1.8%
Mean travel time to work (commute): 28.9 minutes
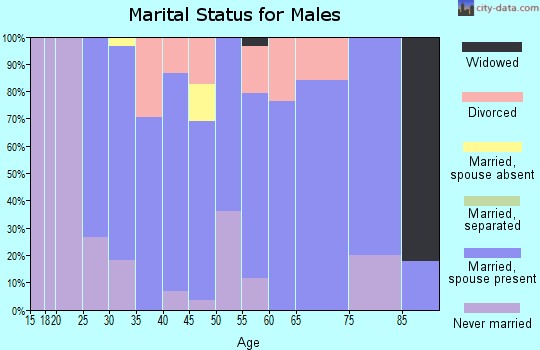
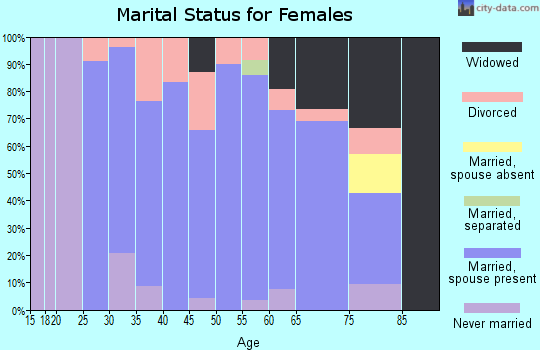
For population 15 years and over in 83832:
Never married: 11.2%
Now married: 76.4%
Separated: 1.4%
Widowed: 3.6%
Divorced: 7.5%
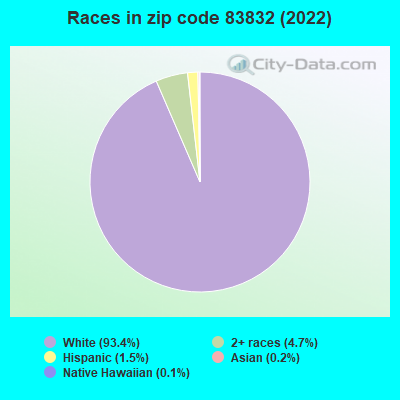
Zip code 83832 compared to state average:
Black race population percentage significantly below state average.
Hispanic race population percentage significantly below state average.
Median age above state average.
Foreign-born population percentage significantly below state average.
Renting percentage significantly below state average.
Length of stay since moving in significantly above state average.
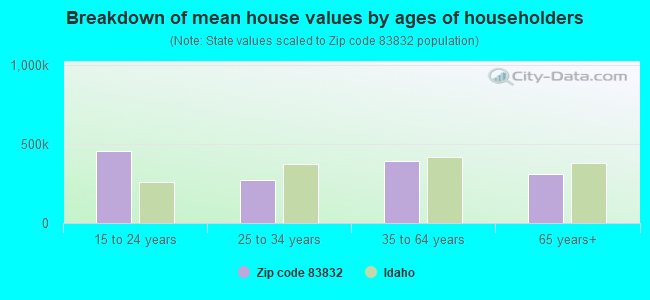
Estimated median house/condo value in 2022: $370,547
83832:
$370,547
Idaho:
$432,500
Median resident age:
This zip code:
42.7 years
Idaho median age:
37.5 years
Average household size:
This zip code:
2.5 people
Idaho:
2.6 people
Averages for the 2020 tax year for zip code 83832, filed in 2021:
Average Adjusted Gross Income (AGI) in 2020: $72,788 (Individual Income Tax Returns)
Here:
$72,788
State:
$73,627
Salary/wage: $57,525 (reported on 82.9% of returns)
Here:
$57,525
State:
$55,245
(% of AGI for various income ranges: 1425.0% for AGIs below $25k, 3938.2% for AGIs $25k-50k, 7318.8% for AGIs $50k-75k, 8688.6% for AGIs $75k-100k, 19292.5% for AGIs $100k-200k)
Taxable interest for individuals: $1,067 (reported on 39.5% of returns)
This zip code:
$1,067
Idaho:
$2,230
(% of AGI for various income ranges: 9.2% for AGIs below $25k, 30.0% for AGIs $25k-50k, 42.5% for AGIs $50k-75k, 41.4% for AGIs $75k-100k, 171.2% for AGIs $100k-200k)
Ordinary dividends: $5,606 (reported on 21.1% of returns)
Here:
$5,606
State:
$7,088
(% of AGI for various income ranges: 61.8% for AGIs $25k-50k, 83.8% for AGIs $50k-75k, 87.1% for AGIs $75k-100k, 580.0% for AGIs $100k-200k)
Net capital gain/loss in AGI: +$15,765 (reported on 22.4% of returns)
Here:
+$15,765
State:
+$37,284
(% of AGI for various income ranges: 30.8% for AGIs below $25k, 5.5% for AGIs $25k-50k, 91.2% for AGIs $50k-75k, 247.1% for AGIs $75k-100k, 627.5% for AGIs $100k-200k)
Profit/loss from business: +$7,190 (reported on 13.2% of returns)
Here:
+$7,190
State:
+$12,955
(% of AGI for various income ranges: 86.7% for AGIs below $25k, 497.5% for AGIs $50k-75k, 271.2% for AGIs $100k-200k)
Taxable individual retirement arrangement distribution: $18,586 (reported on 9.2% of returns)
83832:
$18,586
Idaho:
$20,110
(% of AGI for various income ranges: 385.5% for AGIs $25k-50k, 1252.9% for AGIs $75k-100k)
Total itemized deductions: $26,150 (reported on 2.6% of returns)
Here:
$26,150
State:
$38,402
(% of AGI for various income ranges: 653.8% for AGIs $50k-75k)
Taxes paid: $8,450 (reported on 2.6% of returns)
83832:
$8,450
State:
$7,596
(% of AGI for various income ranges: 211.2% for AGIs $50k-75k)
Earned income credit: $2,686 (reported on 9.2% of returns)
Here:
$2,686
State:
$2,195
(% of AGI for various income ranges: 100.0% for AGIs below $25k, 61.8% for AGIs $25k-50k)
Percentage of individuals using paid preparers for their 2020 taxes: 92.1%
Here:
92%
State:
94%
(% for various income ranges: 94.4% for AGIs below $25k, 87.5% for AGIs $25k-50k, 92.3% for AGIs $50k-75k, 90.0% for AGIs $75k-100k, 93.8% for AGIs $100k-200k, 100.0% for AGIs over 200k)
Averages for the 2012 tax year for zip code 83832, filed in 2013:
Average Adjusted Gross Income (AGI) in 2012: $62,054 (Individual Income Tax Returns)
Here:
$62,054
State:
$52,536
Salary/wage: $45,785 (reported on 81.9% of returns)
Here:
$45,785
State:
$41,938
(% of AGI for various income ranges: 79.8% for AGIs below $25k, 78.1% for AGIs $25k-50k, 75.4% for AGIs $50k-75k, 73.2% for AGIs $75k-100k, 79.9% for AGIs $100k-200k)
Taxable interest for individuals: $759 (reported on 44.4% of returns)
This zip code:
$759
Idaho:
$1,874
(% of AGI for various income ranges: 0.8% for AGIs below $25k, 0.4% for AGIs $25k-50k, 0.3% for AGIs $50k-75k, 0.7% for AGIs $75k-100k, 0.7% for AGIs $100k-200k, 0.6% for AGIs over 200k)
Ordinary dividends: $2,978 (reported on 25.0% of returns)
Here:
$2,978
State:
$5,706
(% of AGI for various income ranges: 1.0% for AGIs below $25k, 0.7% for AGIs $25k-50k, 0.6% for AGIs $50k-75k, 0.8% for AGIs $75k-100k, 1.5% for AGIs $100k-200k, 2.1% for AGIs over 200k)
Net capital gain/loss in AGI: +$3,542 (reported on 16.7% of returns)
Here:
+$3,542
State:
+$14,571
(% of AGI for various income ranges: 15.4% for AGIs $25k-50k, 0.3% for AGIs $75k-100k, 2.3% for AGIs $100k-200k, 1.8% for AGIs over 200k)
Profit/loss from business: +$3,711 (reported on 12.5% of returns)
Here:
+$3,711
State:
+$10,113
(% of AGI for various income ranges: 2.7% for AGIs $25k-50k, 0.9% for AGIs $50k-75k, 1.2% for AGIs $75k-100k)
Taxable individual retirement arrangement distribution: $11,033 (reported on 8.3% of returns)
83832:
$11,033
Idaho:
$14,642
Total itemized deductions: $18,236 (18% of AGI, reported on 34.7% of returns)
Here:
$18,236
State:
$22,697
Here:
18.0% of AGI
State:
22.0% of AGI
(% of AGI for various income ranges: 14.0% for AGIs $25k-50k, 11.8% for AGIs $50k-75k, 10.8% for AGIs $75k-100k, 17.8% for AGIs $100k-200k)
Charity contributions: $2,500 (reported on 25.0% of returns)
Here:
$2,500
State:
$5,246
(% of AGI for various income ranges: 1.3% for AGIs $25k-50k, 1.2% for AGIs $50k-75k, 1.0% for AGIs $75k-100k, 1.9% for AGIs $100k-200k)
Taxes paid: $6,604 (reported on 34.7% of returns)
83832:
$6,604
State:
$7,139
(% of AGI for various income ranges: 2.6% for AGIs $25k-50k, 3.3% for AGIs $50k-75k, 3.6% for AGIs $75k-100k, 8.8% for AGIs $100k-200k)
Earned income credit: $2,388 (reported on 11.1% of returns)
Here:
$2,388
State:
$2,213
(% of AGI for various income ranges: 5.3% for AGIs below $25k, 1.2% for AGIs $25k-50k)
Percentage of individuals using paid preparers for their 2012 taxes: 54.2%
Here:
54%
State:
52%
(% for various income ranges: 38.1% for AGIs below $25k, 52.9% for AGIs $25k-50k, 58.3% for AGIs $50k-75k, 60.0% for AGIs $75k-100k, 77.8% for AGIs $100k-200k, 66.7% for AGIs over 200k)
Averages for the 2004 tax year for zip code 83832, filed in 2005:
Average Adjusted Gross Income (AGI) in 2004: $44,784 (Individual Income Tax Returns)
Here:
$44,784
State:
$42,679
Salary/wage: $37,204 (reported on 83.8% of returns)
Here:
$37,204
State:
$35,636
(% of AGI for various income ranges: 186.5% for AGIs below $10k, 75.8% for AGIs $10k-25k, 76.6% for AGIs $25k-50k, 79.4% for AGIs $50k-75k, 68.1% for AGIs $75k-100k, 44.9% for AGIs over 100k)
Taxable interest for individuals: $1,363 (reported on 53.1% of returns)
This zip code:
$1,363
Idaho:
$2,024
(% of AGI for various income ranges: 14.1% for AGIs below $10k, 3.2% for AGIs $10k-25k, 2.1% for AGIs $25k-50k, 0.7% for AGIs $50k-75k, 0.8% for AGIs $75k-100k, 2.0% for AGIs over 100k)
Taxable dividends: $2,129 (reported on 30.5% of returns)
Here:
$2,129
State:
$2,917
(% of AGI for various income ranges: 9.2% for AGIs below $10k, 1.9% for AGIs $10k-25k, 1.0% for AGIs $25k-50k, 1.7% for AGIs $50k-75k, 0.4% for AGIs $75k-100k, 1.8% for AGIs over 100k)
Net capital gain/loss: +$5,928 (reported on 24.4% of returns)
Here:
+$5,928
State:
+$13,146
(% of AGI for various income ranges: -3.6% for AGIs below $10k, 0.4% for AGIs $10k-25k, 2.1% for AGIs $25k-50k, 0.1% for AGIs $50k-75k, 3.5% for AGIs $75k-100k, 9.2% for AGIs over 100k)
Profit/loss from business: +$4,470 (reported on 17.1% of returns)
Here:
+$4,470
State:
+$8,765
(% of AGI for various income ranges: 13.8% for AGIs below $10k, 2.5% for AGIs $10k-25k, 1.6% for AGIs $25k-50k, 2.3% for AGIs $50k-75k, 0.5% for AGIs $75k-100k, 1.3% for AGIs over 100k)
Profit/loss from farming: +$7,394 (reported on 10.4% of returns)
Here:
+$7,394
State:
-$5,273
(% of AGI for various income ranges: 26.3% for AGIs below $10k, 3.9% for AGIs $25k-50k, 0.7% for AGIs $50k-75k, 2.3% for AGIs $75k-100k)
IRA payment deduction: $3,250 (reported on 2.9% of returns)
83832:
$3,250
Idaho:
$3,020
Total itemized deductions: $15,440 (22% of AGI, reported on 34.2% of returns)
Here:
$15,440
State:
$18,385
Here:
22.1% of AGI
State:
23.1% of AGI
(% of AGI for various income ranges: 42.8% for AGIs below $10k, 9.1% for AGIs $10k-25k, 9.8% for AGIs $25k-50k, 14.1% for AGIs $50k-75k, 12.4% for AGIs $75k-100k, 9.6% for AGIs over 100k)
Charity contributions deductions: $2,401 (3% of AGI, reported on 27.3% of returns)
Here:
$2,401
State:
$3,875
Here:
3.2% of AGI
State:
4.6% of AGI
(% of AGI for various income ranges: 1.4% for AGIs $10k-25k, 1.3% for AGIs $25k-50k, 1.4% for AGIs $50k-75k, 1.7% for AGIs $75k-100k, 1.6% for AGIs over 100k)
Total tax: $5,818 (reported on 78.7% of returns)
83832:
$5,818
State:
$6,282
(% of AGI for various income ranges: 7.2% for AGIs below $10k, 4.3% for AGIs $10k-25k, 6.8% for AGIs $25k-50k, 7.3% for AGIs $50k-75k, 11.1% for AGIs $75k-100k, 18.4% for AGIs over 100k)
Earned income credit: $1,518 (reported on 12.1% of returns)
Here:
$1,518
State:
$1,660
Percentage of individuals using paid preparers for their 2004 taxes: 55.2%
Here:
55%
State:
59%
(% for various income ranges: 44.0% for AGIs below $10k, 57.3% for AGIs $10k-25k, 47.7% for AGIs $25k-50k, 60.5% for AGIs $50k-75k, 70.1% for AGIs $75k-100k, 73.2% for AGIs over 100k)
Likely homosexual households (counted as self-reported same-sex unmarried-partner households)
Lesbian couples: 0.1% of all households
Gay men: 0.0% of all households
Household received Food Stamps/SNAP in the past 12 months: 64 Household did not receive Food Stamps/SNAP in the past 12 months: 681
Women who had a birth in the past 12 months: 11 (9 now married, 1 unmarried) Women who did not have a birth in the past 12 months: 304 (245 now married, 63 unmarried)
Housing units in zip code 83832 with a mortgage: 394 (39 second mortgage, 33 both second mortgage and home equity loan) Median monthly owner costs for units with a mortgage: $1,543 Median monthly owner costs for units without a mortgage: $458
Residents with income below the poverty level in 2022:
This zip code:
6.4%
Whole state:
10.7%
Residents with income below 50% of the poverty level in 2022:
This zip code:
3.3%
Whole state:
6.1%
Median number of rooms in houses and condos:
Here:
6.7
State:
6.5
Median number of rooms in apartments:
Here:
5.2
State:
4.4
Notable locations in this zip code not listed on our city pages
Cemeteries: Overacker Cemetery (1), Genesee Valley Lutheran Cemetery (2), Saint Johns Lutheran Cemetery (3), Cordelia Lutheran Cemetery (4). Display/hide their locations on the map
Size of family households: 275 2-persons, 135 3-persons, 105 4-persons, 71 5-persons, 12 6-persons, 8 7-or-more-persons
Size of nonfamily households: 117 1-person, 15 2-persons, 2 3-persons
382 married couples with children.
45 single-parent households (8 men, 37 women).
99.1% of residents of 83832 zip code speak English at home.
0.8% of residents speak Spanish at home (15% very well, 85% well).
0.1% of residents speak other Indo-European language at home (100% very well).
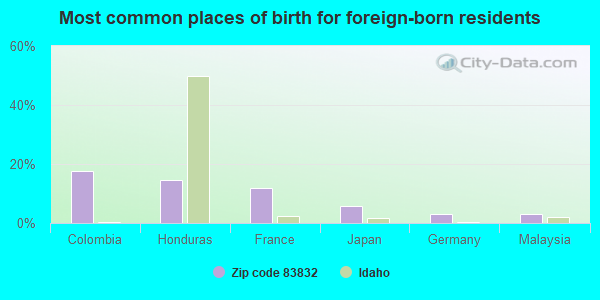
Foreign born population: 37 (2.0%) (68.9% of them are naturalized citizens)
This zip code:
2.0%
Whole state:
6.0%
18%Colombia
15%Honduras
12%France
6%Japan
3%Germany
3%Malaysia
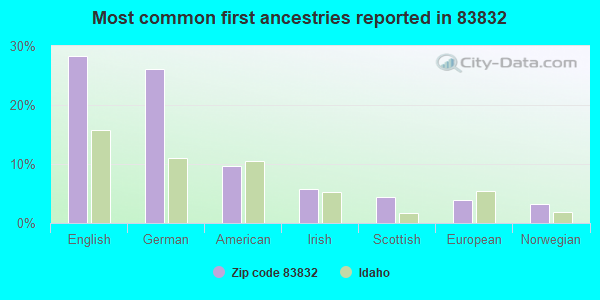
28%English
26%German
10%American
6%Irish
4%Scottish
4%European
3%Norwegian
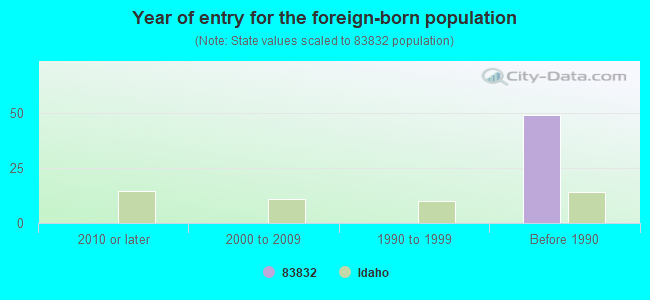
Year of entry for the foreign-born population
02010 or later
02000 to 2009
01990 to 1999
49Before 1990
Facilities with environmental interests located in this zip code:
GENESEE ELEMENTARY SCHOOL (330 WEST ASH STREET in GENESEE, ID)
(Geographic Names Information System) (National Center for Education Statistics) - STATE ID-282 101 Organizations: GENESEE JOINT SCHOOL DISTRICT 282 (SCHOOL DISTRICT)
GENESEE JR-SR HIGH SCHOOL (330 WEST ASH STREET in GENESEE, ID)
(National Center for Education Statistics) - STATE ID-282 501 Organizations: GENESEE JOINT SCHOOL DISTRICT 282 (SCHOOL DISTRICT)
GENESEE MEATS (HWY 95 1 MI W OF GENESEE in GENESEE, ID)
(Resource Conservation and Recovery Act (tracking hazardous waste)) Business NAICS classification: SOIL PREPARATION, PLANTING, AND CULTIVATING. Organizations: UNKNOWN (CONTACT/OWNER)
PUREGRO CO GENESEE UNIT NO 104 (RT 1 BOX 2A in GENESEE, ID)
(Resource Conservation and Recovery Act (tracking hazardous waste)) Organizations: WILBUR ELLIS CO (CONTACT/OWNER)
GENESEE, CITY OF (WWTP) (140 E WALNUT in GENESEE, ID)
National Pollutant Discharge Elimination System NON-MAJOR (Tracking pollutant discharge elimination systems) - permit Business SIC classification: SEWERAGE SYSTEMS Alternative names: GENESEE CITY OF
(35) THE MCGREGOR COMPANY GENESEE RETAIL (2045 GENESEE-JULIAETTA ROAD in GENESEE, ID)
COMPLIANCE ACTIVITY (Tracking inspections of insecticide, fungicide, and rodenticide, and toxic substances) Alternative names: MCGREGOR CO GENESEE
MCGREGOR CO GENESEE (0.5 MI E OF MAIN ST in GENESEE, ID)
Conditionally Exempt Small Quantity Generators, less than 100 kg/month of hazardous waste (Resource Conservation and Recovery Act (tracking hazardous waste)) - notification Organizations: MCGREGOR CO. (CONTACT/OWNER)
Housing units lacking complete plumbing facilities: 4.2% Housing units lacking complete kitchen facilities: 4.1%
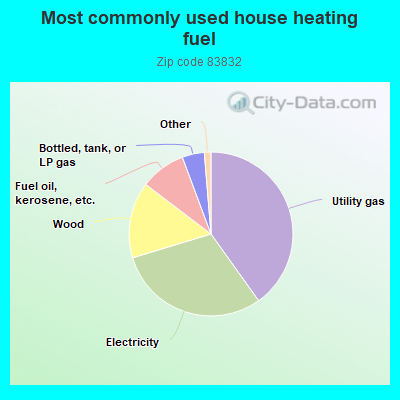
40.3%Utility gas
30.3%Electricity
15.1%Wood
9.0%Fuel oil, kerosene, etc.
4.4%Bottled, tank, or LP gas
0.7%Other fuel
0.7%No fuel used
Population in 1990: 1,241. Population change in the 1990s: +256 (+20.6%).
Place of birth for U.S.-born residents:
This state: 1,007
Northeast: 21
Midwest: 74
South: 52
West: 640
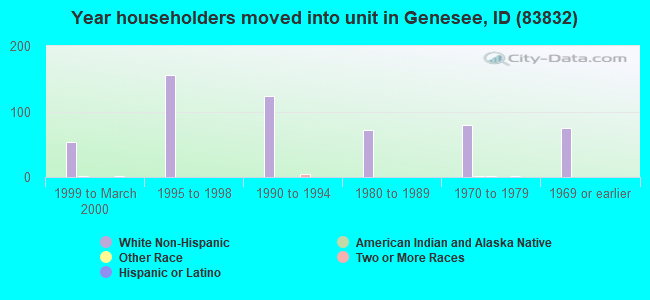
61% of the 83832 zip code residents lived in the same house 5 years ago. Out of people who lived in different houses, 45% lived in this county. Out of people who lived in different counties, 50% lived in Idaho.
92% of the 83832 zip code residents lived in the same house 1 year ago. Out of people who lived in different houses, 39% moved from this county. Out of people who lived in different houses, 42% moved from different county within same state. Out of people who lived in different houses, 25% moved from different state.
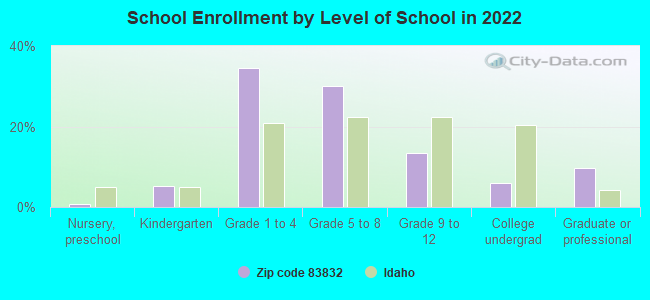
Private vs. public school enrollment:
Students in private schools in grades 1 to 8 (elementary and middle school): 13
Here:
5.7%
Idaho:
13.5%
Students in private schools in grades 9 to 12 (high school):
Here:
0.0%
Idaho:
8.5%
Students in private undergraduate colleges:
Here:
4.0%
Idaho:
30.0%
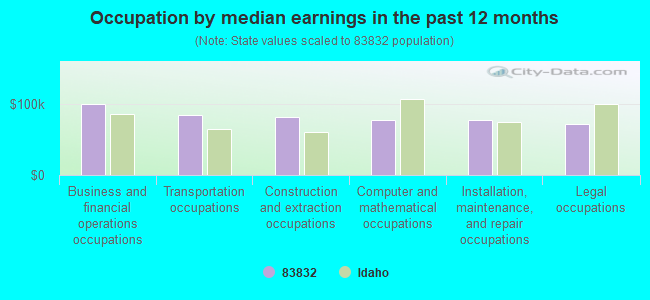
Occupation by median earnings in the past 12 months ($)
100,448Business and financial operations occupations
85,216Transportation occupations
82,515Construction and extraction occupations
78,159Computer and mathematical occupations
77,320Installation, maintenance, and repair occupations
71,580Legal occupations
Companies with federal contracts located in this zip code:
GENESEE UNION WAREHOUSE CO INC (117 W CHESTNUT ST in GENESEE, ID; small business) 20 employees, $18607461 revenue. : $3,229,319 in 18 contractsfrom 1999 to 2003
Contracts for Fruits and Vegetables by Farm Service Agency, Agricultural Stabilization and Conservation Service (disused code) Signed by year:2000: $309,000; 2001: $590,000; 2002: $398,000; 2003: $1,600,319; 2004: $0; 2005: $0; 2006: $0.
Biggest contracts:
$708,801 with Farm Service Agency for Fruits and Vegetables. Signed on 2003-05-15. Completion date: 2003-06-15.
$511,575, same as above.Signed on 2003-01-15. Completion date: 2003-02-15.
$366,000 with Agricultural Stabilization and Conservation Service (disused code) for Fruits and Vegetables. Signed on 2002-04-15. Completion date: 2002-05-15.
$261,000, same as above.Signed on 1999-12-15. Completion date: 2000-02-15.
Top industries in this zip code by the number of employees in 2005:
Wholesale Trade: Grain and Field Bean Merchant Wholesalers (10-19 employees: 1 establishment, 5-9 employees: 1 establishment)
Construction: Drywall and Insulation Contractors (5-9: 1, 1-4: 1)
Construction: Site Preparation Contractors (1-4: 2)
Professional, Scientific, and Technical Services: Surveying and Mapping (except Geophysical) Services (1-4: 1)
Other Services (except Public Administration): Commercial and Industrial Machinery and Equipment (except Automotive and Electronic) Repair and Maintenance (1-4: 1)
Finance and Insurance: Insurance Agencies and Brokerages (1-4: 1)
Fatal accident statistics in 2014:
Fatal accident count: 1
Vehicles involved in fatal accidents: 1
Fatal accidents caused by drunken drivers: 1
Fatalities: 1
Persons involved in fatal accidents: 2
Pedestrians involved in fatal accidents: 0
Fatal accident statistics in 2013:
Fatal accident count: 1
Vehicles involved in fatal accidents: 1
Fatal accidents caused by drunken drivers: 1
Fatalities: 1
Persons involved in fatal accidents: 1
Pedestrians involved in fatal accidents: 0
Home Mortgage Disclosure Act Aggregated Statistics For Year 2009 (Based on 2 partial tracts)
A) FHA, FSA/RHS & VA Home Purchase Loans
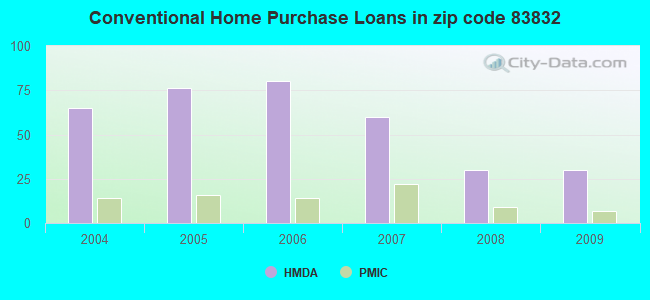
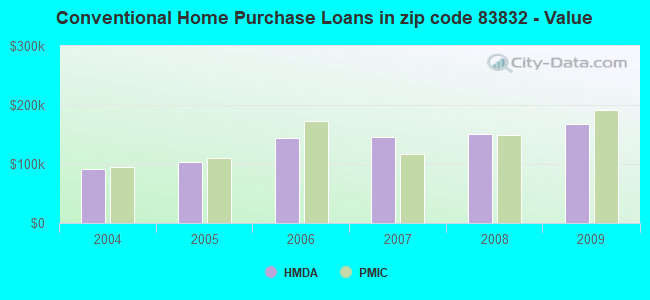
B) Conventional Home Purchase Loans
C) Refinancings
D) Home Improvement Loans
F) Non-occupant Loans on < 5 Family Dwellings (A B C & D)
G) Loans On Manufactured Home Dwelling (A B C & D)
Number
Average Value
Number
Average Value
Number
Average Value
Number
Average Value
Number
Average Value
Number
Average Value
LOANS ORIGINATED
16
$127,992
30
$167,277
118
$175,628
8
$123,304
9
$109,040
16
$148,205
APPLICATIONS APPROVED, NOT ACCEPTED
0
$0
2
$155,620
6
$124,360
2
$73,500
3
$90,567
0
$0
APPLICATIONS DENIED
0
$0
0
$0
31
$225,096
8
$75,275
5
$160,992
5
$138,282
APPLICATIONS WITHDRAWN
4
$167,785
2
$143,960
27
$221,647
2
$216,955
3
$128,077
2
$223,035
FILES CLOSED FOR INCOMPLETENESS
0
$0
0
$0
2
$185,525
0
$0
0
$0
0
$0
Aggregated Statistics For Year 2008 (Based on 2 partial tracts)
A) FHA, FSA/RHS & VA Home Purchase Loans
B) Conventional Home Purchase Loans
C) Refinancings
D) Home Improvement Loans
E) Loans on Dwellings For 5+ Families
F) Non-occupant Loans on < 5 Family Dwellings (A B C & D)
G) Loans On Manufactured Home Dwelling (A B C & D)
Number
Average Value
Number
Average Value
Number
Average Value
Number
Average Value
Number
Average Value
Number
Average Value
Number
Average Value
LOANS ORIGINATED
21
$138,746
30
$151,124
59
$161,263
7
$184,801
1
$126,730
10
$131,287
11
$149,028
APPLICATIONS APPROVED, NOT ACCEPTED
2
$112,025
6
$140,412
9
$197,579
3
$131,117
0
$0
1
$55,760
0
$0
APPLICATIONS DENIED
2
$122,670
9
$107,238
30
$161,566
10
$72,994
0
$0
8
$78,062
4
$98,338
APPLICATIONS WITHDRAWN
6
$137,202
1
$43,590
27
$217,930
2
$22,810
0
$0
2
$81,610
4
$112,785
FILES CLOSED FOR INCOMPLETENESS
0
$0
0
$0
2
$215,940
0
$0
0
$0
0
$0
1
$170,320
Aggregated Statistics For Year 2007 (Based on 2 partial tracts)
A) FHA, FSA/RHS & VA Home Purchase Loans
B) Conventional Home Purchase Loans
C) Refinancings
D) Home Improvement Loans
E) Loans on Dwellings For 5+ Families
F) Non-occupant Loans on < 5 Family Dwellings (A B C & D)
G) Loans On Manufactured Home Dwelling (A B C & D)
Number
Average Value
Number
Average Value
Number
Average Value
Number
Average Value
Number
Average Value
Number
Average Value
Number
Average Value
LOANS ORIGINATED
9
$98,001
60
$145,835
61
$155,527
6
$122,838
1
$86,170
20
$89,620
8
$139,905
APPLICATIONS APPROVED, NOT ACCEPTED
1
$122,670
8
$126,851
11
$136,310
2
$22,810
0
$0
2
$32,950
1
$101,380
APPLICATIONS DENIED
1
$122,670
20
$140,564
41
$141,685
11
$28,386
1
$202,760
10
$136,255
9
$66,234
APPLICATIONS WITHDRAWN
1
$125,710
7
$143,380
24
$131,118
0
$0
1
$177,410
5
$89,012
1
$127,740
FILES CLOSED FOR INCOMPLETENESS
0
$0
0
$0
6
$102,900
0
$0
0
$0
1
$18,250
0
$0
Aggregated Statistics For Year 2006 (Based on 2 partial tracts)
A) FHA, FSA/RHS & VA Home Purchase Loans
B) Conventional Home Purchase Loans
C) Refinancings
D) Home Improvement Loans
E) Loans on Dwellings For 5+ Families
F) Non-occupant Loans on < 5 Family Dwellings (A B C & D)
G) Loans On Manufactured Home Dwelling (A B C & D)
Number
Average Value
Number
Average Value
Number
Average Value
Number
Average Value
Number
Average Value
Number
Average Value
Number
Average Value
LOANS ORIGINATED
5
$130,374
80
$143,313
49
$124,718
12
$73,923
2
$115,575
24
$104,506
10
$118,817
APPLICATIONS APPROVED, NOT ACCEPTED
1
$126,730
16
$163,222
11
$124,145
1
$20,280
0
$0
4
$99,100
3
$116,250
APPLICATIONS DENIED
3
$97,323
13
$114,248
31
$90,261
9
$43,593
2
$124,695
8
$89,721
9
$67,587
APPLICATIONS WITHDRAWN
0
$0
14
$114,632
28
$125,096
5
$18,248
0
$0
6
$79,752
2
$125,710
FILES CLOSED FOR INCOMPLETENESS
0
$0
1
$35,480
6
$89,552
2
$48,155
0
$0
1
$35,480
0
$0
Aggregated Statistics For Year 2005 (Based on 2 partial tracts)
A) FHA, FSA/RHS & VA Home Purchase Loans
B) Conventional Home Purchase Loans
C) Refinancings
D) Home Improvement Loans
E) Loans on Dwellings For 5+ Families
F) Non-occupant Loans on < 5 Family Dwellings (A B C & D)
G) Loans On Manufactured Home Dwelling (A B C & D)
Number
Average Value
Number
Average Value
Number
Average Value
Number
Average Value
Number
Average Value
Number
Average Value
Number
Average Value
LOANS ORIGINATED
7
$109,490
76
$104,008
61
$99,834
9
$86,511
3
$350,437
21
$103,166
9
$100,253
APPLICATIONS APPROVED, NOT ACCEPTED
1
$159,170
13
$88,591
9
$78,851
2
$63,365
0
$0
5
$56,976
2
$108,475
APPLICATIONS DENIED
0
$0
18
$72,937
45
$89,237
17
$43,295
0
$0
11
$68,109
10
$92,864
APPLICATIONS WITHDRAWN
2
$119,120
15
$91,783
46
$101,645
6
$122,670
0
$0
7
$73,573
11
$90,965
FILES CLOSED FOR INCOMPLETENESS
0
$0
0
$0
20
$111,923
1
$50,690
0
$0
2
$84,650
3
$96,987
Aggregated Statistics For Year 2004 (Based on 2 partial tracts)
A) FHA, FSA/RHS & VA Home Purchase Loans
B) Conventional Home Purchase Loans
C) Refinancings
D) Home Improvement Loans
E) Loans on Dwellings For 5+ Families
F) Non-occupant Loans on < 5 Family Dwellings (A B C & D)
G) Loans On Manufactured Home Dwelling (A B C & D)


+$7,394
-$5,273
(% of AGI for various income ranges: 26.3% for AGIs below $10k, 3.9% for AGIs $25k-50k, 0.7% for AGIs $50k-75k, 2.3% for AGIs $75k-100k) Nearest zip codes: 83843, 83535, 83844, 99179, 83540, 83871.