Estimated zip code population in 2022: 1,079 Zip code population in 2010: 1,076 Zip code population in 2000: 1,100
Houses and condos: 683 Renter-occupied apartments: 50
% of renters here:
10%
State:
28%
March 2022 cost of living index in zip code 83541: 88.4 (less than average, U.S. average is 100)
Land area: 99.0 sq. mi. Water area: 4.1 sq. mi.
Population density: 11 people per square mile
(very low).
OSM Map
General Map
Google Map
MSN Map
OSM Map
General Map
Google Map
MSN Map
OSM Map
General Map
Google Map
MSN Map
OSM Map
General Map
Google Map
MSN Map
Please wait while loading the map...
Real estate property taxes paid for housing units in 2022:
This zip code:
0.5% ($1,694)
Idaho:
0.5% ($1,995)
Median real estate property taxes paid for housing units with mortgages in 2022: $1,676 (0.4%) Median real estate property taxes paid for housing units with no mortgage in 2022: $1,716 (0.7%)
Business Search- 14 Million verified businesses
Males: 578
(53.6%)
Females: 500
(46.4%)
For population 25 years and over in 83541:
High school or higher: 94.7%
Bachelor's degree or higher: 28.8%
Graduate or professional degree: 9.2%
Unemployed: 4.2%
Mean travel time to work (commute): 34.4 minutes
For population 15 years and over in 83541:
Never married: 14.5%
Now married: 63.1%
Separated: 0.8%
Widowed: 7.9%
Divorced: 13.8%
Zip code 83541 compared to state average:
Black race population percentage significantly below state average.
Hispanic race population percentage significantly below state average.
Median age significantly above state average.
Foreign-born population percentage significantly below state average.
Renting percentage significantly below state average.
Length of stay since moving in significantly above state average.
Estimated median house/condo value in 2022: $367,155
83541:
$367,155
Idaho:
$432,500
According to our research of Idaho and other state lists, there were 2 registered sex offenders living in 83541 zip code as of May 26, 2024. The ratio of all residents to sex offenders in zip code 83541 is 499 to 1. The ratio of registered sex offenders to all residents in this zip code is lower than the state average.
Median resident age:
This zip code:
59.8 years
Idaho median age:
37.5 years
Average household size:
This zip code:
2.1 people
Idaho:
2.6 people
Averages for the 2020 tax year for zip code 83541, filed in 2021:
Average Adjusted Gross Income (AGI) in 2020: $63,288 (Individual Income Tax Returns)
Here:
$63,288
State:
$73,627
Salary/wage: $53,006 (reported on 62.0% of returns)
Here:
$53,006
State:
$55,245
(% of AGI for various income ranges: 877.0% for AGIs below $25k, 3477.1% for AGIs $25k-50k, 5760.0% for AGIs $50k-75k, 7750.0% for AGIs $75k-100k, 19790.0% for AGIs $100k-200k)
Taxable interest for individuals: $1,322 (reported on 46.0% of returns)
This zip code:
$1,322
Idaho:
$2,230
(% of AGI for various income ranges: 26.0% for AGIs below $25k, 104.3% for AGIs $25k-50k, 32.0% for AGIs $50k-75k, 86.7% for AGIs $75k-100k, 407.5% for AGIs $100k-200k)
Ordinary dividends: $3,120 (reported on 20.0% of returns)
Here:
$3,120
State:
$7,088
(% of AGI for various income ranges: 72.0% for AGIs below $25k, 126.0% for AGIs $50k-75k, 442.5% for AGIs $100k-200k)
Net capital gain/loss in AGI: +$13,320 (reported on 20.0% of returns)
Here:
+$13,320
State:
+$37,284
(% of AGI for various income ranges: 97.0% for AGIs below $25k, 352.0% for AGIs $50k-75k, 2647.5% for AGIs $100k-200k)
Profit/loss from business: +$8,243 (reported on 14.0% of returns)
Here:
+$8,243
State:
+$12,955
(% of AGI for various income ranges: 109.0% for AGIs below $25k, 936.0% for AGIs $50k-75k)
Taxable individual retirement arrangement distribution: $15,575 (reported on 16.0% of returns)
83541:
$15,575
Idaho:
$20,110
(% of AGI for various income ranges: 900.0% for AGIs $25k-50k, 1540.0% for AGIs $100k-200k)
Total itemized deductions: $30,767 (reported on 6.0% of returns)
Here:
$30,767
State:
$38,402
(% of AGI for various income ranges: 3076.7% for AGIs $75k-100k)
Taxes paid: $6,067 (reported on 6.0% of returns)
83541:
$6,067
State:
$7,596
(% of AGI for various income ranges: 606.7% for AGIs $75k-100k)
Earned income credit: $2,100 (reported on 10.0% of returns)
Here:
$2,100
State:
$2,195
(% of AGI for various income ranges: 105.0% for AGIs below $25k)
Percentage of individuals using paid preparers for their 2020 taxes: 86.0%
Here:
86%
State:
94%
(% for various income ranges: 81.2% for AGIs below $25k, 83.3% for AGIs $25k-50k, 87.5% for AGIs $50k-75k, 80.0% for AGIs $75k-100k, 100.0% for AGIs $100k-200k)
Averages for the 2012 tax year for zip code 83541, filed in 2013:
Average Adjusted Gross Income (AGI) in 2012: $49,258 (Individual Income Tax Returns)
Here:
$49,258
State:
$52,536
Salary/wage: $41,900 (reported on 68.4% of returns)
Here:
$41,900
State:
$41,938
(% of AGI for various income ranges: 51.8% for AGIs below $25k, 56.0% for AGIs $25k-50k, 57.2% for AGIs $50k-75k, 65.4% for AGIs $75k-100k, 56.6% for AGIs $100k-200k)
Taxable interest for individuals: $1,530 (reported on 52.6% of returns)
This zip code:
$1,530
Idaho:
$1,874
(% of AGI for various income ranges: 5.2% for AGIs below $25k, 2.7% for AGIs $25k-50k, 0.5% for AGIs $50k-75k, 0.5% for AGIs $75k-100k, 1.6% for AGIs $100k-200k)
Ordinary dividends: $2,338 (reported on 21.1% of returns)
Here:
$2,338
State:
$5,706
(% of AGI for various income ranges: 3.5% for AGIs below $25k, 2.3% for AGIs $50k-75k, 1.0% for AGIs $75k-100k)
Net capital gain/loss in AGI: +$1,757 (reported on 18.4% of returns)
Here:
+$1,757
State:
+$14,571
Profit/loss from business: +$3,900 (reported on 13.2% of returns)
Here:
+$3,900
State:
+$10,113
Taxable individual retirement arrangement distribution: $9,667 (reported on 15.8% of returns)
83541:
$9,667
Idaho:
$14,642
Total itemized deductions: $18,575 (25% of AGI, reported on 31.6% of returns)
Here:
$18,575
State:
$22,697
Here:
24.7% of AGI
State:
22.0% of AGI
(% of AGI for various income ranges: 16.8% for AGIs $25k-50k, 12.1% for AGIs $50k-75k, 10.8% for AGIs $75k-100k, 12.6% for AGIs $100k-200k)
Charity contributions: $3,522 (reported on 23.7% of returns)
Here:
$3,522
State:
$5,246
(% of AGI for various income ranges: 2.8% for AGIs $25k-50k, 3.7% for AGIs $50k-75k, 1.3% for AGIs $100k-200k)
Taxes paid: $5,183 (reported on 31.6% of returns)
83541:
$5,183
State:
$7,139
(% of AGI for various income ranges: 2.7% for AGIs $25k-50k, 2.4% for AGIs $50k-75k, 3.3% for AGIs $75k-100k, 5.5% for AGIs $100k-200k)
Earned income credit: $1,620 (reported on 13.2% of returns)
Here:
$1,620
State:
$2,213
(% of AGI for various income ranges: 5.4% for AGIs below $25k)
Percentage of individuals using paid preparers for their 2012 taxes: 57.9%
Here:
58%
State:
52%
(% for various income ranges: 50.0% for AGIs below $25k, 70.0% for AGIs $25k-50k, 57.1% for AGIs $50k-75k, 60.0% for AGIs $75k-100k, 50.0% for AGIs $100k-200k)
Averages for the 2004 tax year for zip code 83541, filed in 2005:
Average Adjusted Gross Income (AGI) in 2004: $37,956 (Individual Income Tax Returns)
Here:
$37,956
State:
$42,679
Salary/wage: $31,093 (reported on 74.2% of returns)
Here:
$31,093
State:
$35,636
(% of AGI for various income ranges: 95.4% for AGIs below $10k, 61.7% for AGIs $10k-25k, 71.8% for AGIs $25k-50k, 64.6% for AGIs $50k-75k, 70.9% for AGIs $75k-100k, 36.9% for AGIs over 100k)
Taxable interest for individuals: $1,571 (reported on 56.2% of returns)
This zip code:
$1,571
Idaho:
$2,024
(% of AGI for various income ranges: 15.6% for AGIs below $10k, 3.4% for AGIs $10k-25k, 3.3% for AGIs $25k-50k, 0.9% for AGIs $50k-75k, 0.2% for AGIs $75k-100k, 2.0% for AGIs over 100k)
Taxable dividends: $1,235 (reported on 22.4% of returns)
Here:
$1,235
State:
$2,917
(% of AGI for various income ranges: 2.8% for AGIs $10k-25k, 0.2% for AGIs $25k-50k, 0.7% for AGIs $50k-75k, 0.8% for AGIs over 100k)
Net capital gain/loss: +$11,871 (reported on 25.8% of returns)
Here:
+$11,871
State:
+$13,146
(% of AGI for various income ranges: 2.3% for AGIs below $10k, 3.7% for AGIs $10k-25k, 3.4% for AGIs $25k-50k, 0.2% for AGIs $50k-75k, 26.1% for AGIs over 100k)
Profit/loss from business: +$2,692 (reported on 18.0% of returns)
Here:
+$2,692
State:
+$8,765
(% of AGI for various income ranges: -15.6% for AGIs below $10k, 7.2% for AGIs $10k-25k, 0.2% for AGIs $25k-50k, 3.9% for AGIs $50k-75k)
Total itemized deductions: $14,594 (23% of AGI, reported on 29.4% of returns)
Here:
$14,594
State:
$18,385
Here:
22.7% of AGI
State:
23.1% of AGI
(% of AGI for various income ranges: 17.8% for AGIs $10k-25k, 12.6% for AGIs $25k-50k, 6.4% for AGIs $50k-75k, 12.9% for AGIs $75k-100k, 10.2% for AGIs over 100k)
Charity contributions deductions: $2,105 (3% of AGI, reported on 21.1% of returns)
Here:
$2,105
State:
$3,875
Here:
3.0% of AGI
State:
4.6% of AGI
(% of AGI for various income ranges: 2.6% for AGIs $10k-25k, 1.0% for AGIs $25k-50k, 1.7% for AGIs $75k-100k, 1.2% for AGIs over 100k)
Total tax: $5,163 (reported on 73.1% of returns)
83541:
$5,163
State:
$6,282
(% of AGI for various income ranges: 2.9% for AGIs below $10k, 3.7% for AGIs $10k-25k, 6.0% for AGIs $25k-50k, 8.9% for AGIs $50k-75k, 10.8% for AGIs $75k-100k, 17.8% for AGIs over 100k)
Earned income credit: $1,765 (reported on 14.1% of returns)
Here:
$1,765
State:
$1,660
Percentage of individuals using paid preparers for their 2004 taxes: 68.1%
Here:
68%
State:
59%
(% for various income ranges: 60.3% for AGIs below $10k, 60.4% for AGIs $10k-25k, 74.7% for AGIs $25k-50k, 75.0% for AGIs $50k-75k, 74.1% for AGIs $75k-100k, 81.0% for AGIs over 100k)
Household received Food Stamps/SNAP in the past 12 months: 36 Household did not receive Food Stamps/SNAP in the past 12 months: 484
Women who had a birth in the past 12 months: 25 (23 now married, 0 unmarried) Women who did not have a birth in the past 12 months: 105 (51 now married, 53 unmarried)
Housing units in zip code 83541 with a mortgage: 160 (16 second mortgage, 12 both second mortgage and home equity loan) Median monthly owner costs for units with a mortgage: $1,674 Median monthly owner costs for units without a mortgage: $439
Residents with income below the poverty level in 2022:
This zip code:
15.1%
Whole state:
10.7%
Residents with income below 50% of the poverty level in 2022:
This zip code:
9.9%
Whole state:
6.1%
Median number of rooms in houses and condos:
Here:
6.4
State:
6.5
Median number of rooms in apartments:
Here:
5.4
State:
4.4
Notable locations in this zip code not listed on our city pages
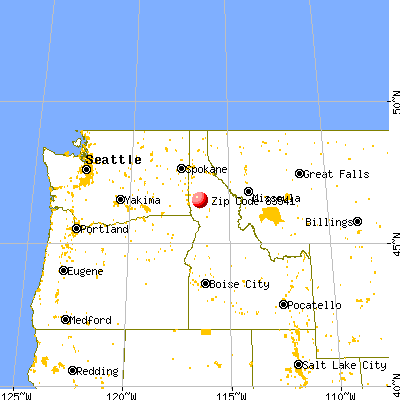
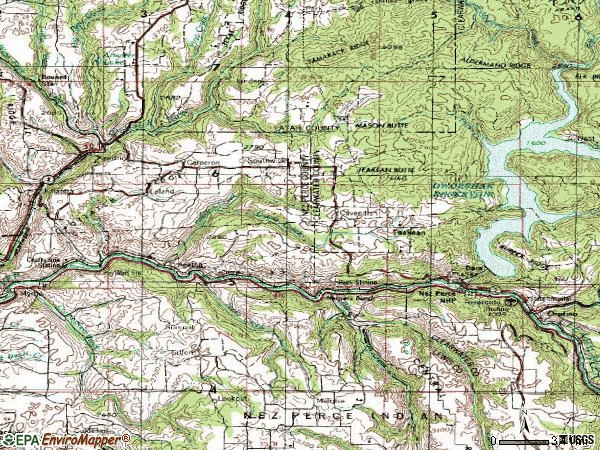
Notable locations in zip code 83541: United Brethren Camp (A), Summit (B), McGill Spur Access Area (C), Dolomite Siding (D), Fir Bluff Station (E), Sunnyside Rural Fire District (F), Evergreen Rural Fire District (G). Display/hide their locations on the map
Size of family households: 219 2-persons, 79 3-persons, 27 4-persons, 22 5-persons, 1 6-persons
Size of nonfamily households: 147 1-person, 14 2-persons, 3 3-persons
116 married couples with children.
14 single-parent households (2 men, 12 women).
97.4% of residents of 83541 zip code speak English at home.
2.5% of residents speak Spanish at home (100% very well).
1.1% of residents speak other language at home (100% well).
Foreign born population: 5 (0.5%) (100.0% of them are naturalized citizens)
This zip code:
0.5%
Whole state:
6.0%
100%Netherlands
18%Irish
18%English
15%German
13%Norwegian
7%European
3%Scottish
3%Finnish
Year of entry for the foreign-born population
02010 or later
02000 to 2009
01990 to 1999
4Before 1990
Facilities with environmental interests located in this zip code:
BRAMMER RANCHES (24282 BRAMMER RD. in LENORE, ID)
ENFORCEMENT/COMPLIANCE ACTIVITY (Integrated Compliance Information System) - ICIS-10-2004-0169, FORMAL ENFORCEMENT ACTION (Integrated Compliance Information System) - ICIS-10-2004-0169, FORMAL ENFORCEMENT ACTION
THUNDERBIRD SMOKE SHOP (34098 HWY 12 in LENORE, ID)
(Integrated Compliance Information System) - ICIS-10-2005-0120, ENFORCEMENT/COMPLIANCE ACTIVITY FORMAL ENFORCEMENT ACTION (Integrated Compliance Information System) - ICIS-10-2005-0120, ENFORCEMENT/COMPLIANCE ACTIVITY
CAVENDISH-TEAKEAN ELEMENTARY SCHOOL (4339 MIDDLE ROAD in LENORE, ID)
(Geographic Names Information System) (National Center for Education Statistics) - STATE ID-171 101 Organizations: OROFINO JOINT SCHOOL DISTRICT 171 (SCHOOL DISTRICT)
Alternative names: CAVENDISH-TEAKEAN ELEM SCHOOL
Housing units lacking complete plumbing facilities: 7.9% Housing units lacking complete kitchen facilities: 3.8%
45.1%Electricity
35.5%Wood
12.9%Bottled, tank, or LP gas
4.7%Fuel oil, kerosene, etc.
2.5%Utility gas
Population in 1990: 473. Population change in the 1990s: +627 (+132.6%).
Place of birth for U.S.-born residents:
This state: 337
Northeast: 22
Midwest: 61
South: 19
West: 646
69% of the 83541 zip code residents lived in the same house 5 years ago. Out of people who lived in different houses, 41% lived in this county. Out of people who lived in different counties, 50% lived in Idaho.
92% of the 83541 zip code residents lived in the same house 1 year ago. Out of people who lived in different houses, 56% moved from this county. Out of people who lived in different houses, 11% moved from different county within same state. Out of people who lived in different houses, 33% moved from different state.
Private vs. public school enrollment:
Students in private schools in grades 1 to 8 (elementary and middle school): 8
Here:
26.9%
Idaho:
13.5%
Students in private schools in grades 9 to 12 (high school):
Here:
0.0%
Idaho:
8.5%
Students in private undergraduate colleges:
Here:
0.0%
Idaho:
30.0%
Occupation by median earnings in the past 12 months ($)
78,576Health diagnosing and treating practitioners and other technical occupations
73,955Management occupations
51,805Transportation occupations
47,613Production occupations
41,870Sales and related occupations
39,732Community and social service occupations
Top industries in this zip code by the number of employees in 2005:
Arts, Entertainment, and Recreation: Golf Courses and Country Clubs (1-4 employees: 1 establishment)
Construction: Plumbing, Heating, and Air-Conditioning Contractors (1-4: 1)
Accommodation and Food Services: Mobile Food Services (1-4: 1)
Finance and Insurance: Investment Advice (1-4: 1)
Construction: Residential Remodelers (1-4: 1)
Fatal accident statistics in 2014:
Fatal accident count: 1
Vehicles involved in fatal accidents: 2
Fatal accidents caused by drunken drivers: 0
Fatalities: 1
Persons involved in fatal accidents: 4
Pedestrians involved in fatal accidents: 0
Fatal accident statistics in 2013:
Fatal accident count: 1
Vehicles involved in fatal accidents: 1
Fatal accidents caused by drunken drivers: 1
Fatalities: 1
Persons involved in fatal accidents: 1
Pedestrians involved in fatal accidents: 0
Home Mortgage Disclosure Act Aggregated Statistics For Year 2009 (Based on 2 partial tracts)
A) FHA, FSA/RHS & VA Home Purchase Loans
B) Conventional Home Purchase Loans
C) Refinancings
D) Home Improvement Loans
F) Non-occupant Loans on < 5 Family Dwellings (A B C & D)
G) Loans On Manufactured Home Dwelling (A B C & D)
Number
Average Value
Number
Average Value
Number
Average Value
Number
Average Value
Number
Average Value
Number
Average Value
LOANS ORIGINATED
5
$115,688
3
$168,710
23
$150,462
1
$48,200
1
$285,890
9
$134,867
APPLICATIONS APPROVED, NOT ACCEPTED
1
$58,970
0
$0
3
$137,090
0
$0
0
$0
1
$102,050
APPLICATIONS DENIED
2
$76,150
2
$240,120
7
$154,243
1
$117,690
0
$0
3
$95,210
APPLICATIONS WITHDRAWN
0
$0
0
$0
7
$170,946
1
$110,510
1
$138,710
2
$174,865
FILES CLOSED FOR INCOMPLETENESS
0
$0
0
$0
1
$119,230
0
$0
0
$0
0
$0
Aggregated Statistics For Year 2008 (Based on 2 partial tracts)
A) FHA, FSA/RHS & VA Home Purchase Loans
B) Conventional Home Purchase Loans
C) Refinancings
D) Home Improvement Loans
F) Non-occupant Loans on < 5 Family Dwellings (A B C & D)
G) Loans On Manufactured Home Dwelling (A B C & D)
Number
Average Value
Number
Average Value
Number
Average Value
Number
Average Value
Number
Average Value
Number
Average Value
LOANS ORIGINATED
3
$139,227
4
$177,430
9
$162,244
1
$94,610
1
$48,200
6
$167,302
APPLICATIONS APPROVED, NOT ACCEPTED
1
$70,510
0
$0
0
$0
0
$0
0
$0
0
$0
APPLICATIONS DENIED
2
$88,970
1
$128,970
5
$138,098
1
$91,020
0
$0
2
$137,945
APPLICATIONS WITHDRAWN
0
$0
1
$64,870
2
$74,610
1
$81,020
0
$0
2
$75,640
FILES CLOSED FOR INCOMPLETENESS
0
$0
0
$0
1
$73,070
0
$0
0
$0
0
$0
Aggregated Statistics For Year 2007 (Based on 2 partial tracts)
A) FHA, FSA/RHS & VA Home Purchase Loans
B) Conventional Home Purchase Loans
C) Refinancings
D) Home Improvement Loans
F) Non-occupant Loans on < 5 Family Dwellings (A B C & D)
G) Loans On Manufactured Home Dwelling (A B C & D)
Number
Average Value
Number
Average Value
Number
Average Value
Number
Average Value
Number
Average Value
Number
Average Value
LOANS ORIGINATED
3
$104,610
5
$137,380
7
$133,767
3
$48,547
1
$107,940
5
$122,456
APPLICATIONS APPROVED, NOT ACCEPTED
0
$0
1
$165,380
2
$132,430
0
$0
0
$0
0
$0
APPLICATIONS DENIED
1
$78,970
3
$89,483
6
$96,748
3
$41,623
0
$0
3
$76,833
APPLICATIONS WITHDRAWN
0
$0
1
$95,120
3
$101,363
0
$0
1
$81,540
0
$0
FILES CLOSED FOR INCOMPLETENESS
0
$0
0
$0
0
$0
0
$0
0
$0
0
$0
Aggregated Statistics For Year 2006 (Based on 2 partial tracts)
A) FHA, FSA/RHS & VA Home Purchase Loans
B) Conventional Home Purchase Loans
C) Refinancings
D) Home Improvement Loans
F) Non-occupant Loans on < 5 Family Dwellings (A B C & D)
G) Loans On Manufactured Home Dwelling (A B C & D)
Number
Average Value
Number
Average Value
Number
Average Value
Number
Average Value
Number
Average Value
Number
Average Value
LOANS ORIGINATED
4
$140,250
8
$136,052
8
$116,886
2
$30,770
1
$158,970
7
$131,790
APPLICATIONS APPROVED, NOT ACCEPTED
0
$0
2
$95,255
2
$106,280
2
$50,640
0
$0
1
$85,380
APPLICATIONS DENIED
0
$0
3
$66,150
10
$92,073
6
$62,988
1
$53,330
6
$91,322
APPLICATIONS WITHDRAWN
0
$0
1
$286,400
6
$110,978
1
$30,770
1
$227,940
1
$105,890
FILES CLOSED FOR INCOMPLETENESS
0
$0
0
$0
1
$140,510
1
$16,410
0
$0
0
$0
Aggregated Statistics For Year 2005 (Based on 2 partial tracts)
A) FHA, FSA/RHS & VA Home Purchase Loans
B) Conventional Home Purchase Loans
C) Refinancings
D) Home Improvement Loans
F) Non-occupant Loans on < 5 Family Dwellings (A B C & D)
G) Loans On Manufactured Home Dwelling (A B C & D)
Number
Average Value
Number
Average Value
Number
Average Value
Number
Average Value
Number
Average Value
Number
Average Value
LOANS ORIGINATED
4
$99,228
8
$120,028
8
$122,880
2
$90,765
3
$100,680
5
$108,662
APPLICATIONS APPROVED, NOT ACCEPTED
1
$41,280
2
$101,535
2
$144,610
0
$0
0
$0
1
$26,410
APPLICATIONS DENIED
0
$0
2
$82,690
11
$93,469
2
$37,435
0
$0
4
$89,932
APPLICATIONS WITHDRAWN
1
$28,720
3
$117,430
5
$129,636
1
$58,720
0
$0
1
$26,920
FILES CLOSED FOR INCOMPLETENESS
0
$0
1
$18,970
3
$103,243
0
$0
0
$0
1
$86,920
Aggregated Statistics For Year 2004 (Based on 2 partial tracts)
A) FHA, FSA/RHS & VA Home Purchase Loans
B) Conventional Home Purchase Loans
C) Refinancings
D) Home Improvement Loans
F) Non-occupant Loans on < 5 Family Dwellings (A B C & D)
G) Loans On Manufactured Home Dwelling (A B C & D)
Detailed PMIC statistics for the following Tracts:9901.00
2002 - 2018 National Fire Incident Reporting System (NFIRS) incidents
According to the data from the years 2002 - 2018 the average number of fires per year is 8. The highest number of fire incidents - 12 took place in 2004, and the least - 2 in 2016. The data has a growing trend.
When looking into fire subcategories, the most reports belonged to: Outside Fires (70.1%), and Structure Fires (21.6%).
Fire incident types reported to NFIRS in Zip Code 83541


 Nearest zip codes: 83545, 83520, 83537, 83548, 83524, 83535.


 According to the data from the years 2002 - 2018 the average number of fires per year is 8. The highest number of fire incidents - 12 took place in 2004, and the least - 2 in 2016. The data has a growing trend.
 When looking into fire subcategories, the most reports belonged to: Outside Fires (70.1%), and Structure Fires (21.6%).