Estimated zip code population in 2022: 5,643 Zip code population in 2010: 5,405 Zip code population in 2000: 4,907
Houses and condos: 1,775 Renter-occupied apartments: 462
% of renters here:
28%
State:
28%
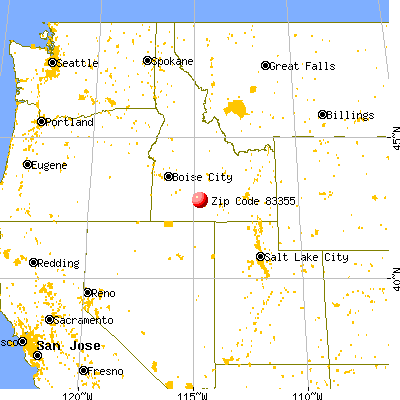
March 2022 cost of living index in zip code 83355: 86.8 (less than average, U.S. average is 100)
Land area: 114.9 sq. mi. Water area: 1.0 sq. mi.
Population density: 49 people per square mile
(very low).
OSM Map
General Map
Google Map
MSN Map
OSM Map
General Map
Google Map
MSN Map
OSM Map
General Map
Google Map
MSN Map
OSM Map
General Map
Google Map
MSN Map
Please wait while loading the map...
Real estate property taxes paid for housing units in 2022:
This zip code:
0.4% ($1,170)
Idaho:
0.5% ($1,995)
Median real estate property taxes paid for housing units with mortgages in 2022: $1,108 (0.4%) Median real estate property taxes paid for housing units with no mortgage in 2022: $1,292 (0.4%)
Estimated median house/condo value in 2022: $285,377
83355:
$285,377
Idaho:
$432,500
According to our research of Idaho and other state lists, there were 3 registered sex offenders living in 83355 zip code as of May 31, 2024. The ratio of all residents to sex offenders in zip code 83355 is 1,553 to 1. The ratio of registered sex offenders to all residents in this zip code is much lower than the state average.
Median resident age:
This zip code:
33.0 years
Idaho median age:
37.5 years
Average household size:
This zip code:
3.4 people
Idaho:
2.6 people
Averages for the 2020 tax year for zip code 83355, filed in 2021:
Average Adjusted Gross Income (AGI) in 2020: $48,543 (Individual Income Tax Returns)
Here:
$48,543
State:
$73,627
Salary/wage: $39,340 (reported on 88.4% of returns)
Here:
$39,340
State:
$55,245
(% of AGI for various income ranges: 1588.1% for AGIs below $25k, 4775.7% for AGIs $25k-50k, 7990.4% for AGIs $50k-75k, 11060.0% for AGIs $75k-100k, 17865.0% for AGIs $100k-200k)
Taxable interest for individuals: $1,456 (reported on 19.0% of returns)
This zip code:
$1,456
Idaho:
$2,230
(% of AGI for various income ranges: 14.5% for AGIs below $25k, 11.3% for AGIs $25k-50k, 18.8% for AGIs $50k-75k, 70.0% for AGIs $75k-100k, 246.7% for AGIs $100k-200k)
Ordinary dividends: $2,746 (reported on 6.0% of returns)
Here:
$2,746
State:
$7,088
(% of AGI for various income ranges: 1.9% for AGIs below $25k, 2.5% for AGIs $25k-50k, 13.8% for AGIs $50k-75k, 42.2% for AGIs $75k-100k, 440.0% for AGIs $100k-200k)
Net capital gain/loss in AGI: +$24,750 (reported on 8.3% of returns)
Here:
+$24,750
State:
+$37,284
(% of AGI for various income ranges: 12.3% for AGIs below $25k, 17.4% for AGIs $25k-50k, 87.9% for AGIs $50k-75k, 498.9% for AGIs $75k-100k, 6075.0% for AGIs $100k-200k)
Profit/loss from business: +$14,916 (reported on 11.6% of returns)
Here:
+$14,916
State:
+$12,955
(% of AGI for various income ranges: 54.9% for AGIs below $25k, 106.2% for AGIs $25k-50k, 297.1% for AGIs $50k-75k, 605.6% for AGIs $75k-100k, 2750.0% for AGIs $100k-200k)
Taxable individual retirement arrangement distribution: $8,567 (reported on 4.2% of returns)
83355:
$8,567
Idaho:
$20,110
(% of AGI for various income ranges: 27.0% for AGIs below $25k, 63.6% for AGIs $25k-50k, 341.1% for AGIs $75k-100k)
Total itemized deductions: $45,633 (reported on 1.4% of returns)
Here:
$45,633
State:
$38,402
(% of AGI for various income ranges: 1521.1% for AGIs $75k-100k)
Charity contributions: $18,900 (reported on 1.4% of returns)
Here:
$18,900
State:
$18,314
(% of AGI for various income ranges: 236.2% for AGIs $50k-75k)
Taxes paid: $6,900 (reported on 1.4% of returns)
83355:
$6,900
State:
$7,596
(% of AGI for various income ranges: 230.0% for AGIs $75k-100k)
Earned income credit: $2,516 (reported on 20.4% of returns)
Here:
$2,516
State:
$2,195
(% of AGI for various income ranges: 133.4% for AGIs below $25k, 87.9% for AGIs $25k-50k, 5.8% for AGIs $50k-75k)
Percentage of individuals using paid preparers for their 2020 taxes: 91.7%
Here:
92%
State:
94%
(% for various income ranges: 90.0% for AGIs below $25k, 90.9% for AGIs $25k-50k, 92.1% for AGIs $50k-75k, 93.3% for AGIs $75k-100k, 100.0% for AGIs $100k-200k, 100.0% for AGIs over 200k)
Averages for the 2012 tax year for zip code 83355, filed in 2013:
Average Adjusted Gross Income (AGI) in 2012: $41,278 (Individual Income Tax Returns)
Here:
$41,278
State:
$52,536
Salary/wage: $32,867 (reported on 87.6% of returns)
Here:
$32,867
State:
$41,938
(% of AGI for various income ranges: 81.1% for AGIs below $25k, 90.0% for AGIs $25k-50k, 83.0% for AGIs $50k-75k, 72.4% for AGIs $75k-100k, 81.6% for AGIs $100k-200k)
Taxable interest for individuals: $1,240 (reported on 20.0% of returns)
This zip code:
$1,240
Idaho:
$1,874
(% of AGI for various income ranges: 0.8% for AGIs below $25k, 0.3% for AGIs $25k-50k, 0.5% for AGIs $50k-75k, 0.2% for AGIs $75k-100k, 1.1% for AGIs $100k-200k, 1.1% for AGIs over 200k)
Ordinary dividends: $1,756 (reported on 7.6% of returns)
Here:
$1,756
State:
$5,706
(% of AGI for various income ranges: 0.4% for AGIs below $25k, 0.2% for AGIs $25k-50k, 0.3% for AGIs $50k-75k, 1.3% for AGIs $100k-200k)
Net capital gain/loss in AGI: +$21,012 (reported on 7.6% of returns)
Here:
+$21,012
State:
+$14,571
(% of AGI for various income ranges: 1.1% for AGIs below $25k, 0.6% for AGIs $25k-50k, 0.5% for AGIs $50k-75k, 0.4% for AGIs $75k-100k, 32.3% for AGIs $100k-200k)
Profit/loss from business: +$11,274 (reported on 11.0% of returns)
Here:
+$11,274
State:
+$10,113
(% of AGI for various income ranges: 5.7% for AGIs below $25k, 2.1% for AGIs $25k-50k, 4.7% for AGIs $50k-75k, 7.0% for AGIs $100k-200k)
Taxable individual retirement arrangement distribution: $5,575 (reported on 5.7% of returns)
83355:
$5,575
Idaho:
$14,642
(% of AGI for various income ranges: 1.9% for AGIs below $25k, 1.1% for AGIs $25k-50k, 1.5% for AGIs $75k-100k)
Total itemized deductions: $20,394 (20% of AGI, reported on 14.8% of returns)
Here:
$20,394
State:
$22,697
Here:
19.6% of AGI
State:
22.0% of AGI
(% of AGI for various income ranges: 4.4% for AGIs below $25k, 4.5% for AGIs $25k-50k, 9.0% for AGIs $50k-75k, 11.9% for AGIs $75k-100k, 11.2% for AGIs $100k-200k, 7.7% for AGIs over 200k)
Charity contributions: $7,320 (reported on 9.5% of returns)
Here:
$7,320
State:
$5,246
(% of AGI for various income ranges: 0.5% for AGIs below $25k, 0.5% for AGIs $25k-50k, 1.3% for AGIs $50k-75k, 3.0% for AGIs $75k-100k, 8.8% for AGIs $100k-200k)
Taxes paid: $5,581 (reported on 14.8% of returns)
83355:
$5,581
State:
$7,139
(% of AGI for various income ranges: 0.5% for AGIs below $25k, 0.8% for AGIs $25k-50k, 1.7% for AGIs $50k-75k, 2.7% for AGIs $75k-100k, 4.0% for AGIs $100k-200k, 4.1% for AGIs over 200k)
Earned income credit: $2,267 (reported on 20.5% of returns)
Here:
$2,267
State:
$2,213
(% of AGI for various income ranges: 5.3% for AGIs below $25k, 1.4% for AGIs $25k-50k)
Percentage of individuals using paid preparers for their 2012 taxes: 63.8%
Here:
64%
State:
52%
(% for various income ranges: 57.0% for AGIs below $25k, 69.2% for AGIs $25k-50k, 61.5% for AGIs $50k-75k, 63.6% for AGIs $75k-100k, 85.7% for AGIs $100k-200k, 100.0% for AGIs over 200k)
Averages for the 2004 tax year for zip code 83355, filed in 2005:
Average Adjusted Gross Income (AGI) in 2004: $4,963 (Individual Income Tax Returns)
Here:
$4,963
State:
$42,679
Salary/wage: $26,413 (reported on 85.3% of returns)
Here:
$26,413
State:
$35,636
(% of AGI for various income ranges: 81.3% for AGIs $10k-25k, 84.6% for AGIs $25k-50k, 79.2% for AGIs $50k-75k, 60.5% for AGIs $75k-100k, 36.1% for AGIs over 100k)
Taxable interest for individuals: $1,575 (reported on 34.5% of returns)
This zip code:
$1,575
Idaho:
$2,024
(% of AGI for various income ranges: 1.8% for AGIs $10k-25k, 1.0% for AGIs $25k-50k, 1.8% for AGIs $50k-75k, 1.3% for AGIs $75k-100k, 0.9% for AGIs over 100k)
Taxable dividends: $1,004 (reported on 12.7% of returns)
Here:
$1,004
State:
$2,917
(% of AGI for various income ranges: 0.3% for AGIs $10k-25k, 0.4% for AGIs $25k-50k, 0.5% for AGIs $50k-75k, 0.4% for AGIs $75k-100k, 0.2% for AGIs over 100k)
Net capital gain/loss: +$15,270 (reported on 13.5% of returns)
Here:
+$15,270
State:
+$13,146
(% of AGI for various income ranges: 0.4% for AGIs $10k-25k, 2.4% for AGIs $25k-50k, 2.2% for AGIs $50k-75k, 3.2% for AGIs $75k-100k, 34.5% for AGIs over 100k)
Profit/loss from business: +$7,316 (reported on 13.9% of returns)
Here:
+$7,316
State:
+$8,765
(% of AGI for various income ranges: 4.1% for AGIs $10k-25k, 3.7% for AGIs $25k-50k, 3.8% for AGIs $50k-75k, 3.5% for AGIs $75k-100k)
Profit/loss from farming: +$1,401 (reported on 8.1% of returns)
Here:
+$1,401
State:
-$5,273
(% of AGI for various income ranges: 0.0% for AGIs $10k-25k, -0.7% for AGIs $25k-50k, -0.3% for AGIs $50k-75k, 9.8% for AGIs $75k-100k, -2.4% for AGIs over 100k)
IRA payment deduction: $3,293 (reported on 2.3% of returns)
83355:
$3,293
Idaho:
$3,020
Total itemized deductions: $14,424 (26% of AGI, reported on 17.0% of returns)
Here:
$14,424
State:
$18,385
Here:
25.6% of AGI
State:
23.1% of AGI
(% of AGI for various income ranges: 5.0% for AGIs $10k-25k, 6.6% for AGIs $25k-50k, 10.0% for AGIs $50k-75k, 14.0% for AGIs $75k-100k, 9.4% for AGIs over 100k)
Charity contributions deductions: $3,991 (7% of AGI, reported on 12.5% of returns)
Here:
$3,991
State:
$3,875
Here:
7.0% of AGI
State:
4.6% of AGI
(% of AGI for various income ranges: 0.9% for AGIs $10k-25k, 1.1% for AGIs $25k-50k, 2.2% for AGIs $50k-75k, 3.7% for AGIs $75k-100k, 2.2% for AGIs over 100k)
Total tax: $3,451 (reported on 62.5% of returns)
83355:
$3,451
State:
$6,282
(% of AGI for various income ranges: 3.4% for AGIs $10k-25k, 4.8% for AGIs $25k-50k, 8.0% for AGIs $50k-75k, 11.4% for AGIs $75k-100k, 15.9% for AGIs over 100k)
Earned income credit: $1,787 (reported on 22.8% of returns)
Here:
$1,787
State:
$1,660
Percentage of individuals using paid preparers for their 2004 taxes: 66.2%
Here:
66%
State:
59%
(% for various income ranges: 62.0% for AGIs below $10k, 61.8% for AGIs $10k-25k, 70.5% for AGIs $25k-50k, 68.4% for AGIs $50k-75k, 78.0% for AGIs $75k-100k, 85.0% for AGIs over 100k)
Household received Food Stamps/SNAP in the past 12 months: 180 Household did not receive Food Stamps/SNAP in the past 12 months: 1,476
Women who had a birth in the past 12 months: 164 (130 now married, 31 unmarried) Women who did not have a birth in the past 12 months: 992 (455 now married, 535 unmarried)
Housing units in zip code 83355 with a mortgage: 697 (51 second mortgage, 38 both second mortgage and home equity loan) Houses without a mortgage: 27
Median monthly owner costs for units with a mortgage: $1,209 Median monthly owner costs for units without a mortgage: $380
Residents with income below the poverty level in 2022:
This zip code:
14.7%
Whole state:
10.7%
Residents with income below 50% of the poverty level in 2022:
This zip code:
12.6%
Whole state:
6.1%
Median number of rooms in houses and condos:
Here:
5.7
State:
6.5
Median number of rooms in apartments:
Here:
4.5
State:
4.4
Notable locations in this zip code not listed on our city pages
Notable locations in zip code 83355: Niagara Springs Hatchery (A), West Point (B), Appleton Siding (C), Idaho Power Company Steelhead Trout Hatchery (D), Wendell Rural Fire District / Wendell City Fire Department (E). Display/hide their locations on the map
In group quarters: 12 (-1 institutionalized population)
Size of family households: 400 2-persons, 259 3-persons, 241 4-persons, 86 5-persons, 84 6-persons, 124 7-or-more-persons
Size of nonfamily households: 425 1-person, 49 2-persons
1,146 married couples with children.
198 single-parent households (115 men, 83 women).
56.7% of residents of 83355 zip code speak English at home.
43.0% of residents speak Spanish at home (68% very well, 10% well, 18% not well, 4% not at all).
0.5% of residents speak other Indo-European language at home (100% very well).
0.2% of residents speak Asian or Pacific Island language at home (100% well).
Foreign born population: 1,150 (20.4%) (16.6% of them are naturalized citizens)
This zip code:
20.4%
Whole state:
6.0%
94%Honduras
1%Taiwan
1%Italy
0%Bolivia
5%American
3%Dutch
3%German
3%English
2%European
1%Scandinavian
1%Irish
Year of entry for the foreign-born population
2462010 or later
3592000 to 2009
2081990 to 1999
304Before 1990
Major facilities with environmental interests located in this zip code:
HILLIS DAIRY (3356 SOUTH 1800 EAST in WENDELL, ID)
(Integrated Compliance Information System) - ICIS-10-1993-0162, FORMAL ENFORCEMENT ACTION National Pollutant Discharge Elimination System NON-MAJOR (Tracking pollutant discharge elimination systems) - permit Business SIC classification: DAIRY FARMS Alternative names: HILLIS MERRILL DON & LINDA
HILLTOP DAIRY (3349 SOUTH 1500 EAST in WENDELL, ID)
(Integrated Compliance Information System) - ICIS-10-1995-0045, FORMAL ENFORCEMENT ACTION National Pollutant Discharge Elimination System NON-MAJOR (Tracking pollutant discharge elimination systems) - permit Business SIC classification: DAIRY FARMS Alternative names: DAN VANDERHAM
RIM VIEW TROUT FARM (2111A NIAGRA SPRINGS ROAD in WENDELL, ID)
ENFORCEMENT/COMPLIANCE ACTIVITY (Integrated Compliance Information System) National Pollutant Discharge Elimination System MAJOR (Tracking pollutant discharge elimination systems) - permit - ICIS-, ENFORCEMENT/COMPLIANCE ACTIVITY, Business SIC classification: FISH HATCHERIES AND PRESERVES Alternative names: CLEAR LAKES TROUT CO, RIM VIEW TROUT CO INC
National Pollutant Discharge Elimination System MAJOR (Tracking pollutant discharge elimination systems) - permit - ICIS-, ENFORCEMENT/COMPLIANCE ACTIVITY, Business SIC classification: FISH HATCHERIES AND PRESERVES Alternative names: CLEAR SPRINGS FOODS INC
FRED HARKES (1700 EAST 3400 SOUTH in WENDELL, ID)
(Integrated Compliance Information System) - ICIS-10-1994-0243, FORMAL ENFORCEMENT ACTION, ICIS-10-1994-0242, Business SIC classification: DAIRY FARMS
NIAGARA SPRINGS FISH HATCHERY (2131 NIAGARA SPRINGS ROAD in WENDELL, ID)
National Pollutant Discharge Elimination System MAJOR (Tracking pollutant discharge elimination systems) - permit - ICIS-, ENFORCEMENT/COMPLIANCE ACTIVITY Business SIC classification: FISH HATCHERIES AND PRESERVES Alternative names: IDAHO POWER CO
SOUTHFIELD DAIRY (1600 EAST 3308 SOUTH in WENDELL, ID)
National Pollutant Discharge Elimination System NON-MAJOR (Tracking pollutant discharge elimination systems) - permit Business SIC classification: DAIRY FARMS
AARDEMA DAIRY #2 (2182 EAST 3600 SOUTH in WENDELL, ID)
National Pollutant Discharge Elimination System NON-MAJOR (Tracking pollutant discharge elimination systems) - permit Business SIC classification: DAIRY FARMS
AARDEMA DAIRY #5 (2175 EAST 3600 SOUTH in WENDELL, ID)
National Pollutant Discharge Elimination System NON-MAJOR (Tracking pollutant discharge elimination systems) - permit Business SIC classification: DAIRY FARMS
AARDEMA HEIFER RANCH (2050 EAST 3600 SOUTH in WENDELL, ID)
National Pollutant Discharge Elimination System NON-MAJOR (Tracking pollutant discharge elimination systems) - permit Business SIC classification: DAIRY FARMS
BETTENCOURT DAIRY #1 (2860 SOUTH 2300 EAST in WENDELL, ID)
National Pollutant Discharge Elimination System NON-MAJOR (Tracking pollutant discharge elimination systems) - permit Business SIC classification: DAIRY FARMS
BRANDSMA DAIRY (2250 EAST 3200 SOUTH in WENDELL, ID)
National Pollutant Discharge Elimination System NON-MAJOR (Tracking pollutant discharge elimination systems) - permit Business SIC classification: DAIRY FARMS
CIOCCA DAIRY (1648 E 2900 S in WENDELL, ID)
National Pollutant Discharge Elimination System NON-MAJOR (Tracking pollutant discharge elimination systems) - permit Business SIC classification: DAIRY FARMS
Housing units lacking complete plumbing facilities: 3.2% Housing units lacking complete kitchen facilities: 5.2%
59.7%Electricity
22.5%Utility gas
10.1%Wood
4.3%Fuel oil, kerosene, etc.
2.4%Bottled, tank, or LP gas
0.9%No fuel used
Population in 1990: 4,400. Population change in the 1990s: +507 (+11.5%).
Place of birth for U.S.-born residents:
This state: 3,198
Northeast: 45
Midwest: 87
South: 36
West: 1,083
53% of the 83355 zip code residents lived in the same house 5 years ago. Out of people who lived in different houses, 46% lived in this county. Out of people who lived in different counties, 50% lived in Idaho.
95% of the 83355 zip code residents lived in the same house 1 year ago. Out of people who lived in different houses, 69% moved from this county. Out of people who lived in different houses, 4% moved from different county within same state. Out of people who lived in different houses, 37% moved from different state.
Private vs. public school enrollment:
Students in private schools in grades 1 to 8 (elementary and middle school): 31
Here:
4.5%
Idaho:
13.5%
Students in private schools in grades 9 to 12 (high school): 10
Here:
2.8%
Idaho:
8.5%
Students in private undergraduate colleges: 11
Here:
5.8%
Idaho:
30.0%
Occupation by median earnings in the past 12 months ($)
67,032Health diagnosing and treating practitioners and other technical occupations
51,616Management occupations
42,963Sales and related occupations
41,923Education, training, and library occupations
39,457Installation, maintenance, and repair occupations
36,388Health technologists and technicians
Companies with federal contracts located in this zip code:
SUN HEALTHCARE GROUP INC (N IDAHO ST in WENDELL, ID) : $65,000 in 6 contractsfrom 1999 to 2000
Contracts for Nursing Home Care Contracts by Department of Veterans Affairs Signed by year:2000: $55,000; 2001: $0; 2002: $0; 2003: $0; 2004: $0; 2005: $0; 2006: $0.
Biggest contracts:
$22,000 with Department of Veterans Affairs for Nursing Home Care Contracts. Signed on 2000-01-15. Completion date: 2000-09-15.
$12,000, same as above.Signed on 2000-09-15. Completion date: 2000-09-15.
$12,000, same as above.Signed on 2000-04-15. Completion date: 2000-09-15.
$10,000, same as above.Signed on 1999-10-15. Completion date: 2000-10-15.
Top industries in this zip code by the number of employees in 2005:
Finance and Insurance: Commercial Banking (10-19: 1, 5-9: 1)
People in group quarters in 2010:
9 people in group homes intended for adults
8 people in group homes for juveniles (non-correctional)
People in group quarters in 2000:
30 people in nursing homes
15 people in homes for the mentally retarded
Fatal accident statistics in 2014:
Fatal accident count: 2
Vehicles involved in fatal accidents: 3
Fatal accidents caused by drunken drivers: 1
Fatalities: 2
Persons involved in fatal accidents: 5
Pedestrians involved in fatal accidents: 0
Fatal accident statistics in 2013:
Fatal accident count: 6
Vehicles involved in fatal accidents: 7
Fatal accidents caused by drunken drivers: 1
Fatalities: 6
Persons involved in fatal accidents: 10
Pedestrians involved in fatal accidents: 0
2002 - 2018 National Fire Incident Reporting System (NFIRS) incidents
According to the data from the years 2002 - 2018 the average number of fire incidents per year is 71. The highest number of fire incidents - 103 took place in 2003, and the least - 41 in 2018. The data has a dropping trend.
When looking into fire subcategories, the most incidents belonged to: Outside Fires (64.3%), and Mobile Property/Vehicle Fires (18.7%).
Fire incident types reported to NFIRS in Zip Code 83355


+$1,401
-$5,273
(% of AGI for various income ranges: 0.0% for AGIs $10k-25k, -0.7% for AGIs $25k-50k, -0.3% for AGIs $50k-75k, 9.8% for AGIs $75k-100k, -2.4% for AGIs over 100k)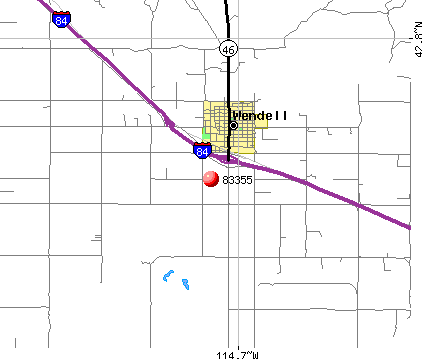 Nearest zip codes: 83330, 83332, 83328, 83316, 83338, 83314.


 According to the data from the years 2002 - 2018 the average number of fire incidents per year is 71. The highest number of fire incidents - 103 took place in 2003, and the least - 41 in 2018. The data has a dropping trend.
 When looking into fire subcategories, the most incidents belonged to: Outside Fires (64.3%), and Mobile Property/Vehicle Fires (18.7%).