Estimated zip code population in 2022: 10,262 Zip code population in 2010: 9,258 Zip code population in 2000: 8,348
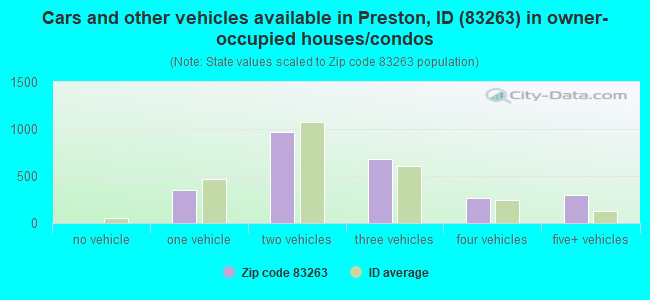
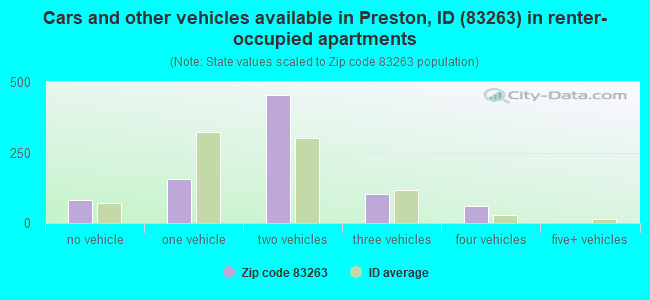
Houses and condos: 3,743 Renter-occupied apartments: 847
% of renters here:
25%
State:
28%
March 2022 cost of living index in zip code 83263: 87.6 (less than average, U.S. average is 100)
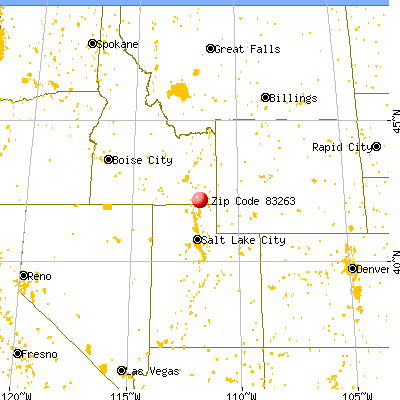
Land area: 401.3 sq. mi. Water area: 3.3 sq. mi.
Population density: 26 people per square mile
(very low).
OSM Map
General Map
Google Map
MSN Map
OSM Map
General Map
Google Map
MSN Map
OSM Map
General Map
Google Map
MSN Map
OSM Map
General Map
Google Map
MSN Map
Please wait while loading the map...
Real estate property taxes paid for housing units in 2022:
This zip code:
0.5% ($1,619)
Idaho:
0.5% ($1,995)
Median real estate property taxes paid for housing units with mortgages in 2022: $1,625 (0.4%) Median real estate property taxes paid for housing units with no mortgage in 2022: $1,634 (0.5%)
Business Search- 14 Million verified businesses
Males: 5,426
(52.9%)
Females: 4,835
(47.1%)
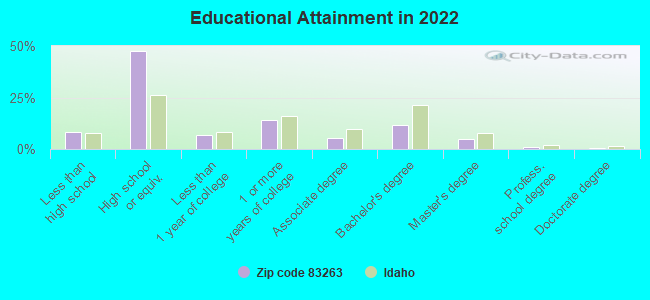
For population 25 years and over in 83263:
High school or higher: 90.5%
Bachelor's degree or higher: 17.9%
Graduate or professional degree: 6.3%
Unemployed: 0.8%
Mean travel time to work (commute): 25.6 minutes
For population 15 years and over in 83263:
Never married: 23.7%
Now married: 61.0%
Separated: 0.1%
Widowed: 6.1%
Divorced: 9.0%
Zip code 83263 compared to state average:
Unemployed percentage significantly below state average.
Black race population percentage significantly below state average.
Hispanic race population percentage below state average.
Foreign-born population percentage significantly below state average.
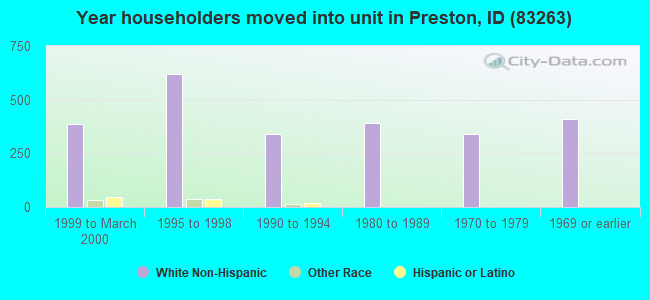
Length of stay since moving in significantly above state average.
House age above state average.
Number of college students below state average.
Percentage of population with a bachelor's degree or higher below state average.
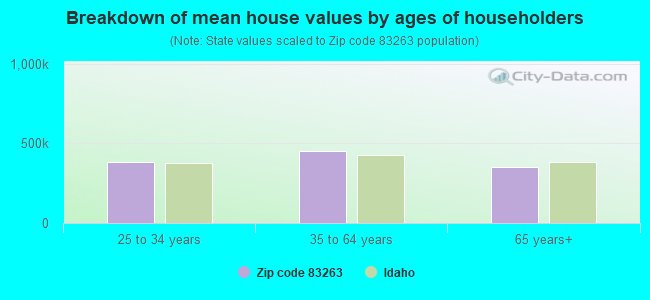
Estimated median house/condo value in 2022: $346,287
83263:
$346,287
Idaho:
$432,500
According to our research of Idaho and other state lists, there were 10 registered sex offenders living in 83263 zip code as of May 24, 2024. The ratio of all residents to sex offenders in zip code 83263 is 943 to 1. The ratio of registered sex offenders to all residents in this zip code is much lower than the state average.
Median resident age:
This zip code:
37.0 years
Idaho median age:
37.5 years
Average household size:
This zip code:
3.0 people
Idaho:
2.6 people
Averages for the 2020 tax year for zip code 83263, filed in 2021:
Average Adjusted Gross Income (AGI) in 2020: $59,358 (Individual Income Tax Returns)
Here:
$59,358
State:
$73,627
Salary/wage: $49,990 (reported on 83.0% of returns)
Here:
$49,990
State:
$55,245
(% of AGI for various income ranges: 1349.4% for AGIs below $25k, 3853.7% for AGIs $25k-50k, 6881.3% for AGIs $50k-75k, 10613.5% for AGIs $75k-100k, 17720.4% for AGIs $100k-200k, 47633.3% for AGIs over 200k)
Taxable interest for individuals: $1,689 (reported on 28.4% of returns)
This zip code:
$1,689
Idaho:
$2,230
(% of AGI for various income ranges: 25.1% for AGIs below $25k, 36.6% for AGIs $25k-50k, 36.2% for AGIs $50k-75k, 77.1% for AGIs $75k-100k, 131.4% for AGIs $100k-200k, 2403.3% for AGIs over 200k)
Ordinary dividends: $2,438 (reported on 13.0% of returns)
Here:
$2,438
State:
$7,088
(% of AGI for various income ranges: 13.6% for AGIs below $25k, 10.8% for AGIs $25k-50k, 45.3% for AGIs $50k-75k, 79.7% for AGIs $75k-100k, 137.1% for AGIs $100k-200k, 890.0% for AGIs over 200k)
Net capital gain/loss in AGI: +$22,700 (reported on 14.7% of returns)
Here:
+$22,700
State:
+$37,284
(% of AGI for various income ranges: 14.9% for AGIs below $25k, 50.9% for AGIs $25k-50k, 160.8% for AGIs $50k-75k, 355.2% for AGIs $75k-100k, 1099.3% for AGIs $100k-200k, 28370.0% for AGIs over 200k)
Profit/loss from business: +$5,746 (reported on 16.8% of returns)
Here:
+$5,746
State:
+$12,955
(% of AGI for various income ranges: 105.2% for AGIs below $25k, 154.7% for AGIs $25k-50k, 154.3% for AGIs $50k-75k, 224.5% for AGIs $75k-100k, 185.0% for AGIs $100k-200k)
Taxable individual retirement arrangement distribution: $18,069 (reported on 8.5% of returns)
83263:
$18,069
Idaho:
$20,110
(% of AGI for various income ranges: 91.4% for AGIs below $25k, 122.3% for AGIs $25k-50k, 158.1% for AGIs $50k-75k, 301.0% for AGIs $75k-100k, 1061.8% for AGIs $100k-200k)
Total itemized deductions: $34,506 (reported on 8.0% of returns)
Here:
$34,506
State:
$38,402
(% of AGI for various income ranges: 109.6% for AGIs $25k-50k, 205.5% for AGIs $50k-75k, 448.4% for AGIs $75k-100k, 1604.6% for AGIs $100k-200k, 12980.0% for AGIs over 200k)
Charity contributions: $19,277 (reported on 7.1% of returns)
Here:
$19,277
State:
$18,314
(% of AGI for various income ranges: 25.4% for AGIs $25k-50k, 67.0% for AGIs $50k-75k, 185.8% for AGIs $75k-100k, 718.9% for AGIs $100k-200k, 8793.3% for AGIs over 200k)
Taxes paid: $6,829 (reported on 8.0% of returns)
83263:
$6,829
State:
$7,596
(% of AGI for various income ranges: 15.1% for AGIs $25k-50k, 34.5% for AGIs $50k-75k, 77.4% for AGIs $75k-100k, 391.4% for AGIs $100k-200k, 2280.0% for AGIs over 200k)
Earned income credit: $2,367 (reported on 14.9% of returns)
Here:
$2,367
State:
$2,195
(% of AGI for various income ranges: 83.6% for AGIs below $25k, 92.5% for AGIs $25k-50k, 6.2% for AGIs $50k-75k)
Percentage of individuals using paid preparers for their 2020 taxes: 95.3%
Here:
95%
State:
94%
(% for various income ranges: 93.8% for AGIs below $25k, 95.2% for AGIs $25k-50k, 97.4% for AGIs $50k-75k, 94.0% for AGIs $75k-100k, 96.2% for AGIs $100k-200k, 100.0% for AGIs over 200k)
Averages for the 2012 tax year for zip code 83263, filed in 2013:
Average Adjusted Gross Income (AGI) in 2012: $44,249 (Individual Income Tax Returns)
Here:
$44,249
State:
$52,536
Salary/wage: $38,988 (reported on 85.7% of returns)
Here:
$38,988
State:
$41,938
(% of AGI for various income ranges: 77.0% for AGIs below $25k, 80.5% for AGIs $25k-50k, 81.3% for AGIs $50k-75k, 77.7% for AGIs $75k-100k, 67.8% for AGIs $100k-200k, 47.3% for AGIs over 200k)
Taxable interest for individuals: $1,167 (reported on 30.7% of returns)
This zip code:
$1,167
Idaho:
$1,874
(% of AGI for various income ranges: 1.4% for AGIs below $25k, 0.7% for AGIs $25k-50k, 0.8% for AGIs $50k-75k, 0.3% for AGIs $75k-100k, 1.2% for AGIs $100k-200k, 0.8% for AGIs over 200k)
Ordinary dividends: $1,979 (reported on 12.3% of returns)
Here:
$1,979
State:
$5,706
(% of AGI for various income ranges: 0.8% for AGIs below $25k, 0.3% for AGIs $25k-50k, 0.5% for AGIs $50k-75k, 0.4% for AGIs $75k-100k, 1.2% for AGIs $100k-200k)
Net capital gain/loss in AGI: +$8,584 (reported on 12.9% of returns)
Here:
+$8,584
State:
+$14,571
(% of AGI for various income ranges: 2.2% for AGIs below $25k, 1.5% for AGIs $25k-50k, 0.9% for AGIs $50k-75k, 1.7% for AGIs $75k-100k, 7.8% for AGIs $100k-200k)
Profit/loss from business: +$4,575 (reported on 17.8% of returns)
Here:
+$4,575
State:
+$10,113
(% of AGI for various income ranges: 5.9% for AGIs below $25k, 2.4% for AGIs $25k-50k, 0.3% for AGIs $50k-75k, 1.2% for AGIs $75k-100k, 2.0% for AGIs $100k-200k)
Taxable individual retirement arrangement distribution: $9,788 (reported on 9.4% of returns)
83263:
$9,788
Idaho:
$14,642
(% of AGI for various income ranges: 4.1% for AGIs below $25k, 2.5% for AGIs $25k-50k, 1.7% for AGIs $50k-75k, 1.8% for AGIs $75k-100k, 1.7% for AGIs $100k-200k)
Total itemized deductions: $20,155 (28% of AGI, reported on 33.3% of returns)
Here:
$20,155
State:
$22,697
Here:
27.7% of AGI
State:
22.0% of AGI
(% of AGI for various income ranges: 11.2% for AGIs below $25k, 12.3% for AGIs $25k-50k, 15.8% for AGIs $50k-75k, 16.1% for AGIs $75k-100k, 18.4% for AGIs $100k-200k, 18.7% for AGIs over 200k)
Charity contributions: $7,402 (reported on 29.2% of returns)
Here:
$7,402
State:
$5,246
(% of AGI for various income ranges: 2.2% for AGIs below $25k, 3.3% for AGIs $25k-50k, 4.7% for AGIs $50k-75k, 5.1% for AGIs $75k-100k, 7.2% for AGIs $100k-200k, 8.9% for AGIs over 200k)
Taxes paid: $4,492 (reported on 33.3% of returns)
83263:
$4,492
State:
$7,139
(% of AGI for various income ranges: 1.3% for AGIs below $25k, 2.1% for AGIs $25k-50k, 3.1% for AGIs $50k-75k, 4.0% for AGIs $75k-100k, 5.2% for AGIs $100k-200k, 5.6% for AGIs over 200k)
Earned income credit: $2,404 (reported on 21.1% of returns)
Here:
$2,404
State:
$2,213
(% of AGI for various income ranges: 6.5% for AGIs below $25k, 1.9% for AGIs $25k-50k)
Percentage of individuals using paid preparers for their 2012 taxes: 71.9%
Here:
72%
State:
52%
(% for various income ranges: 64.1% for AGIs below $25k, 74.0% for AGIs $25k-50k, 78.9% for AGIs $50k-75k, 76.5% for AGIs $75k-100k, 81.0% for AGIs $100k-200k, 100.0% for AGIs over 200k)
Averages for the 2004 tax year for zip code 83263, filed in 2005:
Average Adjusted Gross Income (AGI) in 2004: $34,734 (Individual Income Tax Returns)
Here:
$34,734
State:
$42,679
Salary/wage: $31,026 (reported on 85.5% of returns)
Here:
$31,026
State:
$35,636
(% of AGI for various income ranges: 112.3% for AGIs below $10k, 74.4% for AGIs $10k-25k, 82.2% for AGIs $25k-50k, 80.9% for AGIs $50k-75k, 71.8% for AGIs $75k-100k, 53.5% for AGIs over 100k)
Taxable interest for individuals: $1,659 (reported on 42.6% of returns)
This zip code:
$1,659
Idaho:
$2,024
(% of AGI for various income ranges: 5.2% for AGIs below $10k, 3.3% for AGIs $10k-25k, 1.7% for AGIs $25k-50k, 1.4% for AGIs $50k-75k, 1.0% for AGIs $75k-100k, 3.0% for AGIs over 100k)
Taxable dividends: $1,077 (reported on 15.9% of returns)
Here:
$1,077
State:
$2,917
(% of AGI for various income ranges: 1.1% for AGIs below $10k, 0.8% for AGIs $10k-25k, 0.5% for AGIs $25k-50k, 0.2% for AGIs $50k-75k, 0.6% for AGIs $75k-100k, 0.5% for AGIs over 100k)
Net capital gain/loss: +$9,424 (reported on 16.5% of returns)
Here:
+$9,424
State:
+$13,146
(% of AGI for various income ranges: -1.4% for AGIs below $10k, 2.4% for AGIs $10k-25k, 1.7% for AGIs $25k-50k, 3.1% for AGIs $50k-75k, 4.0% for AGIs $75k-100k, 16.7% for AGIs over 100k)
Profit/loss from business: +$4,150 (reported on 19.1% of returns)
Here:
+$4,150
State:
+$8,765
(% of AGI for various income ranges: 1.1% for AGIs below $10k, 6.6% for AGIs $10k-25k, 0.9% for AGIs $25k-50k, 1.3% for AGIs $50k-75k, 3.0% for AGIs $75k-100k, 3.1% for AGIs over 100k)
IRA payment deduction: $3,039 (reported on 2.5% of returns)
83263:
$3,039
Idaho:
$3,020
(% of AGI for various income ranges: 0.2% for AGIs $10k-25k, 0.3% for AGIs $25k-50k, 0.2% for AGIs $50k-75k, 0.4% for AGIs $75k-100k)
Total itemized deductions: $16,652 (30% of AGI, reported on 35.4% of returns)
Here:
$16,652
State:
$18,385
Here:
29.6% of AGI
State:
23.1% of AGI
(% of AGI for various income ranges: 13.5% for AGIs below $10k, 14.0% for AGIs $10k-25k, 15.9% for AGIs $25k-50k, 18.7% for AGIs $50k-75k, 20.3% for AGIs $75k-100k, 16.8% for AGIs over 100k)
Charity contributions deductions: $5,786 (10% of AGI, reported on 32.4% of returns)
Here:
$5,786
State:
$3,875
Here:
10.1% of AGI
State:
4.6% of AGI
(% of AGI for various income ranges: 1.4% for AGIs below $10k, 3.5% for AGIs $10k-25k, 4.6% for AGIs $25k-50k, 5.6% for AGIs $50k-75k, 8.0% for AGIs $75k-100k, 7.2% for AGIs over 100k)
Total tax: $3,283 (reported on 66.0% of returns)
83263:
$3,283
State:
$6,282
(% of AGI for various income ranges: 2.1% for AGIs below $10k, 3.7% for AGIs $10k-25k, 3.9% for AGIs $25k-50k, 5.6% for AGIs $50k-75k, 8.0% for AGIs $75k-100k, 14.5% for AGIs over 100k)
Earned income credit: $1,829 (reported on 17.7% of returns)
Here:
$1,829
State:
$1,660
Percentage of individuals using paid preparers for their 2004 taxes: 75.3%
Here:
75%
State:
59%
(% for various income ranges: 63.5% for AGIs below $10k, 74.5% for AGIs $10k-25k, 79.3% for AGIs $25k-50k, 83.1% for AGIs $50k-75k, 77.0% for AGIs $75k-100k, 77.4% for AGIs over 100k)
Household received Food Stamps/SNAP in the past 12 months: 350 Household did not receive Food Stamps/SNAP in the past 12 months: 3,087
Women who had a birth in the past 12 months: 94 (89 now married, 0 unmarried) Women who did not have a birth in the past 12 months: 2,034 (1,205 now married, 838 unmarried)
Housing units in zip code 83263 with a mortgage: 1,459 (85 second mortgage, 24 home equity loan, 62 both second mortgage and home equity loan) Houses without a mortgage: 27
Median monthly owner costs for units with a mortgage: $1,455 Median monthly owner costs for units without a mortgage: $442
Residents with income below the poverty level in 2022:
This zip code:
11.6%
Whole state:
10.7%
Residents with income below 50% of the poverty level in 2022:
This zip code:
5.2%
Whole state:
6.1%
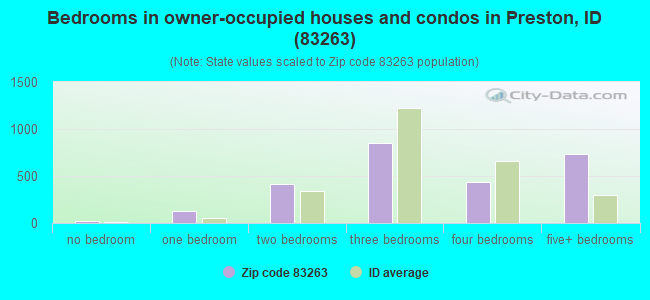
Median number of rooms in houses and condos:
Here:
7.2
State:
6.5
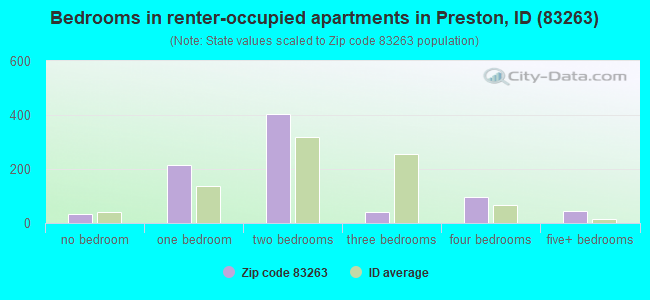
Median number of rooms in apartments:
Here:
4.0
State:
4.4
Notable locations in this zip code not listed on our city pages
Notable locations in zip code 83263: Camp Wilderness (A), Glendale Reservoir Access Area (B), Foster Reservoir Access Area (C), Beaver Creek Campground (D), Club River Guard Station (E), Hale Mine (F), Albert Moser Campground (G), Twin Lakes Access Area (H), Franklin County Fire Protection District (I). Display/hide their locations on the map
Cemeteries: Treasureton Cemetery (1), Cleveland Cemetery (2), Whitney Cemetery (3), Fairview Cemetery (4), Preston Cemetery (5). Display/hide their locations on the map
Lakes and reservoirs: Wiggler Lake (A), Blue Lake (B), Gibson Lakes (C), Hidden Lake (D), Horse Lake (E), Strong Arm Reservoir (F), Lamont Reservoir (G), Winder Reservoir (H). Display/hide their locations on the map
Creeks: Battle Creek (A), Carter Creek (B), Sant Creek (C), Birch Creek (D), Bear Creek (E), Mink Creek (F), Station Creek (G), Strawberry Creek (H), Sugar Creek (I). Display/hide their locations on the map
In group quarters: 75 (-1 institutionalized population)
Size of family households: 1,052 2-persons, 652 3-persons, 192 4-persons, 290 5-persons, 220 6-persons, 103 7-or-more-persons
Size of nonfamily households: 715 1-person, 197 2-persons
2,545 married couples with children.
305 single-parent households (102 men, 203 women).
94.9% of residents of 83263 zip code speak English at home.
3.4% of residents speak Spanish at home (90% very well, 10% well).
1.0% of residents speak other Indo-European language at home (100% very well).
0.2% of residents speak Asian or Pacific Island language at home (100% well).
0.3% of residents speak other language at home (100% very well).
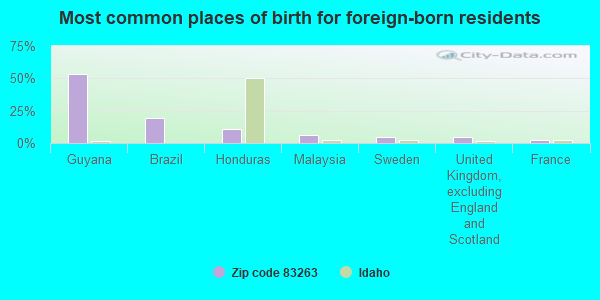
Foreign born population: 234 (2.3%) (84.2% of them are naturalized citizens)
This zip code:
2.3%
Whole state:
6.0%
53%Guyana
20%Brazil
11%Honduras
7%Malaysia
5%Sweden
5%United Kingdom, excluding England and Scotland
2%France
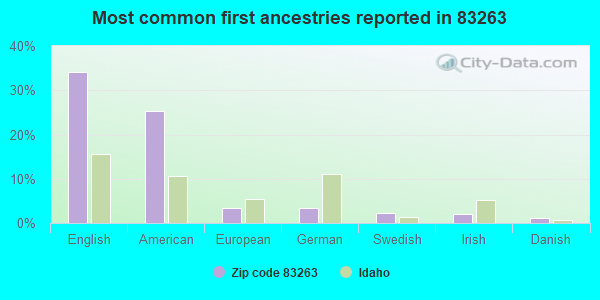
34%English
25%American
3%European
3%German
2%Swedish
2%Irish
1%Danish
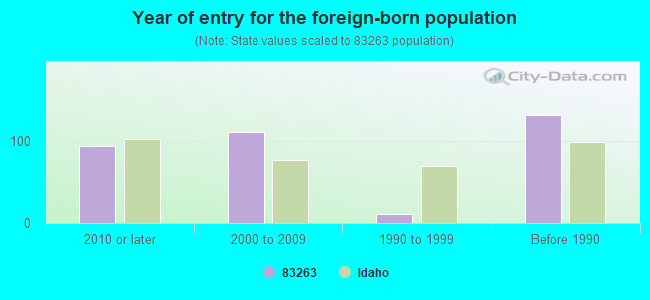
Year of entry for the foreign-born population
942010 or later
1102000 to 2009
111990 to 1999
131Before 1990
Major facilities with environmental interests located in this zip code:
OAKWOOD ELEMENTARY SCHOOL (525 SOUTH 4TH EAST in PRESTON, ID)
(Geographic Names Information System) (National Center for Education Statistics) - STATE ID-201 106 Organizations: PRESTON JOINT SCHOOL DISTRICT 201 (SCHOOL DISTRICT)
PIONEER ELEMENTARY SCHOOL (515 SOUTH 4TH EAST in PRESTON, ID)
(Geographic Names Information System) (National Center for Education Statistics) - STATE ID-201 116 Organizations: PRESTON JOINT SCHOOL DISTRICT 201 (SCHOOL DISTRICT)
PRESTON HIGH SCHOOL (151 EAST 2ND SOUTH in PRESTON, ID)
(Geographic Names Information System) (National Center for Education Statistics) - STATE ID-201 401 Organizations: PRESTON JOINT SCHOOL DISTRICT 201 (SCHOOL DISTRICT)
FRANKLIN COUNTY (ALT) HIGH (594 NORTH STATE in PRESTON, ID)
(National Center for Education Statistics) - STATE ID-201 491 Organizations: PRESTON JOINT SCHOOL DISTRICT 201 (SCHOOL DISTRICT)
PRESTON JR HIGH SCHOOL (450 EAST VALLEY VIEW DRIVE in PRESTON, ID)
(National Center for Education Statistics) - STATE ID-201 601 Organizations: PRESTON JOINT SCHOOL DISTRICT 201 (SCHOOL DISTRICT)
FRANKLIN GRAIN GRWS (264 S STATE in PRESTON, ID)
AIR MINOR (AIRS/AFS) Business SIC classification: GRAIN AND FIELD BEANS
ID AGRI FRANKLIN CO ROAD & BRIDGE (561 W ONEIDA ST in PRESTON, ID)
(Resource Conservation and Recovery Act (tracking hazardous waste)) Organizations: FRANKLIN COUNTY (CONTACT/OWNER)
GREEN LINE EQUIPMENT SALES (193 E 800 N in PRESTON, ID)
(Resource Conservation and Recovery Act (tracking hazardous waste))
RIVERDALE RESORT (3696 N 1600 E in PRESTON, ID)
National Pollutant Discharge Elimination System NON-MAJOR (Tracking pollutant discharge elimination systems) - permit Business SIC classification: MUSEUMS AND ART GALLERIES
TRAILS WEST MANUFACTURING (65 N 800 W in PRESTON, ID)
Conditionally Exempt Small Quantity Generators, less than 100 kg/month of hazardous waste (Resource Conservation and Recovery Act (tracking hazardous waste)) - notification Organizations: TRAILS WEST MFG OF IDAHO (CONTACT/OPERATOR)
, WEST WIND PROPERTIES (CONTACT/OWNER)
TREASURE CANYON CALCIUM (MILE 28-HWY 34 in PRESTON, ID)
AIR MINOR (AIRS/AFS) Business SIC classification: CRUSHED AND BROKEN LIMESTONE
HEAD MANUFACTURING INC (640 S HWY 91 in PRESTON, ID)
Conditionally Exempt Small Quantity Generators, less than 100 kg/month of hazardous waste (Resource Conservation and Recovery Act (tracking hazardous waste)) - notification Organizations: REX PITCHER (CONTACT/OWNER)
PRESTON CLEANERS (29 E ONEIDA in PRESTON, ID)
Conditionally Exempt Small Quantity Generators, less than 100 kg/month of hazardous waste (Resource Conservation and Recovery Act (tracking hazardous waste)) - notification Organizations: ZANE JENSEN (CONTACT/OWNER)
Housing units lacking complete plumbing facilities: 0.3% Housing units lacking complete kitchen facilities: 1.6%
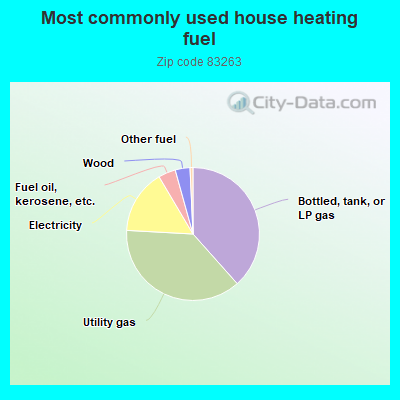
38.4%Bottled, tank, or LP gas
37.4%Utility gas
15.6%Electricity
4.2%Fuel oil, kerosene, etc.
3.6%Wood
0.7%Other fuel
Population in 1990: 5,402. Population change in the 1990s: +2,946 (+54.5%).
Place of birth for U.S.-born residents:
This state: 3,287
Northeast: 146
Midwest: 514
South: 349
West: 5,740
60% of the 83263 zip code residents lived in the same house 5 years ago. Out of people who lived in different houses, 51% lived in this county. Out of people who lived in different counties, 50% lived in Idaho.
92% of the 83263 zip code residents lived in the same house 1 year ago. Out of people who lived in different houses, 36% moved from this county. Out of people who lived in different houses, 30% moved from different county within same state. Out of people who lived in different houses, 39% moved from different state.
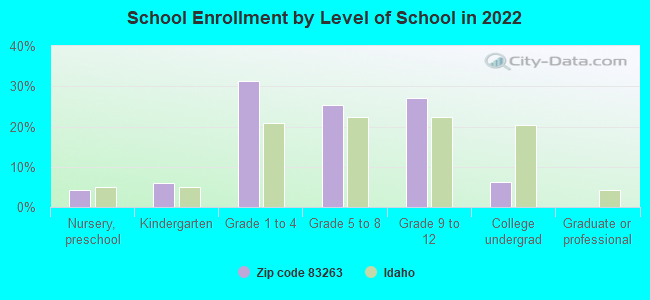
Private vs. public school enrollment:
Students in private schools in grades 1 to 8 (elementary and middle school): 37
Here:
2.4%
Idaho:
13.5%
Students in private schools in grades 9 to 12 (high school): 11
Here:
1.6%
Idaho:
8.5%
Students in private undergraduate colleges: 58
Here:
33.6%
Idaho:
30.0%
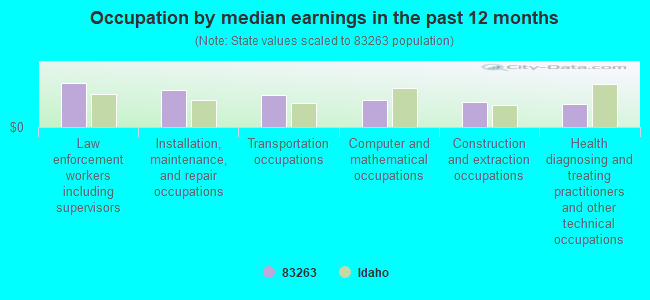
Occupation by median earnings in the past 12 months ($)
104,196Law enforcement workers including supervisors
87,510Installation, maintenance, and repair occupations
75,843Transportation occupations
64,597Computer and mathematical occupations
58,197Construction and extraction occupations
54,032Health diagnosing and treating practitioners and other technical occupations
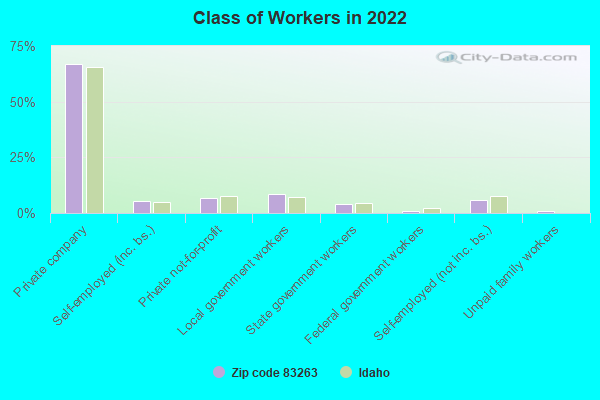
Top industries in this zip code by the number of employees in 2005:
Health Care and Social Assistance: General Medical and Surgical Hospitals (100-249 employees: 1 establishment)
Administrative and Support and Waste Management and Remediation Services: Convention and Visitors Bureaus (100-249: 1)
Health Care and Social Assistance: Offices of Dentists (10-19: 2, 5-9: 1, 1-4: 6)
People in group quarters in 2010:
78 people in nursing facilities/skilled-nursing facilities
10 people in residential treatment centers for adults
People in group quarters in 2000:
39 people in orthopedic wards and institutions for the physically handicapped
27 people in other group homes
10 people in local jails and other confinement facilities (including police lockups)
Fatal accident statistics in 2014:
Fatal accident count: 4
Vehicles involved in fatal accidents: 5
Fatal accidents caused by drunken drivers: 1
Fatalities: 4
Persons involved in fatal accidents: 8
Pedestrians involved in fatal accidents: 0
Fatal accident statistics in 2013:
Fatal accident count: 2
Vehicles involved in fatal accidents: 2
Fatal accidents caused by drunken drivers: 1
Fatalities: 2
Persons involved in fatal accidents: 2
Pedestrians involved in fatal accidents: 1
2002 - 2018 National Fire Incident Reporting System (NFIRS) incidents
According to the data from the years 2002 - 2018 the average number of fires per year is 30. The highest number of reported fire incidents - 44 took place in 2018, and the least - 15 in 2011. The data has a growing trend.
When looking into fire subcategories, the most reports belonged to: Outside Fires (48.0%), and Structure Fires (31.5%).
Fire incident types reported to NFIRS in Zip Code 83263


 Nearest zip codes: 83237, 83232, 83283, 84320, 83272, 83281.
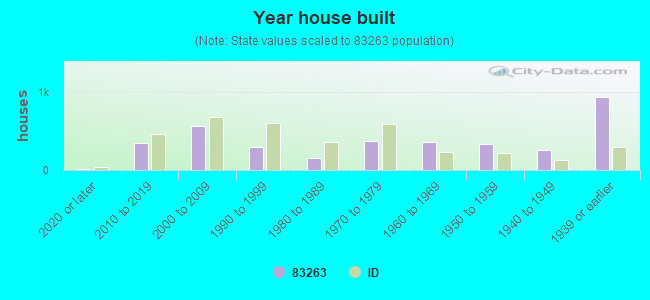


 According to the data from the years 2002 - 2018 the average number of fires per year is 30. The highest number of reported fire incidents - 44 took place in 2018, and the least - 15 in 2011. The data has a growing trend.
 When looking into fire subcategories, the most reports belonged to: Outside Fires (48.0%), and Structure Fires (31.5%).