Estimated zip code population in 2022: 1,113 Zip code population in 2010: 1,120 Zip code population in 2000: 1,078
Houses and condos: 578 Renter-occupied apartments: 93
% of renters here:
20%
State:
27%
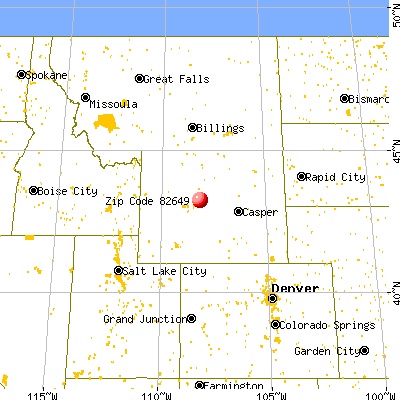
March 2022 cost of living index in zip code 82649: 80.3 (low, U.S. average is 100)
Land area: 604.6 sq. mi. Water area: 6.7 sq. mi.
Population density: 2 people per square mile
(very low).
OSM Map
General Map
Google Map
MSN Map
OSM Map
General Map
Google Map
MSN Map
OSM Map
General Map
Google Map
MSN Map
OSM Map
General Map
Google Map
MSN Map
Please wait while loading the map...
Real estate property taxes paid for housing units in 2022:
This zip code:
0.6% ($1,058)
Wyoming:
0.6% ($1,609)
Median real estate property taxes paid for housing units with mortgages in 2022: $1,399 (0.6%) Median real estate property taxes paid for housing units with no mortgage in 2022: $652 (0.8%)
Business Search- 14 Million verified businesses
Males: 604
(54.2%)
Females: 509
(45.8%)
For population 25 years and over in 82649:
High school or higher: 88.2%
Bachelor's degree or higher: 12.6%
Graduate or professional degree: 3.8%
Unemployed: 4.3%
Mean travel time to work (commute): 23.0 minutes
For population 15 years and over in 82649:
Never married: 22.4%
Now married: 51.1%
Separated: 2.3%
Widowed: 8.3%
Divorced: 15.9%
Zip code 82649 compared to state average:
Median house value below state average.
Black race population percentage significantly below state average.
Hispanic race population percentage below state average.
Foreign-born population percentage significantly below state average.
Length of stay since moving in significantly above state average.
Percentage of population with a bachelor's degree or higher significantly below state average.
Averages for the 2020 tax year for zip code 82649, filed in 2021:
Average Adjusted Gross Income (AGI) in 2020: $53,424 (Individual Income Tax Returns)
Here:
$53,424
State:
$93,756
Salary/wage: $44,419 (reported on 82.4% of returns)
Here:
$44,419
State:
$58,022
(% of AGI for various income ranges: 1374.2% for AGIs below $25k, 3323.3% for AGIs $25k-50k, 6246.7% for AGIs $50k-75k, 10420.0% for AGIs $75k-100k, 23806.7% for AGIs $100k-200k)
Taxable interest for individuals: $842 (reported on 23.5% of returns)
This zip code:
$842
Wyoming:
$3,185
(% of AGI for various income ranges: 8.3% for AGIs below $25k, 34.4% for AGIs $25k-50k, 25.0% for AGIs $50k-75k, 150.0% for AGIs $100k-200k)
Ordinary dividends: $3,843 (reported on 13.7% of returns)
Here:
$3,843
State:
$18,054
(% of AGI for various income ranges: 31.7% for AGIs below $25k, 35.0% for AGIs $50k-75k, 700.0% for AGIs $100k-200k)
Net capital gain/loss in AGI: +$7,700 (reported on 11.8% of returns)
Here:
+$7,700
State:
+$61,860
(% of AGI for various income ranges: 35.6% for AGIs $25k-50k, 1433.3% for AGIs $100k-200k)
Profit/loss from business: +$6,229 (reported on 13.7% of returns)
Here:
+$6,229
State:
+$12,816
(% of AGI for various income ranges: 204.2% for AGIs below $25k, 318.3% for AGIs $50k-75k)
Taxable individual retirement arrangement distribution: $10,750 (reported on 3.9% of returns)
82649:
$10,750
Wyoming:
$22,959
(% of AGI for various income ranges: 238.9% for AGIs $25k-50k)
Earned income credit: $2,600 (reported on 13.7% of returns)
Here:
$2,600
State:
$2,106
(% of AGI for various income ranges: 99.2% for AGIs below $25k, 70.0% for AGIs $25k-50k)
Percentage of individuals using paid preparers for their 2020 taxes: 90.2%
Here:
90%
State:
94%
(% for various income ranges: 94.4% for AGIs below $25k, 83.3% for AGIs $25k-50k, 88.9% for AGIs $50k-75k, 100.0% for AGIs $75k-100k, 85.7% for AGIs $100k-200k)
Averages for the 2012 tax year for zip code 82649, filed in 2013:
Average Adjusted Gross Income (AGI) in 2012: $50,222 (Individual Income Tax Returns)
Here:
$50,222
State:
$69,135
Salary/wage: $43,430 (reported on 89.8% of returns)
Here:
$43,430
State:
$48,877
(% of AGI for various income ranges: 74.5% for AGIs below $25k, 77.1% for AGIs $25k-50k, 83.4% for AGIs $50k-75k, 81.9% for AGIs $75k-100k, 73.9% for AGIs $100k-200k)
Taxable interest for individuals: $531 (reported on 26.5% of returns)
This zip code:
$531
Wyoming:
$3,063
(% of AGI for various income ranges: 0.2% for AGIs below $25k, 0.4% for AGIs $25k-50k, 0.3% for AGIs $50k-75k, 0.2% for AGIs $75k-100k, 0.3% for AGIs $100k-200k)
Ordinary dividends: $3,157 (reported on 14.3% of returns)
Here:
$3,157
State:
$14,293
Net capital gain/loss in AGI: +$8,517 (reported on 12.2% of returns)
Here:
+$8,517
State:
+$37,851
Profit/loss from business: +$8,783 (reported on 12.2% of returns)
Here:
+$8,783
State:
+$13,804
Total itemized deductions: $21,186 (25% of AGI, reported on 14.3% of returns)
Here:
$21,186
State:
$25,377
Here:
24.6% of AGI
State:
15.6% of AGI
(% of AGI for various income ranges: 10.7% for AGIs below $25k, 12.7% for AGIs $50k-75k, 6.9% for AGIs $100k-200k)
Charity contributions: $3,250 (reported on 4.1% of returns)
Here:
$3,250
State:
$7,424
Taxes paid: $3,300 (reported on 12.2% of returns)
82649:
$3,300
State:
$4,979
(% of AGI for various income ranges: 1.4% for AGIs below $25k, 1.3% for AGIs $50k-75k, 1.1% for AGIs $100k-200k)
Earned income credit: $1,767 (reported on 18.4% of returns)
Here:
$1,767
State:
$1,989
(% of AGI for various income ranges: 4.3% for AGIs below $25k, 1.2% for AGIs $25k-50k)
Percentage of individuals using paid preparers for their 2012 taxes: 59.2%
Here:
59%
State:
50%
(% for various income ranges: 45.0% for AGIs below $25k, 54.5% for AGIs $25k-50k, 71.4% for AGIs $50k-75k, 80.0% for AGIs $75k-100k, 83.3% for AGIs $100k-200k)
Averages for the 2004 tax year for zip code 82649, filed in 2005:
Average Adjusted Gross Income (AGI) in 2004: $34,533 (Individual Income Tax Returns)
Here:
$34,533
State:
$50,131
Salary/wage: $31,430 (reported on 81.8% of returns)
Here:
$31,430
State:
$37,659
(% of AGI for various income ranges: 178.2% for AGIs below $10k, 77.6% for AGIs $10k-25k, 74.0% for AGIs $25k-50k, 88.2% for AGIs $50k-75k, 88.3% for AGIs $75k-100k, 35.7% for AGIs over 100k)
Taxable interest for individuals: $677 (reported on 37.7% of returns)
This zip code:
$677
Wyoming:
$2,408
(% of AGI for various income ranges: 10.2% for AGIs below $10k, 1.3% for AGIs $10k-25k, 1.1% for AGIs $25k-50k, 0.2% for AGIs $50k-75k, 0.1% for AGIs $75k-100k, 0.2% for AGIs over 100k)
Taxable dividends: $812 (reported on 15.9% of returns)
Here:
$812
State:
$6,819
(% of AGI for various income ranges: 1.3% for AGIs below $10k, 0.7% for AGIs $10k-25k, 0.5% for AGIs $25k-50k, 0.3% for AGIs $50k-75k, 0.3% for AGIs $75k-100k)
Net capital gain/loss: +$8,321 (reported on 17.9% of returns)
Here:
+$8,321
State:
+$23,705
(% of AGI for various income ranges: 0.9% for AGIs below $10k, -0.4% for AGIs $10k-25k, 5.7% for AGIs $25k-50k, 0.3% for AGIs $50k-75k, 20.5% for AGIs $75k-100k)
Profit/loss from business: +$2,429 (reported on 14.5% of returns)
Here:
+$2,429
State:
+$10,523
(% of AGI for various income ranges: -5.3% for AGIs below $10k, 0.0% for AGIs $10k-25k, 4.6% for AGIs $25k-50k, -0.6% for AGIs $50k-75k)
Total itemized deductions: $16,085 (22% of AGI, reported on 10.8% of returns)
Here:
$16,085
State:
$18,912
Here:
22.3% of AGI
State:
17.8% of AGI
Charity contributions deductions: $1,870 (3% of AGI, reported on 5.3% of returns)
Here:
$1,870
State:
$5,489
Here:
2.7% of AGI
State:
4.7% of AGI
Total tax: $4,619 (reported on 74.3% of returns)
82649:
$4,619
State:
$8,551
(% of AGI for various income ranges: 6.2% for AGIs below $10k, 3.9% for AGIs $10k-25k, 7.5% for AGIs $25k-50k, 8.9% for AGIs $50k-75k, 10.7% for AGIs $75k-100k, 19.0% for AGIs over 100k)
Earned income credit: $1,597 (reported on 15.4% of returns)
Here:
$1,597
State:
$1,544
Percentage of individuals using paid preparers for their 2004 taxes: 59.1%
Here:
59%
State:
59%
(% for various income ranges: 50.5% for AGIs below $10k, 51.6% for AGIs $10k-25k, 68.8% for AGIs $25k-50k, 56.2% for AGIs $50k-75k, 66.7% for AGIs $75k-100k, 100.0% for AGIs over 100k)
Household received Food Stamps/SNAP in the past 12 months: 33 Household did not receive Food Stamps/SNAP in the past 12 months: 433
Women who had a birth in the past 12 months: 27 (20 now married, 6 unmarried) Women who did not have a birth in the past 12 months: 219 (84 now married, 135 unmarried)
Housing units in zip code 82649 with a mortgage: 148 (5 second mortgage, 3 both second mortgage and home equity loan) Houses without a mortgage: 3
Median monthly owner costs for units with a mortgage: $1,348 Median monthly owner costs for units without a mortgage: $388
Residents with income below the poverty level in 2022:
This zip code:
17.1%
Whole state:
11.8%
Residents with income below 50% of the poverty level in 2022:
This zip code:
6.6%
Whole state:
6.8%
Median number of rooms in houses and condos:
Here:
5.4
State:
6.7
Median number of rooms in apartments:
Here:
5.0
State:
4.4
Notable locations in this zip code not listed on our city pages
Reservoirs: Sand Mesa Number 1 Reservoir (A), Ocla Reservoir (B), Sand Mesa Number 2 Reservoir (C), Bonneville Reservoir (D), Dinty Moore Reservoir (E), Ocla Reservoir (F), Robinson Reservoir (G), Sheep Camp Reservoir (H). Display/hide their locations on the map
Creeks: Badwater Creek (A), Hoodoo Creek (B), Gold Creek (C), Stagner Creek (D), Dry Creek (E), Dry Cheyenne Creek (F), Boysen Creek (G), Birdseye Creek (H), Tough Creek (I). Display/hide their locations on the map
In group quarters: 4 (-1 institutionalized population)
Size of family households: 168 2-persons, 49 3-persons, 24 4-persons, 21 5-persons, 10 6-persons, 3 7-or-more-persons
Size of nonfamily households: 173 1-person, 13 2-persons
124 married couples with children.
55 single-parent households (3 men, 52 women).
98.2% of residents of 82649 zip code speak English at home.
0.9% of residents speak Spanish at home (44% very well, 44% well, 11% not well).
0.6% of residents speak other Indo-European language at home (100% very well).
Foreign born population: 2 (0.2%) (0.0% of them are naturalized citizens)
:
0.2%
Whole state:
3.1%
67%Honduras
28%German
11%Norwegian
8%American
5%English
4%Scottish
3%Scandinavian
3%Swedish
Year of entry for the foreign-born population
32010 or later
02000 to 2009
01990 to 1999
2Before 1990
Facilities with environmental interests located in this zip code:
DYCE CHEMICAL INC (2 MI EAST OF HWY 20 in SHOSHONI, WY)
(Resource Conservation and Recovery Act (tracking hazardous waste)) Organizations: NON NOTIFIER (CONTACT/OWNER)
BONNEVILLE SITE - BT, INCORPORATED (249 BONNEVILLE ROAD in SHOSHONI, WY)
National Pollutant Discharge Elimination System NON-MAJOR (Tracking pollutant discharge elimination systems) - permit Business SIC classification: LOCAL TRUCKING WITHOUT STORAGE Alternative names: THE BONNEVILLE SITE, BT, INC.
Housing units lacking complete plumbing facilities: 5.2% Housing units lacking complete kitchen facilities: 3.6%
52.7%Utility gas
26.1%Bottled, tank, or LP gas
13.4%Wood
7.4%Electricity
0.7%Fuel oil, kerosene, etc.
Population in 1990: 600. Population change in the 1990s: +478 (+79.7%).
Place of birth for U.S.-born residents:
This state: 591
Northeast: 31
Midwest: 133
South: 48
West: 306
61% of the 82649 zip code residents lived in the same house 5 years ago. Out of people who lived in different houses, 56% lived in this county. Out of people who lived in different counties, 50% lived in Wyoming.
89% of the 82649 zip code residents lived in the same house 1 year ago. Out of people who lived in different houses, 95% moved from this county. Out of people who lived in different houses, 1% moved from different state.
Private vs. public school enrollment:
Students in private schools in grades 1 to 8 (elementary and middle school): 8
Here:
12.4%
Wyoming:
7.3%
Students in private schools in grades 9 to 12 (high school): 2
Here:
4.0%
Wyoming:
6.0%
Students in private undergraduate colleges: 3
Here:
12.9%
Wyoming:
9.2%
Occupation by median earnings in the past 12 months ($)
87,800Health diagnosing and treating practitioners and other technical occupations
74,152Education, training, and library occupations
54,290Construction and extraction occupations
42,330Management occupations
40,121Sales and related occupations
37,219Transportation occupations
Top industries in this zip code by the number of employees in 2005:
Mining: Support Activities for Oil and Gas Operations (20-49 employees: 1 establishment, 5-9 employees: 1 establishment)
Utilities: Sewage Treatment Facilities (20-49: 1)
Accommodation and Food Services: Hotels (except Casino Hotels) and Motels (10-19: 1)
Health Care and Social Assistance: Services for the Elderly and Persons with Disabilities (5-9: 1)
Construction: Oil and Gas Pipeline and Related Structures Construction (5-9: 1)
Fatal accident statistics in 2012:
Fatal accident count: 3
Vehicles involved in fatal accidents: 3
Fatal accidents caused by drunken drivers: 2
Fatalities: 3
Persons involved in fatal accidents: 6
Pedestrians involved in fatal accidents: 0
Fatal accident statistics in 2011:
Fatal accident count: 3
Vehicles involved in fatal accidents: 4
Fatal accidents caused by drunken drivers: 0
Fatalities: 4
Persons involved in fatal accidents: 5
Pedestrians involved in fatal accidents: 0
2002 - 2018 National Fire Incident Reporting System (NFIRS) incidents
Based on the data from the years 2002 - 2018 the average number of fires per year is 11. The highest number of fires - 22 took place in 2002, and the least - 0 in 2004. The data has a decreasing trend.
When looking into fire subcategories, the most reports belonged to: Outside Fires (55.0%), and Structure Fires (15.9%).
Fire incident types reported to NFIRS in Zip Code 82649


 Nearest zip codes: 82501, 82642, 82430, 82443, 82510, 82515.


 Based on the data from the years 2002 - 2018 the average number of fires per year is 11. The highest number of fires - 22 took place in 2002, and the least - 0 in 2004. The data has a decreasing trend.
 When looking into fire subcategories, the most reports belonged to: Outside Fires (55.0%), and Structure Fires (15.9%).