Estimated zip code population in 2022: 709 Zip code population in 2010: 921 Zip code population in 2000: 957
Houses and condos: 625 Renter-occupied apartments: 105
% of renters here:
29%
State:
34%
March 2022 cost of living index in zip code 80819: 101.4 (near average, U.S. average is 100)
Land area: 8.3 sq. mi. Water area: 0.0 sq. mi.
Population density: 86 people per square mile
(very low).
OSM Map
General Map
Google Map
MSN Map
OSM Map
General Map
Google Map
MSN Map
OSM Map
General Map
Google Map
MSN Map
OSM Map
General Map
Google Map
MSN Map
Please wait while loading the map...
Real estate property taxes paid for housing units in 2022:
This zip code:
0.4% ($1,991)
Colorado:
0.5% ($2,422)
Median real estate property taxes paid for housing units with mortgages in 2022: $2,029 (0.4%) Median real estate property taxes paid for housing units with no mortgage in 2022: $1,839 (0.5%)
Business Search- 14 Million verified businesses
Males: 346
(48.9%)
Females: 362
(51.1%)
For population 25 years and over in 80819:
High school or higher: 97.7%
Bachelor's degree or higher: 58.4%
Graduate or professional degree: 28.5%
Unemployed: 0.2%
Mean travel time to work (commute): 21.4 minutes
For population 15 years and over in 80819:
Never married: 45.4%
Now married: 34.8%
Separated: 0.9%
Widowed: 3.7%
Divorced: 15.3%
Zip code 80819 compared to state average:
Unemployed percentage significantly below state average.
Black race population percentage significantly below state average.
Hispanic race population percentage significantly below state average.
Foreign-born population percentage significantly below state average.
Length of stay since moving in significantly above state average.
Number of rooms per house below state average.
House age significantly above state average.
Percentage of population with a bachelor's degree or higher above state average.
Averages for the 2004 tax year for zip code 80819, filed in 2005:
Average Adjusted Gross Income (AGI) in 2004: $38,036 (Individual Income Tax Returns)
Here:
$38,036
State:
$55,014
Salary/wage: $35,597 (reported on 75.6% of returns)
Here:
$35,597
State:
$46,010
(% of AGI for various income ranges: 99.2% for AGIs below $10k, 68.9% for AGIs $10k-25k, 76.6% for AGIs $25k-50k, 68.5% for AGIs $50k-75k, 69.7% for AGIs $75k-100k, 64.1% for AGIs over 100k)
Taxable interest for individuals: $792 (reported on 43.9% of returns)
This zip code:
$792
Colorado:
$2,127
(% of AGI for various income ranges: 3.0% for AGIs below $10k, 1.8% for AGIs $10k-25k, 1.0% for AGIs $25k-50k, 0.4% for AGIs $50k-75k, 1.7% for AGIs $75k-100k, 0.2% for AGIs over 100k)
Taxable dividends: $1,319 (reported on 24.6% of returns)
Here:
$1,319
State:
$3,782
(% of AGI for various income ranges: 6.2% for AGIs below $10k, 0.6% for AGIs $10k-25k, 1.1% for AGIs $25k-50k, 0.4% for AGIs $50k-75k, 1.0% for AGIs $75k-100k, 0.4% for AGIs over 100k)
Net capital gain/loss: +$4,495 (reported on 21.8% of returns)
Here:
+$4,495
State:
+$17,882
(% of AGI for various income ranges: -5.4% for AGIs below $10k, 0.2% for AGIs $10k-25k, 1.0% for AGIs $25k-50k, 0.5% for AGIs $50k-75k, 4.2% for AGIs $75k-100k, 7.4% for AGIs over 100k)
Profit/loss from business: +$8,128 (reported on 23.1% of returns)
Here:
+$8,128
State:
+$11,247
(% of AGI for various income ranges: 12.2% for AGIs below $10k, 14.3% for AGIs $10k-25k, 5.0% for AGIs $25k-50k, 7.7% for AGIs $50k-75k, 1.3% for AGIs over 100k)
IRA payment deduction: $3,421 (reported on 4.0% of returns)
80819:
$3,421
Colorado:
$2,947
Total itemized deductions: $15,486 (26% of AGI, reported on 39.2% of returns)
Here:
$15,486
State:
$20,560
Here:
26.0% of AGI
State:
21.4% of AGI
(% of AGI for various income ranges: 43.0% for AGIs below $10k, 16.2% for AGIs $10k-25k, 14.6% for AGIs $25k-50k, 17.8% for AGIs $50k-75k, 14.1% for AGIs $75k-100k, 14.8% for AGIs over 100k)
Charity contributions deductions: $2,265 (4% of AGI, reported on 28.0% of returns)
Here:
$2,265
State:
$3,518
Here:
3.5% of AGI
State:
3.4% of AGI
(% of AGI for various income ranges: 1.6% for AGIs $10k-25k, 1.3% for AGIs $25k-50k, 0.9% for AGIs $50k-75k, 2.0% for AGIs $75k-100k, 2.9% for AGIs over 100k)
Total tax: $5,080 (reported on 76.9% of returns)
80819:
$5,080
State:
$9,173
(% of AGI for various income ranges: 5.9% for AGIs below $10k, 5.8% for AGIs $10k-25k, 8.0% for AGIs $25k-50k, 10.5% for AGIs $50k-75k, 10.2% for AGIs $75k-100k, 15.5% for AGIs over 100k)
Earned income credit: $1,206 (reported on 13.3% of returns)
Here:
$1,206
State:
$1,595
Percentage of individuals using paid preparers for their 2004 taxes: 55.5%
Here:
56%
State:
55%
(% for various income ranges: 49.5% for AGIs below $10k, 55.3% for AGIs $10k-25k, 57.9% for AGIs $25k-50k, 51.6% for AGIs $50k-75k, 55.9% for AGIs $75k-100k, 75.0% for AGIs over 100k)
Notable locations in zip code 80819: Springdale Campground (A), Green Mountain Falls / Chipita Park Fire Department Station 1 (B). Display/hide their locations on the map
In group quarters: 50 (-1 institutionalized population)
Size of family households: 107 2-persons, 17 3-persons, 29 4-persons
Size of nonfamily households: 156 1-person, 66 2-persons
37 married couples with children.
0 single-parent households ().
99.0% of residents of 80819 zip code speak English at home.
0.3% of residents speak Spanish at home (100% very well).
0.6% of residents speak Asian or Pacific Island language at home (100% very well).
Foreign born population: 13 (1.9%) (100.0% of them are naturalized citizens)
This zip code:
1.9%
Whole state:
9.5%
62%Japan
38%Fiji
38%European
15%English
9%Swedish
7%German
5%Italian
3%Irish
3%Scandinavian
Year of entry for the foreign-born population
02010 or later
02000 to 2009
01990 to 1999
13Before 1990
Facilities with environmental interests located in this zip code:
AGAPE FELLOWSHIP SCHOOL (10840 UTE PASS AVENUE in GREEN MOUNTAIN FALLS, CO)
COMPLIANCE ACTIVITY (Tracking inspections of insecticide, fungicide, and rodenticide, and toxic substances) Alternative names: ROCKY MOUNTAIN CHRISTIAN CENTER (AGAPE
Housing units lacking complete plumbing facilities: 8.1% Housing units lacking complete kitchen facilities: 10.0%
90.2%Utility gas
6.8%Electricity
3.4%Other fuel
Place of birth for U.S.-born residents:
This state: 250
Northeast: 147
Midwest: 109
South: 111
West: 77
45% of the 80819 zip code residents lived in the same house 5 years ago. Out of people who lived in different houses, 43% lived in this county. Out of people who lived in different counties, 50% lived in Colorado.
100% of the 80819 zip code residents lived in the same house 1 year ago. Out of people who lived in different houses, 100% moved from different county within same state. Out of people who lived in different houses, 500% moved from different state.
Private vs. public school enrollment:
Students in private schools in grades 1 to 8 (elementary and middle school): 3
Here:
51.5%
Colorado:
11.4%
Students in private schools in grades 9 to 12 (high school): 4
Here:
5.5%
Colorado:
8.5%
Students in private undergraduate colleges:
Here:
0.0%
Colorado:
14.0%
Occupation by median earnings in the past 12 months ($)
212,002Architecture and engineering occupations
50,128Office and administrative support occupations
43,633Management occupations
20,044Sales and related occupations
7,004Personal care and service occupations
Top industries in this zip code by the number of employees in 2005:
Health Care and Social Assistance: Residential Mental Health and Substance Abuse Facilities (50-99 employees: 2 establishments)
Accommodation and Food Services: Full-Service Restaurants (10-19: 2)
Other Services (except Public Administration): Religious Organizations (10-19: 1, 1-4: 2)
Accommodation and Food Services: Drinking Places (Alcoholic Beverages) (5-9: 2)
Administrative and Support and Waste Management and Remediation Services: Travel Agencies (5-9: 1)
Health Care and Social Assistance: Child Day Care Services (5-9: 1)
Administrative and Support and Waste Management and Remediation Services: Landscaping Services (1-4: 1)
Construction: Commercial and Institutional Building Construction (1-4: 1)
Construction: Site Preparation Contractors (1-4: 1)
People in group quarters in 2010:
56 people in residential treatment centers for juveniles (non-correctional)
People in group quarters in 2000:
47 people in homes for abused, dependent, and neglected children
Home Mortgage Disclosure Act Aggregated Statistics For Year 2009 (Based on 2 partial tracts)
A) FHA, FSA/RHS & VA Home Purchase Loans
B) Conventional Home Purchase Loans
C) Refinancings
D) Home Improvement Loans
F) Non-occupant Loans on < 5 Family Dwellings (A B C & D)
Number
Average Value
Number
Average Value
Number
Average Value
Number
Average Value
Number
Average Value
LOANS ORIGINATED
3
$182,430
8
$275,094
33
$252,156
2
$130,270
6
$179,683
APPLICATIONS APPROVED, NOT ACCEPTED
0
$0
0
$0
1
$311,340
0
$0
0
$0
APPLICATIONS DENIED
1
$327,820
2
$212,975
11
$282,765
1
$167,500
2
$171,450
APPLICATIONS WITHDRAWN
0
$0
2
$176,900
7
$250,163
0
$0
1
$211,350
FILES CLOSED FOR INCOMPLETENESS
0
$0
0
$0
0
$0
0
$0
0
$0
Aggregated Statistics For Year 2008 (Based on 2 partial tracts)
A) FHA, FSA/RHS & VA Home Purchase Loans
B) Conventional Home Purchase Loans
C) Refinancings
D) Home Improvement Loans
F) Non-occupant Loans on < 5 Family Dwellings (A B C & D)
Number
Average Value
Number
Average Value
Number
Average Value
Number
Average Value
Number
Average Value
LOANS ORIGINATED
1
$308,560
8
$226,982
17
$210,615
1
$21,580
2
$183,165
APPLICATIONS APPROVED, NOT ACCEPTED
0
$0
1
$198,820
2
$201,840
0
$0
0
$0
APPLICATIONS DENIED
0
$0
1
$349,620
10
$250,235
2
$104,515
1
$200,220
APPLICATIONS WITHDRAWN
0
$0
1
$211,350
4
$195,808
0
$0
0
$0
FILES CLOSED FOR INCOMPLETENESS
0
$0
0
$0
1
$155,440
0
$0
0
$0
Aggregated Statistics For Year 2007 (Based on 2 partial tracts)
A) FHA, FSA/RHS & VA Home Purchase Loans
B) Conventional Home Purchase Loans
C) Refinancings
D) Home Improvement Loans
F) Non-occupant Loans on < 5 Family Dwellings (A B C & D)
Number
Average Value
Number
Average Value
Number
Average Value
Number
Average Value
Number
Average Value
LOANS ORIGINATED
1
$288,140
14
$224,775
18
$240,584
3
$85,607
6
$214,097
APPLICATIONS APPROVED, NOT ACCEPTED
0
$0
1
$241,510
5
$203,232
0
$0
0
$0
APPLICATIONS DENIED
0
$0
4
$400,025
14
$316,332
2
$49,880
3
$177,480
APPLICATIONS WITHDRAWN
0
$0
2
$174,115
6
$263,088
1
$144,770
0
$0
FILES CLOSED FOR INCOMPLETENESS
0
$0
0
$0
2
$190,590
0
$0
0
$0
Aggregated Statistics For Year 2006 (Based on 2 partial tracts)
A) FHA, FSA/RHS & VA Home Purchase Loans
B) Conventional Home Purchase Loans
C) Refinancings
D) Home Improvement Loans
F) Non-occupant Loans on < 5 Family Dwellings (A B C & D)
Number
Average Value
Number
Average Value
Number
Average Value
Number
Average Value
Number
Average Value
LOANS ORIGINATED
1
$117,390
24
$186,750
22
$189,565
3
$87,773
6
$211,970
APPLICATIONS APPROVED, NOT ACCEPTED
0
$0
2
$230,955
5
$210,702
0
$0
1
$245,220
APPLICATIONS DENIED
0
$0
3
$179,180
12
$198,012
0
$0
1
$189,540
APPLICATIONS WITHDRAWN
0
$0
2
$178,290
8
$187,775
0
$0
1
$102,310
FILES CLOSED FOR INCOMPLETENESS
0
$0
0
$0
1
$159,380
0
$0
0
$0
Aggregated Statistics For Year 2005 (Based on 2 partial tracts)
A) FHA, FSA/RHS & VA Home Purchase Loans
B) Conventional Home Purchase Loans
C) Refinancings
D) Home Improvement Loans
F) Non-occupant Loans on < 5 Family Dwellings (A B C & D)
Number
Average Value
Number
Average Value
Number
Average Value
Number
Average Value
Number
Average Value
LOANS ORIGINATED
2
$174,230
26
$200,136
31
$204,632
3
$93,807
6
$158,185
APPLICATIONS APPROVED, NOT ACCEPTED
0
$0
3
$156,677
5
$209,728
0
$0
1
$135,490
APPLICATIONS DENIED
0
$0
5
$189,220
11
$212,133
3
$98,447
3
$112,907
APPLICATIONS WITHDRAWN
0
$0
6
$224,190
9
$227,772
2
$70,180
1
$275,850
FILES CLOSED FOR INCOMPLETENESS
0
$0
0
$0
4
$209,265
0
$0
0
$0
Aggregated Statistics For Year 2004 (Based on 2 partial tracts)
A) FHA, FSA/RHS & VA Home Purchase Loans
B) Conventional Home Purchase Loans
C) Refinancings
D) Home Improvement Loans
F) Non-occupant Loans on < 5 Family Dwellings (A B C & D)
Number
Average Value
Number
Average Value
Number
Average Value
Number
Average Value
Number
Average Value
LOANS ORIGINATED
1
$173,540
20
$214,809
32
$180,308
4
$99,065
8
$162,661
APPLICATIONS APPROVED, NOT ACCEPTED
0
$0
3
$146,160
7
$203,431
0
$0
1
$212,740
APPLICATIONS DENIED
0
$0
3
$196,660
13
$208,408
1
$70,530
3
$168,820
APPLICATIONS WITHDRAWN
0
$0
4
$186,355
13
$172,501
0
$0
1
$100,220
FILES CLOSED FOR INCOMPLETENESS
0
$0
1
$141,060
4
$193,140
0
$0
0
$0
Aggregated Statistics For Year 2003 (Based on 2 partial tracts)
A) FHA, FSA/RHS & VA Home Purchase Loans
B) Conventional Home Purchase Loans
C) Refinancings
D) Home Improvement Loans
F) Non-occupant Loans on < 5 Family Dwellings (A B C & D)
Number
Average Value
Number
Average Value
Number
Average Value
Number
Average Value
Number
Average Value
LOANS ORIGINATED
2
$197,200
14
$212,031
85
$166,775
2
$47,210
8
$136,706
APPLICATIONS APPROVED, NOT ACCEPTED
0
$0
2
$157,645
10
$129,827
0
$0
1
$120,870
APPLICATIONS DENIED
0
$0
2
$70,645
18
$185,446
1
$20,880
2
$159,615
APPLICATIONS WITHDRAWN
0
$0
2
$108,110
13
$175,660
2
$20,995
2
$130,150
FILES CLOSED FOR INCOMPLETENESS
0
$0
0
$0
3
$167,503
0
$0
0
$0
Aggregated Statistics For Year 2002 (Based on 2 partial tracts)
A) FHA, FSA/RHS & VA Home Purchase Loans
B) Conventional Home Purchase Loans
C) Refinancings
D) Home Improvement Loans
F) Non-occupant Loans on < 5 Family Dwellings (A B C & D)
Number
Average Value
Number
Average Value
Number
Average Value
Number
Average Value
Number
Average Value
LOANS ORIGINATED
2
$141,170
17
$240,871
59
$174,665
4
$32,365
6
$196,388
APPLICATIONS APPROVED, NOT ACCEPTED
0
$0
3
$253,113
7
$146,823
0
$0
1
$296,730
APPLICATIONS DENIED
0
$0
1
$145,930
10
$126,834
2
$9,510
2
$95,350
APPLICATIONS WITHDRAWN
0
$0
3
$171,990
8
$142,622
1
$12,760
1
$144,070
FILES CLOSED FOR INCOMPLETENESS
0
$0
1
$148,250
2
$219,590
0
$0
0
$0
Aggregated Statistics For Year 2001 (Based on 2 partial tracts)
A) FHA, FSA/RHS & VA Home Purchase Loans
B) Conventional Home Purchase Loans
C) Refinancings
D) Home Improvement Loans
F) Non-occupant Loans on < 5 Family Dwellings (A B C & D)
Number
Average Value
Number
Average Value
Number
Average Value
Number
Average Value
Number
Average Value
LOANS ORIGINATED
3
$125,127
16
$180,264
49
$163,797
4
$53,765
4
$148,422
APPLICATIONS APPROVED, NOT ACCEPTED
0
$0
1
$201,610
6
$180,110
0
$0
0
$0
APPLICATIONS DENIED
0
$0
3
$92,260
10
$199,102
1
$24,590
0
$0
APPLICATIONS WITHDRAWN
0
$0
2
$90,015
10
$158,758
1
$15,310
1
$128,060
FILES CLOSED FOR INCOMPLETENESS
0
$0
0
$0
2
$187,920
0
$0
0
$0
Aggregated Statistics For Year 2000 (Based on 2 partial tracts)
A) FHA, FSA/RHS & VA Home Purchase Loans
B) Conventional Home Purchase Loans
C) Refinancings
D) Home Improvement Loans
F) Non-occupant Loans on < 5 Family Dwellings (A B C & D)
Number
Average Value
Number
Average Value
Number
Average Value
Number
Average Value
Number
Average Value
LOANS ORIGINATED
3
$121,567
13
$163,078
12
$142,332
6
$36,695
3
$108,343
APPLICATIONS APPROVED, NOT ACCEPTED
0
$0
3
$216,147
3
$168,587
1
$45,240
0
$0
APPLICATIONS DENIED
0
$0
6
$74,627
5
$84,448
2
$32,250
0
$0
APPLICATIONS WITHDRAWN
0
$0
2
$136,415
3
$78,183
1
$39,440
0
$0
FILES CLOSED FOR INCOMPLETENESS
0
$0
0
$0
1
$93,030
0
$0
0
$0
Aggregated Statistics For Year 1999 (Based on 1 partial tract)
A) FHA, FSA/RHS & VA Home Purchase Loans
B) Conventional Home Purchase Loans
C) Refinancings
D) Home Improvement Loans
F) Non-occupant Loans on < 5 Family Dwellings (A B C & D)
Detailed PMIC statistics for the following Tracts:0034.00
2006 - 2018 National Fire Incident Reporting System (NFIRS) incidents
According to the data from the years 2006 - 2018 the average number of fires per year is 10. The highest number of fires - 20 took place in 2010, and the least - 2 in 2017. The data has a dropping trend.
When looking into fire subcategories, the most reports belonged to: Outside Fires (51.5%), and Structure Fires (33.8%).
Fire incident types reported to NFIRS in Zip Code 80819

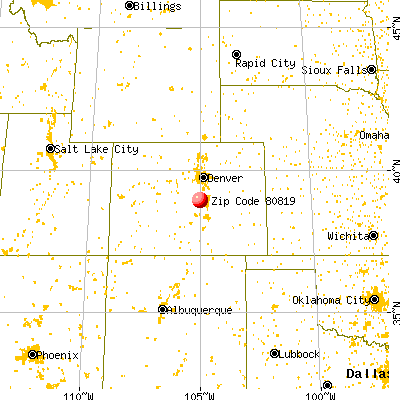


 Nearest zip codes: 80809, 80921, 80863, 80133, 80840, 80829.


 According to the data from the years 2006 - 2018 the average number of fires per year is 10. The highest number of fires - 20 took place in 2010, and the least - 2 in 2017. The data has a dropping trend.
 When looking into fire subcategories, the most reports belonged to: Outside Fires (51.5%), and Structure Fires (33.8%).