Estimated zip code population in 2022: 1,918 Zip code population in 2010: 1,432 Zip code population in 2000: 1,374
Houses and condos: 713 Renter-occupied apartments: 54
% of renters here:
8%
State:
34%
March 2022 cost of living index in zip code 80650: 101.8 (near average, U.S. average is 100)
Land area: 50.7 sq. mi. Water area: 0.1 sq. mi.
Population density: 38 people per square mile
(very low).
OSM Map
General Map
Google Map
MSN Map
OSM Map
General Map
Google Map
MSN Map
OSM Map
General Map
Google Map
MSN Map
OSM Map
General Map
Google Map
MSN Map
Please wait while loading the map...
Real estate property taxes paid for housing units in 2022:
This zip code:
0.4% ($1,426)
Colorado:
0.5% ($2,422)
Median real estate property taxes paid for housing units with mortgages in 2022: $1,362 (0.4%) Median real estate property taxes paid for housing units with no mortgage in 2022: $1,510 (0.4%)
Business Search- 14 Million verified businesses
Males: 868
(45.3%)
Females: 1,050
(54.7%)
For population 25 years and over in 80650:
High school or higher: 95.2%
Bachelor's degree or higher: 19.3%
Graduate or professional degree: 8.7%
Unemployed: 16.1%
Mean travel time to work (commute): 37.5 minutes
For population 15 years and over in 80650:
Never married: 26.8%
Now married: 57.4%
Separated: 1.2%
Widowed: 11.2%
Divorced: 3.4%
Zip code 80650 compared to state average:
Unemployed percentage significantly above state average.
Black race population percentage significantly below state average.
Hispanic race population percentage below state average.
Median age above state average.
Foreign-born population percentage significantly below state average.
Renting percentage significantly below state average.
Length of stay since moving in significantly above state average.
Number of college students below state average.
Percentage of population with a bachelor's degree or higher significantly below state average.
Averages for the 2020 tax year for zip code 80650, filed in 2021:
Average Adjusted Gross Income (AGI) in 2020: $64,410 (Individual Income Tax Returns)
Here:
$64,410
State:
$89,260
Salary/wage: $59,157 (reported on 86.4% of returns)
Here:
$59,157
State:
$70,330
(% of AGI for various income ranges: 1376.4% for AGIs below $25k, 4070.0% for AGIs $25k-50k, 7560.0% for AGIs $50k-75k, 10862.5% for AGIs $75k-100k, 21682.2% for AGIs $100k-200k)
Taxable interest for individuals: $550 (reported on 22.7% of returns)
This zip code:
$550
Colorado:
$2,176
(% of AGI for various income ranges: 7.9% for AGIs below $25k, 6.9% for AGIs $25k-50k, 14.5% for AGIs $50k-75k, 7.5% for AGIs $75k-100k, 73.3% for AGIs $100k-200k)
Ordinary dividends: $1,610 (reported on 11.4% of returns)
Here:
$1,610
State:
$8,820
(% of AGI for various income ranges: 36.4% for AGIs below $25k, 14.5% for AGIs $50k-75k, 104.4% for AGIs $100k-200k)
Net capital gain/loss in AGI: +$12,115 (reported on 14.8% of returns)
Here:
+$12,115
State:
+$37,276
(% of AGI for various income ranges: 18.6% for AGIs below $25k, 28.2% for AGIs $50k-75k, 1686.7% for AGIs $100k-200k)
Profit/loss from business: +$5,600 (reported on 17.0% of returns)
Here:
+$5,600
State:
+$15,295
(% of AGI for various income ranges: 208.6% for AGIs below $25k, 6.2% for AGIs $25k-50k, 190.0% for AGIs $50k-75k, 200.0% for AGIs $75k-100k, 187.8% for AGIs $100k-200k)
Taxable individual retirement arrangement distribution: $12,367 (reported on 6.8% of returns)
80650:
$12,367
Colorado:
$23,785
(% of AGI for various income ranges: 216.9% for AGIs $25k-50k, 493.8% for AGIs $75k-100k)
Total itemized deductions: $25,975 (reported on 9.1% of returns)
Here:
$25,975
State:
$35,141
(% of AGI for various income ranges: 1200.0% for AGIs $75k-100k, 1242.2% for AGIs $100k-200k)
Charity contributions: $6,475 (reported on 4.5% of returns)
Here:
$6,475
State:
$12,103
(% of AGI for various income ranges: 287.8% for AGIs $100k-200k)
Taxes paid: $6,038 (reported on 9.1% of returns)
80650:
$6,038
State:
$7,710
(% of AGI for various income ranges: 55.6% for AGIs $25k-50k, 148.8% for AGIs $75k-100k, 305.6% for AGIs $100k-200k)
Earned income credit: $1,980 (reported on 11.4% of returns)
Here:
$1,980
State:
$2,053
(% of AGI for various income ranges: 62.9% for AGIs below $25k, 68.8% for AGIs $25k-50k)
Percentage of individuals using paid preparers for their 2020 taxes: 94.3%
Here:
94%
State:
93%
(% for various income ranges: 95.2% for AGIs below $25k, 95.2% for AGIs $25k-50k, 93.8% for AGIs $50k-75k, 91.7% for AGIs $75k-100k, 94.4% for AGIs $100k-200k)
Averages for the 2012 tax year for zip code 80650, filed in 2013:
Average Adjusted Gross Income (AGI) in 2012: $48,709 (Individual Income Tax Returns)
Here:
$48,709
State:
$69,103
Salary/wage: $44,522 (reported on 85.9% of returns)
Here:
$44,522
State:
$54,794
(% of AGI for various income ranges: 78.5% for AGIs below $25k, 81.6% for AGIs $25k-50k, 81.3% for AGIs $50k-75k, 85.2% for AGIs $75k-100k, 69.3% for AGIs $100k-200k)
Taxable interest for individuals: $724 (reported on 26.6% of returns)
This zip code:
$724
Colorado:
$1,971
(% of AGI for various income ranges: 0.5% for AGIs below $25k, 0.4% for AGIs $25k-50k, 0.2% for AGIs $50k-75k, 0.1% for AGIs $75k-100k, 0.6% for AGIs $100k-200k)
Ordinary dividends: $1,056 (reported on 14.1% of returns)
Here:
$1,056
State:
$7,140
Net capital gain/loss in AGI: +$3,329 (reported on 10.9% of returns)
Here:
+$3,329
State:
+$23,009
Profit/loss from business: +$5,973 (reported on 17.2% of returns)
Here:
+$5,973
State:
+$13,514
(% of AGI for various income ranges: 9.5% for AGIs below $25k, 5.1% for AGIs $25k-50k, 0.9% for AGIs $75k-100k)
Taxable individual retirement arrangement distribution: $12,025 (reported on 6.2% of returns)
80650:
$12,025
Colorado:
$17,927
Total itemized deductions: $17,432 (22% of AGI, reported on 29.7% of returns)
Here:
$17,432
State:
$24,621
Here:
22.1% of AGI
State:
18.5% of AGI
(% of AGI for various income ranges: 12.6% for AGIs $25k-50k, 8.0% for AGIs $50k-75k, 14.3% for AGIs $75k-100k, 12.0% for AGIs $100k-200k)
Charity contributions: $2,046 (reported on 20.3% of returns)
Here:
$2,046
State:
$4,449
(% of AGI for various income ranges: 1.3% for AGIs $25k-50k, 0.3% for AGIs $50k-75k, 1.1% for AGIs $75k-100k, 1.0% for AGIs $100k-200k)
Taxes paid: $3,916 (reported on 29.7% of returns)
80650:
$3,916
State:
$7,641
(% of AGI for various income ranges: 1.6% for AGIs $25k-50k, 1.8% for AGIs $50k-75k, 3.0% for AGIs $75k-100k, 3.8% for AGIs $100k-200k)
Earned income credit: $1,982 (reported on 17.2% of returns)
Here:
$1,982
State:
$2,095
(% of AGI for various income ranges: 5.4% for AGIs below $25k, 1.1% for AGIs $25k-50k)
Percentage of individuals using paid preparers for their 2012 taxes: 59.4%
Here:
59%
State:
49%
(% for various income ranges: 52.4% for AGIs below $25k, 61.1% for AGIs $25k-50k, 58.3% for AGIs $50k-75k, 71.4% for AGIs $75k-100k, 66.7% for AGIs $100k-200k)
Averages for the 2004 tax year for zip code 80650, filed in 2005:
Average Adjusted Gross Income (AGI) in 2004: $39,237 (Individual Income Tax Returns)
Here:
$39,237
State:
$55,014
Salary/wage: $34,826 (reported on 86.2% of returns)
Here:
$34,826
State:
$46,010
(% of AGI for various income ranges: 109.8% for AGIs below $10k, 82.5% for AGIs $10k-25k, 86.7% for AGIs $25k-50k, 86.2% for AGIs $50k-75k, 86.9% for AGIs $75k-100k, 34.0% for AGIs over 100k)
Taxable interest for individuals: $1,024 (reported on 34.5% of returns)
This zip code:
$1,024
Colorado:
$2,127
(% of AGI for various income ranges: 2.2% for AGIs below $10k, 2.7% for AGIs $10k-25k, 0.8% for AGIs $25k-50k, 0.3% for AGIs $50k-75k, 0.2% for AGIs $75k-100k, 1.3% for AGIs over 100k)
Taxable dividends: $862 (reported on 15.7% of returns)
Here:
$862
State:
$3,782
(% of AGI for various income ranges: 0.8% for AGIs below $10k, 0.2% for AGIs $10k-25k, 0.2% for AGIs $25k-50k, 0.5% for AGIs $50k-75k, 0.1% for AGIs $75k-100k, 0.5% for AGIs over 100k)
Net capital gain/loss: +$16,292 (reported on 14.8% of returns)
Here:
+$16,292
State:
+$17,882
(% of AGI for various income ranges: 0.0% for AGIs below $10k, 0.4% for AGIs $10k-25k, 1.2% for AGIs $25k-50k, 2.5% for AGIs $50k-75k, 26.5% for AGIs over 100k)
Profit/loss from business: +$4,738 (reported on 17.8% of returns)
Here:
+$4,738
State:
+$11,247
(% of AGI for various income ranges: 4.4% for AGIs below $10k, 7.4% for AGIs $10k-25k, 2.4% for AGIs $25k-50k, 1.5% for AGIs $50k-75k, 1.9% for AGIs $75k-100k)
IRA payment deduction: $1,800 (reported on 2.5% of returns)
80650:
$1,800
Colorado:
$2,947
Total itemized deductions: $15,549 (25% of AGI, reported on 32.5% of returns)
Here:
$15,549
State:
$20,560
Here:
25.1% of AGI
State:
21.4% of AGI
(% of AGI for various income ranges: 11.0% for AGIs $10k-25k, 13.4% for AGIs $25k-50k, 16.6% for AGIs $50k-75k, 14.7% for AGIs $75k-100k, 7.7% for AGIs over 100k)
Charity contributions deductions: $1,216 (2% of AGI, reported on 24.7% of returns)
Here:
$1,216
State:
$3,518
Here:
1.9% of AGI
State:
3.4% of AGI
(% of AGI for various income ranges: 0.5% for AGIs $10k-25k, 0.6% for AGIs $25k-50k, 0.7% for AGIs $50k-75k, 1.7% for AGIs $75k-100k, 0.6% for AGIs over 100k)
Total tax: $4,932 (reported on 73.8% of returns)
80650:
$4,932
State:
$9,173
(% of AGI for various income ranges: 3.2% for AGIs below $10k, 4.0% for AGIs $10k-25k, 6.1% for AGIs $25k-50k, 8.0% for AGIs $50k-75k, 9.7% for AGIs $75k-100k, 18.3% for AGIs over 100k)
Earned income credit: $1,571 (reported on 16.3% of returns)
Here:
$1,571
State:
$1,595
Percentage of individuals using paid preparers for their 2004 taxes: 65.3%
Here:
65%
State:
55%
(% for various income ranges: 54.8% for AGIs below $10k, 63.8% for AGIs $10k-25k, 74.1% for AGIs $25k-50k, 65.7% for AGIs $50k-75k, 59.5% for AGIs $75k-100k, 78.3% for AGIs over 100k)
Likely homosexual households (counted as self-reported same-sex unmarried-partner households)
Lesbian couples: 0.0% of all households
Gay men: 0.4% of all households
Household received Food Stamps/SNAP in the past 12 months: 47 Household did not receive Food Stamps/SNAP in the past 12 months: 648
Women who had a birth in the past 12 months: 16 (16 now married, 0 unmarried) Women who did not have a birth in the past 12 months: 511 (244 now married, 266 unmarried)
Housing units in zip code 80650 with a mortgage: 365 (6 second mortgage, 6 both second mortgage and home equity loan) Houses without a mortgage: 82
Median monthly owner costs for units with a mortgage: $1,606 Median monthly owner costs for units without a mortgage: $498
Residents with income below the poverty level in 2022:
This zip code:
27.1%
Whole state:
9.4%
Residents with income below 50% of the poverty level in 2022:
This zip code:
26.1%
Whole state:
4.6%
Median number of rooms in houses and condos:
Here:
6.0
State:
6.8
Median number of rooms in apartments:
Here:
5.8
State:
4.0
Notable locations in this zip code not listed on our city pages
Notable locations in zip code 80650: Weld County Gravel Pit (A), Ault - Pierce Fire Department Station 2 (B), Bonnie Plant Farms (C). Display/hide their locations on the map
Reservoirs: Coal Bank Watershed CB-1 Reservoir (A), Crom Lake (B), Boyd Number 2 Reservoir (C), Antelope Reservoir (D), Rowe Brothers Reservoir (E). Display/hide their locations on the map
Size of family households: 200 2-persons, 52 3-persons, 43 4-persons, 143 5-persons, 7 6-persons
Size of nonfamily households: 225 1-person, 15 2-persons
243 married couples with children.
2 single-parent households (2 men).
93.6% of residents of 80650 zip code speak English at home.
4.5% of residents speak Spanish at home (75% very well, 21% well, 4% not well).
0.8% of residents speak other Indo-European language at home (100% very well).
0.4% of residents speak Asian or Pacific Island language at home (12% well, 88% not at all).
Foreign born population: 73 (3.8%) (64.9% of them are naturalized citizens)
This zip code:
3.8%
Whole state:
9.5%
67%Guatemala
25%Honduras
11%Guyana
4%Costa Rica
3%Indonesia
1%Belarus
29%German
9%American
9%English
6%Irish
6%European
2%Italian
2%Swedish
Year of entry for the foreign-born population
22010 or later
92000 to 2009
31990 to 1999
65Before 1990
Facilities with environmental interests located in this zip code:
HIGHLAND ELEMENTARY SCHOOL (101 2ND STREET in PIERCE, CO)
(National Center for Education Statistics) - STATE ID-3958 Organizations: AULT-HIGHLAND RE-9 (SCHOOL DISTRICT)
CHEVRON BLACK HOLLOW FIELD (COUTY ROAD 86 in PIERCE, CO)
(Resource Conservation and Recovery Act (tracking hazardous waste)) Organizations: CHEVRON USA INC (CONTACT/OWNER)
CHEVRON PIERCE UNIT (NORTH OF PIERCE ON HWY 85 in PIERCE, CO)
(Resource Conservation and Recovery Act (tracking hazardous waste)) Organizations: CHEVRON USA INC (CONTACT/OWNER)
GOODWINOL PRODUCTS CORPORATION (41710 WELD COUNTY ROAD 29/P BOX 407 in PIERCE, CO)
COMPLIANCE ACTIVITY (Tracking inspections of insecticide, fungicide, and rodenticide, and toxic substances)
HAWKINS MANUFACTURING CO (1101 1ST STREET in PIERCE, CO)
(Resource Conservation and Recovery Act (tracking hazardous waste))
56TH & PIERCE (56TH & PIERCE in PIERCE, CO)
CRITERIA AND HAZARDOUS AIR POLLUTANT INVENTORY (Inventory of air pollution sources) Business SIC classification: REFUSE SYSTEMS Business NAICS classification: SOLID WASTE LANDFILL.
62.7%Utility gas
18.7%Bottled, tank, or LP gas
14.0%Electricity
5.0%Other fuel
Population in 1990: 1,020. Population change in the 1990s: +354 (+34.7%).
Place of birth for U.S.-born residents:
This state: 992
Northeast: 40
Midwest: 201
South: 364
West: 235
57% of the 80650 zip code residents lived in the same house 5 years ago. Out of people who lived in different houses, 70% lived in this county. Out of people who lived in different counties, 50% lived in Colorado.
83% of the 80650 zip code residents lived in the same house 1 year ago. Out of people who lived in different houses, 75% moved from this county. Out of people who lived in different houses, 8% moved from different county within same state. Out of people who lived in different houses, 10% moved from different state.
Private vs. public school enrollment:
Students in private schools in grades 1 to 8 (elementary and middle school): 35
Here:
12.8%
Colorado:
11.4%
Students in private schools in grades 9 to 12 (high school): 13
Here:
19.2%
Colorado:
8.5%
Students in private undergraduate colleges:
Here:
0.0%
Colorado:
14.0%
Occupation by median earnings in the past 12 months ($)
95,402Business and financial operations occupations
76,022Computer and mathematical occupations
73,468Education, training, and library occupations
69,950Management occupations
59,131Health technologists and technicians
55,337Installation, maintenance, and repair occupations
Top industries in this zip code by the number of employees in 2005:
Construction: Commercial and Institutional Building Construction (20-49 employees: 1 establishment)
Construction: Structural Steel and Precast Concrete Contractors (5-9: 1)
Other Services (except Public Administration): General Automotive Repair (5-9: 1)
Construction: Poured Concrete Foundation and Structure Contractors (5-9: 1)
Accommodation and Food Services: Drinking Places (Alcoholic Beverages) (1-4: 2)
Finance and Insurance: Commodity Contracts Dealing (1-4: 1)
Construction: All Other Specialty Trade Contractors (1-4: 1)
Construction: Plumbing, Heating, and Air-Conditioning Contractors (1-4: 1)
Fatal accident statistics in 2014:
Fatal accident count: 1
Vehicles involved in fatal accidents: 1
Fatal accidents caused by drunken drivers: 1
Fatalities: 1
Persons involved in fatal accidents: 1
Pedestrians involved in fatal accidents: 0
Fatal accident statistics in 2011:
Fatal accident count: 1
Vehicles involved in fatal accidents: 1
Fatal accidents caused by drunken drivers: 0
Fatalities: 1
Persons involved in fatal accidents: 2
Pedestrians involved in fatal accidents: 0
Home Mortgage Disclosure Act Aggregated Statistics For Year 2009 (Based on 2 partial tracts)
A) FHA, FSA/RHS & VA Home Purchase Loans
B) Conventional Home Purchase Loans
C) Refinancings
D) Home Improvement Loans
F) Non-occupant Loans on < 5 Family Dwellings (A B C & D)
G) Loans On Manufactured Home Dwelling (A B C & D)
Number
Average Value
Number
Average Value
Number
Average Value
Number
Average Value
Number
Average Value
Number
Average Value
LOANS ORIGINATED
16
$171,184
7
$228,446
40
$203,350
2
$131,015
3
$92,110
3
$187,027
APPLICATIONS APPROVED, NOT ACCEPTED
0
$0
0
$0
3
$151,277
1
$98,000
0
$0
1
$187,170
APPLICATIONS DENIED
3
$151,417
3
$146,090
13
$246,115
1
$105,150
1
$201,050
1
$157,730
APPLICATIONS WITHDRAWN
1
$207,780
1
$19,770
11
$225,633
0
$0
0
$0
0
$0
FILES CLOSED FOR INCOMPLETENESS
0
$0
0
$0
2
$266,030
0
$0
0
$0
0
$0
Aggregated Statistics For Year 2008 (Based on 2 partial tracts)
A) FHA, FSA/RHS & VA Home Purchase Loans
B) Conventional Home Purchase Loans
C) Refinancings
D) Home Improvement Loans
F) Non-occupant Loans on < 5 Family Dwellings (A B C & D)
G) Loans On Manufactured Home Dwelling (A B C & D)
Number
Average Value
Number
Average Value
Number
Average Value
Number
Average Value
Number
Average Value
Number
Average Value
LOANS ORIGINATED
6
$160,740
8
$222,288
24
$199,347
2
$58,255
3
$196,280
1
$179,180
APPLICATIONS APPROVED, NOT ACCEPTED
0
$0
2
$64,350
5
$222,076
0
$0
1
$278,440
1
$67,720
APPLICATIONS DENIED
1
$53,840
5
$119,872
19
$184,400
6
$76,058
1
$57,200
3
$72,623
APPLICATIONS WITHDRAWN
1
$128,280
1
$248,150
7
$146,489
1
$155,200
1
$70,660
1
$107,670
FILES CLOSED FOR INCOMPLETENESS
0
$0
0
$0
2
$109,565
0
$0
0
$0
0
$0
Aggregated Statistics For Year 2007 (Based on 2 partial tracts)
A) FHA, FSA/RHS & VA Home Purchase Loans
B) Conventional Home Purchase Loans
C) Refinancings
D) Home Improvement Loans
F) Non-occupant Loans on < 5 Family Dwellings (A B C & D)
G) Loans On Manufactured Home Dwelling (A B C & D)
Number
Average Value
Number
Average Value
Number
Average Value
Number
Average Value
Number
Average Value
Number
Average Value
LOANS ORIGINATED
3
$158,847
24
$154,220
33
$174,116
6
$60,917
3
$154,500
5
$135,770
APPLICATIONS APPROVED, NOT ACCEPTED
0
$0
4
$276,755
7
$145,709
0
$0
0
$0
0
$0
APPLICATIONS DENIED
2
$219,555
5
$92,364
33
$165,245
9
$74,166
3
$149,033
5
$100,440
APPLICATIONS WITHDRAWN
0
$0
1
$227,970
7
$119,150
1
$171,180
0
$0
0
$0
FILES CLOSED FOR INCOMPLETENESS
0
$0
0
$0
2
$220,185
0
$0
0
$0
0
$0
Aggregated Statistics For Year 2006 (Based on 2 partial tracts)
A) FHA, FSA/RHS & VA Home Purchase Loans
B) Conventional Home Purchase Loans
C) Refinancings
D) Home Improvement Loans
F) Non-occupant Loans on < 5 Family Dwellings (A B C & D)
G) Loans On Manufactured Home Dwelling (A B C & D)
Number
Average Value
Number
Average Value
Number
Average Value
Number
Average Value
Number
Average Value
Number
Average Value
LOANS ORIGINATED
4
$106,938
33
$188,684
49
$147,193
5
$148,388
5
$98,000
3
$90,010
APPLICATIONS APPROVED, NOT ACCEPTED
0
$0
5
$298,290
8
$162,089
0
$0
0
$0
0
$0
APPLICATIONS DENIED
1
$102,210
13
$173,740
29
$143,280
5
$48,284
3
$48,650
3
$57,060
APPLICATIONS WITHDRAWN
0
$0
3
$124,077
19
$152,235
2
$211,140
1
$105,990
0
$0
FILES CLOSED FOR INCOMPLETENESS
0
$0
0
$0
4
$154,570
0
$0
1
$86,640
0
$0
Aggregated Statistics For Year 2005 (Based on 2 partial tracts)
A) FHA, FSA/RHS & VA Home Purchase Loans
B) Conventional Home Purchase Loans
C) Refinancings
D) Home Improvement Loans
F) Non-occupant Loans on < 5 Family Dwellings (A B C & D)
G) Loans On Manufactured Home Dwelling (A B C & D)
Number
Average Value
Number
Average Value
Number
Average Value
Number
Average Value
Number
Average Value
Number
Average Value
LOANS ORIGINATED
3
$171,183
38
$141,178
62
$167,216
5
$53,164
8
$126,022
3
$85,240
APPLICATIONS APPROVED, NOT ACCEPTED
0
$0
8
$99,735
6
$137,887
2
$51,525
0
$0
0
$0
APPLICATIONS DENIED
0
$0
17
$131,227
37
$157,088
7
$48,069
2
$125,760
7
$94,996
APPLICATIONS WITHDRAWN
0
$0
9
$145,948
25
$157,910
2
$29,020
0
$0
0
$0
FILES CLOSED FOR INCOMPLETENESS
0
$0
1
$103,470
8
$168,660
0
$0
0
$0
0
$0
Aggregated Statistics For Year 2004 (Based on 2 partial tracts)
A) FHA, FSA/RHS & VA Home Purchase Loans
B) Conventional Home Purchase Loans
C) Refinancings
D) Home Improvement Loans
F) Non-occupant Loans on < 5 Family Dwellings (A B C & D)
G) Loans On Manufactured Home Dwelling (A B C & D)
Number
Average Value
Number
Average Value
Number
Average Value
Number
Average Value
Number
Average Value
Number
Average Value
LOANS ORIGINATED
4
$150,050
29
$174,926
59
$141,699
5
$37,434
8
$107,411
5
$95,056
APPLICATIONS APPROVED, NOT ACCEPTED
0
$0
2
$238,690
13
$150,089
0
$0
1
$119,450
0
$0
APPLICATIONS DENIED
0
$0
9
$116,319
39
$145,032
5
$31,798
4
$145,108
3
$89,167
APPLICATIONS WITHDRAWN
0
$0
3
$169,783
21
$171,084
0
$0
1
$127,440
1
$115,670
FILES CLOSED FOR INCOMPLETENESS
0
$0
0
$0
4
$144,160
0
$0
1
$132,910
0
$0
Aggregated Statistics For Year 2003 (Based on 2 partial tracts)
A) FHA, FSA/RHS & VA Home Purchase Loans
B) Conventional Home Purchase Loans
C) Refinancings
D) Home Improvement Loans
F) Non-occupant Loans on < 5 Family Dwellings (A B C & D)
Number
Average Value
Number
Average Value
Number
Average Value
Number
Average Value
Number
Average Value
LOANS ORIGINATED
5
$145,192
26
$148,520
109
$157,320
4
$9,148
8
$130,176
APPLICATIONS APPROVED, NOT ACCEPTED
0
$0
4
$93,268
14
$161,000
0
$0
1
$167,820
APPLICATIONS DENIED
0
$0
6
$116,787
40
$169,018
5
$36,676
2
$125,550
APPLICATIONS WITHDRAWN
0
$0
4
$138,692
30
$144,995
1
$3,360
3
$146,090
FILES CLOSED FOR INCOMPLETENESS
0
$0
0
$0
1
$227,540
0
$0
0
$0
Aggregated Statistics For Year 2002 (Based on 2 partial tracts)
A) FHA, FSA/RHS & VA Home Purchase Loans
B) Conventional Home Purchase Loans
C) Refinancings
D) Home Improvement Loans
F) Non-occupant Loans on < 5 Family Dwellings (A B C & D)
Number
Average Value
Number
Average Value
Number
Average Value
Number
Average Value
Number
Average Value
LOANS ORIGINATED
9
$134,966
24
$143,670
78
$158,221
8
$15,878
5
$117,348
APPLICATIONS APPROVED, NOT ACCEPTED
1
$143,420
5
$124,834
10
$128,619
3
$13,880
0
$0
APPLICATIONS DENIED
0
$0
8
$89,535
25
$150,726
4
$13,775
0
$0
APPLICATIONS WITHDRAWN
1
$184,220
3
$157,727
22
$163,040
1
$36,170
0
$0
FILES CLOSED FOR INCOMPLETENESS
0
$0
1
$129,120
3
$115,667
0
$0
0
$0
Aggregated Statistics For Year 2001 (Based on 2 partial tracts)
A) FHA, FSA/RHS & VA Home Purchase Loans
B) Conventional Home Purchase Loans
C) Refinancings
D) Home Improvement Loans
F) Non-occupant Loans on < 5 Family Dwellings (A B C & D)
Number
Average Value
Number
Average Value
Number
Average Value
Number
Average Value
Number
Average Value
LOANS ORIGINATED
13
$114,145
24
$125,339
68
$142,460
6
$47,037
6
$141,042
APPLICATIONS APPROVED, NOT ACCEPTED
0
$0
3
$159,407
13
$122,038
1
$35,330
1
$92,530
APPLICATIONS DENIED
1
$123,240
9
$75,989
27
$128,673
4
$22,818
1
$79,910
APPLICATIONS WITHDRAWN
1
$95,480
4
$132,172
15
$133,695
1
$22,290
0
$0
FILES CLOSED FOR INCOMPLETENESS
0
$0
0
$0
5
$131,648
0
$0
0
$0
Aggregated Statistics For Year 2000 (Based on 2 partial tracts)
A) FHA, FSA/RHS & VA Home Purchase Loans
B) Conventional Home Purchase Loans
C) Refinancings
D) Home Improvement Loans
F) Non-occupant Loans on < 5 Family Dwellings (A B C & D)
Number
Average Value
Number
Average Value
Number
Average Value
Number
Average Value
Number
Average Value
LOANS ORIGINATED
7
$112,360
22
$129,487
27
$100,819
8
$24,448
3
$90,990
APPLICATIONS APPROVED, NOT ACCEPTED
0
$0
5
$98,252
4
$85,592
1
$10,090
0
$0
APPLICATIONS DENIED
1
$27,340
14
$77,210
21
$66,315
9
$23,693
2
$43,955
APPLICATIONS WITHDRAWN
1
$102,210
4
$92,428
15
$101,309
0
$0
0
$0
FILES CLOSED FOR INCOMPLETENESS
0
$0
2
$135,645
5
$112,890
0
$0
0
$0
Aggregated Statistics For Year 1999 (Based on 1 partial tract)
A) FHA, FSA/RHS & VA Home Purchase Loans
B) Conventional Home Purchase Loans
C) Refinancings
D) Home Improvement Loans
F) Non-occupant Loans on < 5 Family Dwellings (A B C & D)
Detailed PMIC statistics for the following Tracts:0023.00
2002 - 2018 National Fire Incident Reporting System (NFIRS) incidents
Based on the data from the years 2002 - 2018 the average number of fire incidents per year is 10. The highest number of fire incidents - 27 took place in 2017, and the least - 0 in 2003. The data has a growing trend.
When looking into fire subcategories, the most reports belonged to: Outside Fires (67.0%), and Structure Fires (23.3%).
Fire incident types reported to NFIRS in Zip Code 80650

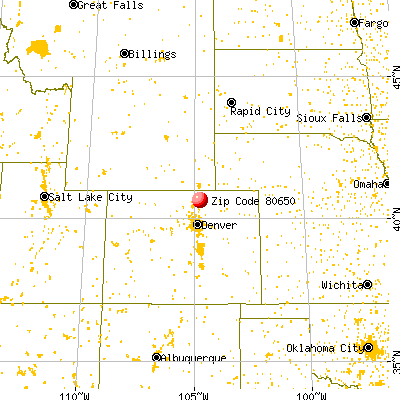


 Nearest zip codes: 80546, 80550, 80648, 80547, 80615, 80524.


 Based on the data from the years 2002 - 2018 the average number of fire incidents per year is 10. The highest number of fire incidents - 27 took place in 2017, and the least - 0 in 2003. The data has a growing trend.
 When looking into fire subcategories, the most reports belonged to: Outside Fires (67.0%), and Structure Fires (23.3%).